Month: January 2022

Will It Be a Crash, New All Time Highs, Something Else? Let’s Find Out!

By Graham Summers, MBA

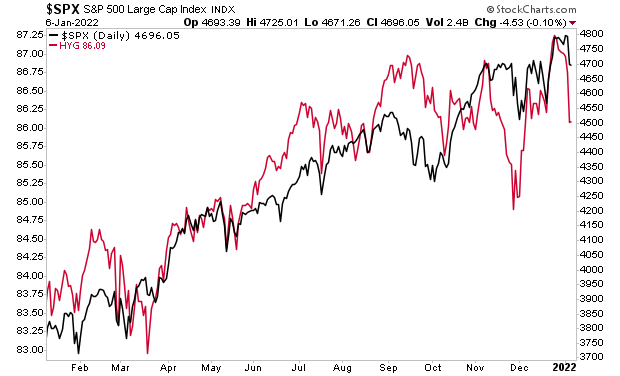
You’re no doubt confused by the market’s action of the last week. Are we about to see a waterfall crash… or are stocks about to explode higher to new highs? 

The answer is probably neither. 

Markets are tricky things. More often than not, their goal is to induce the maximum amount of suffering to the maximum number of investors.

So let’s dive in together and sort this out.

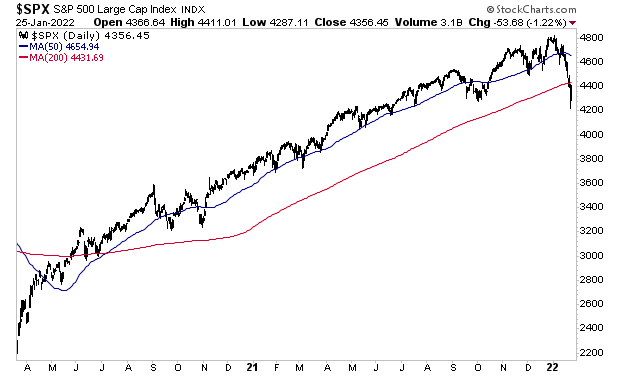
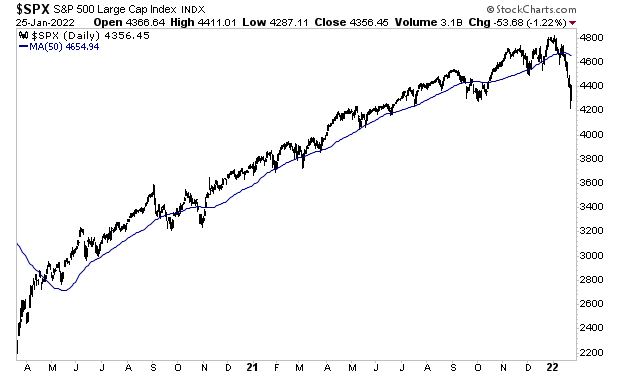
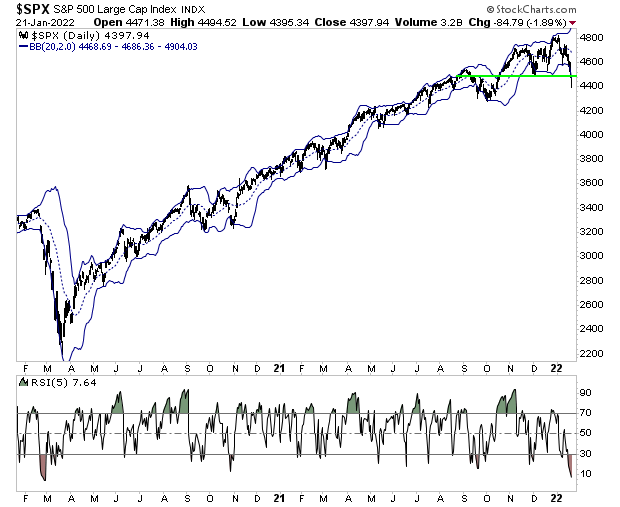
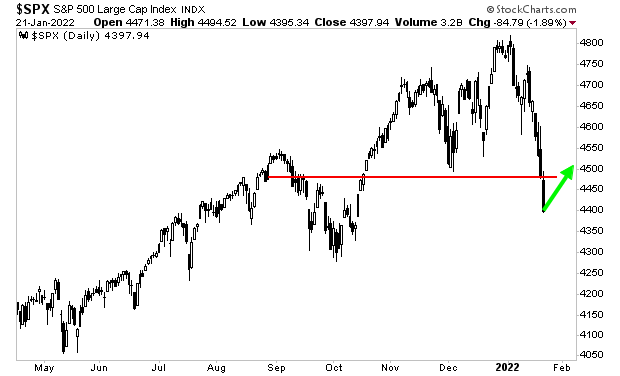
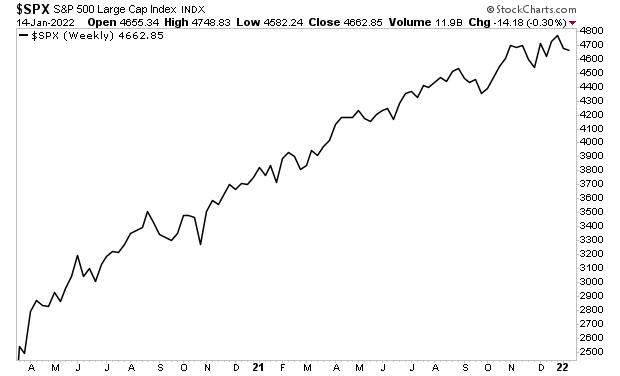
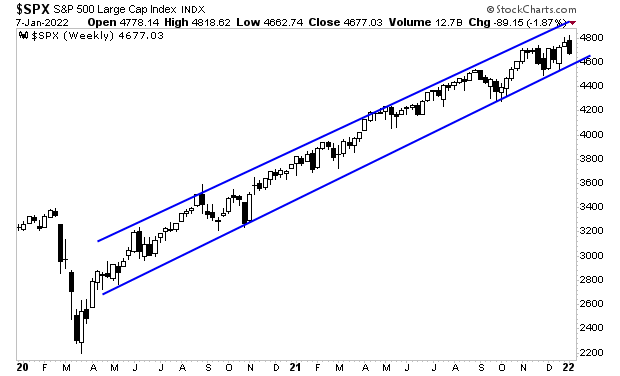
On a daily and weekly basis, the S&P 500 is now trending down. The market broke below its 200-day moving average (DMA) for the first time since the March 2020 lows. That’s a BIG deal and suggests a new bear market is here.

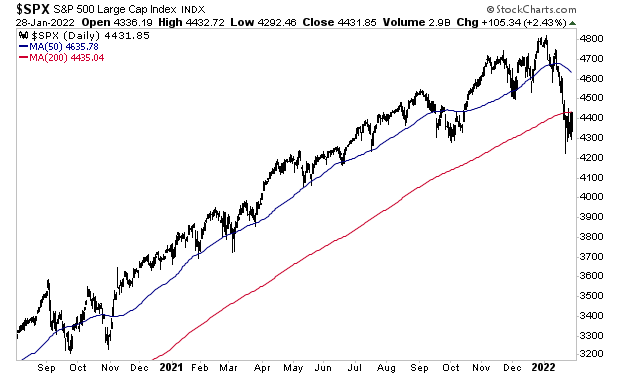
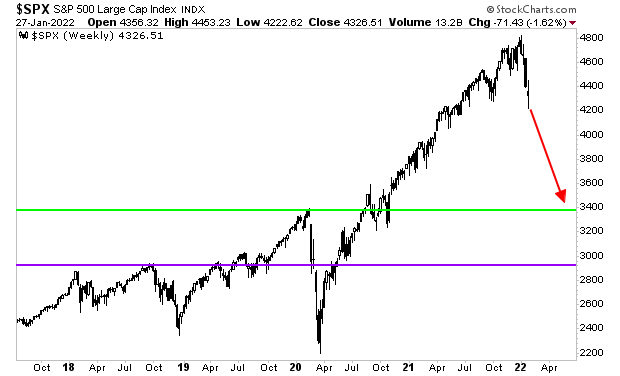
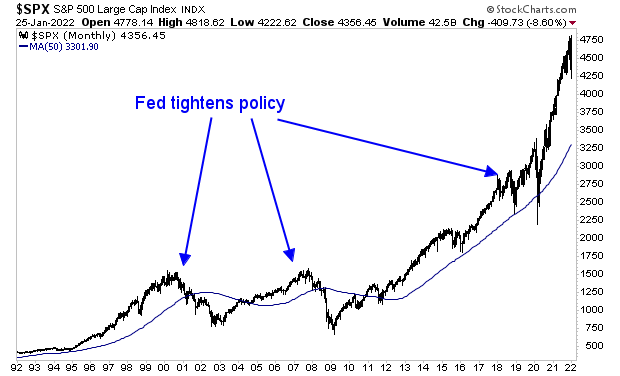
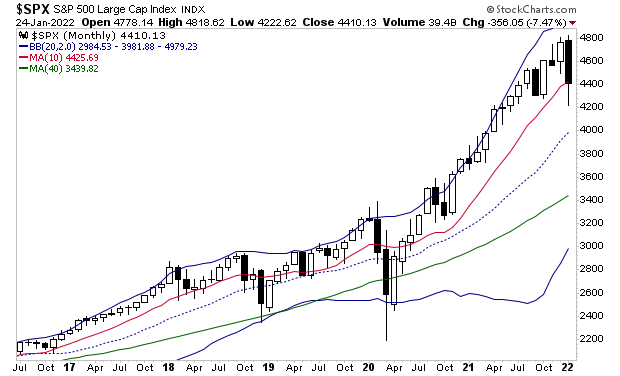
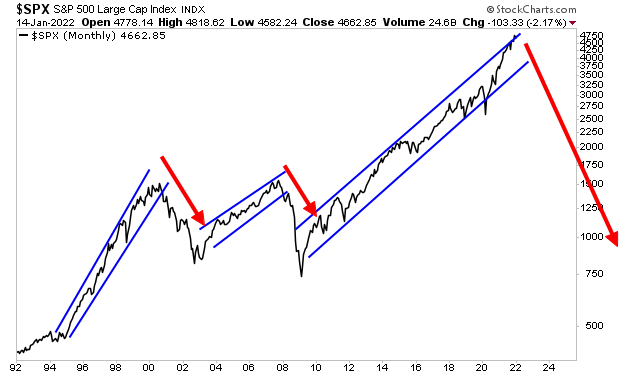
However, on a monthly basis, the S&P 500 can still end January above the all-important 10-monthly moving average (MMA)at 4,427. This is a BIG deal for the bulls because every time the market has broken that line in the last five years, a bear market has hit, with stocks losing 20%-30% of their value quite rapidly.

Where does this leave us?

Well we’re likely to see the bulls push to end January (today) with the market above 4,417. After that, I wouldn’t see surprised to see total chaos in the markets with prices whip-sawing this way and that… much as they did last week.

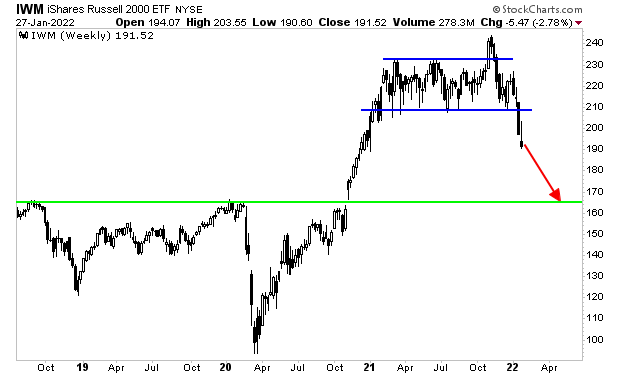
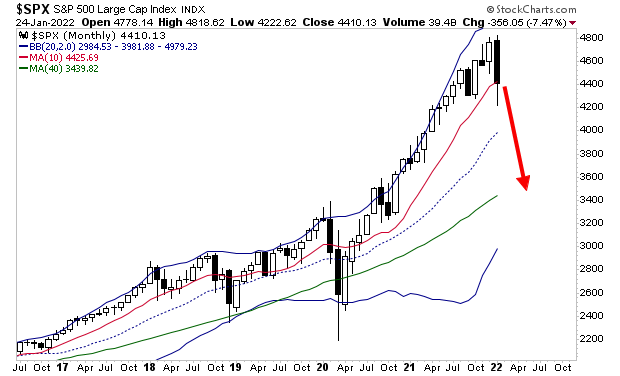
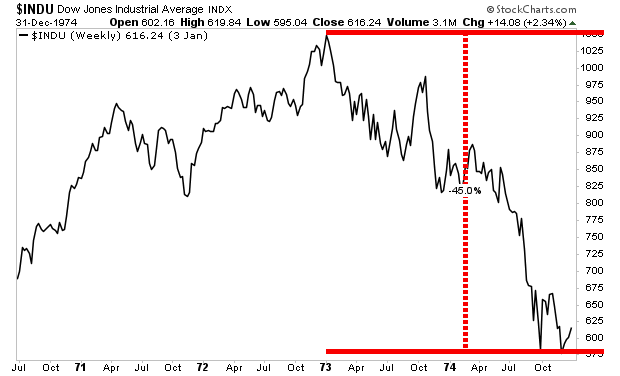
However, the trend is DOWN which opens the door to some nasty drops in the future. The average bear market is 9-10 months and sees stocks lose 30% of their value. However, in recent years the drops have happened much faster than that.

For those looking to prepare and profit from this mess, our Stock Market Crash Survival Guidecan show you how.

Within its 21 pages we outline which investments will perform best during a market meltdown as well as how to take out “Crash insurance” on your portfolio (these instruments returned TRIPLE digit gains during 2008).

To pick up your copy of this report, FREE, swing by:

https://phoenixcapitalmarketing.com/stockmarketcrash.html

Best Regards,

Posted by Phoenix Capital Research in stock collapse?

Warning: Stocks Are About to Start a Bear Market

Stocks have taken out critical support.

The Russell 2000 is perhaps the “junkiest” index among stock indexes with 31% of its companies NOT making profits. So, if the Fed is indeed looking to deflate the stock market bubble, this would be the first index to collapse.

Sure enough, it is collapsing. As I write this Friday morning, it has taken out critical support. By the look of things, we will be unwinding the entire stock market move of the last 24 months, returning to pre-COVID levels.

Chart, histogram

Description automatically generated

A similar price move in the S&P 500 sees it at 3,400, or possibly even lower. That’s a full 20% down from here.

Chart, histogram

Description automatically generated

For those looking to prepare and profit from this mess, our Stock Market Crash Survival Guidecan show you how.

Within its 21 pages we outline which investments will perform best during a market meltdown as well as how to take out “Crash insurance” on your portfolio (these instruments returned TRIPLE digit gains during 2008).

To pick up your copy of this report, FREE, swing by:

https://phoenixcapitalmarketing.com/stockmarketcrash.html

Best Regards,

Posted by Phoenix Capital Research in stock collapse?

Stocks Bounce… But is Another Bloodbath Around the Corner?

The bounce hit as I had expected, but I must be honest… things got pretty hairy there for a few hours on Monday.

The issue now is where do we go from here?

Stocks are still in deep trouble.

First and foremost, the S&P 500 remains below both its 50-day moving average (DMA) and its 200-DMA. Those lines now present major resistance to any upside move. Remember, this marks the FIRST time stocks have broken below these levels since the March 2020 Crash.

Secondly, the trend, as illustrated by the 50-day moving average (DMA), is now DOWN. This again marks the first time this has been the case since the March 2020 Crash. Yes, there have been periods in which the 50-DMA was flat or sideways, but DOWN? This is the first.

So, you can see the predicament here. Regardless of the bounce the trend is DOWN and it will take considerable time and strength to reverse this. Against this backdrop the Fed is now tightening. Sure, it might not be as much tightening as everyone fears, but it’s still tightening.

The three times the Fed tried this, stocks crashed.

Those occasions were:

  • The Tech Bubble of the late ‘90s.
  • The Housing Bubble of the mid ‘00s.
  • The attempted normalization of late 2017-2018.

What are the odds the Fed succeeds this time around… especially when you consider the size of this bubble relative to the others.

For those looking to prepare and profit from this mess, our Stock Market Crash Survival Guidecan show you how.

Within its 21 pages we outline which investments will perform best during a market meltdown as well as how to take out “Crash insurance” on your portfolio (these instruments returned TRIPLE digit gains during 2008).

To pick up your copy of this report, FREE, swing by:

https://phoenixcapitalmarketing.com/stockmarketcrash.html

Best Regards,

Posted by Phoenix Capital Research in It's a Bull Market

Stocks are on the ledge of a VERY large cliff.

Anytime the S&P 500 has taken out its 50-week moving average (WMA), it usually falls to the middle of its Bollinger Band, if not the 200-WMA. In chart terms below, anytime the S&P 500 takes out the red line, it drops to the blue dotted line if not the green line.

If stocks hold right here and now, then we have escaped a bear market by the skin of our teeth. If stocks DON’T hold right here and now, it’s a bear market and stocks will eventually drop another 10% if not 20%.

I’m talking about this:

Chart, histogram

Description automatically generated

What happens right now is key. If stocks hold these gains, then this recent drop was likely just a plain vanilla sell-off to take out the excess froth in the markets. 

However, if, instead of holding those gains, stocks roll over and begin falling again, then we are likely at the start of a more pronounced breakdown and possibly a new bear market.

For those looking to prepare and profit from this mess, our Stock Market Crash Survival Guidecan show you how.

Within its 21 pages we outline which investments will perform best during a market meltdown as well as how to take out “Crash insurance” on your portfolio (these instruments returned TRIPLE digit gains during 2008).

To pick up your copy of this report, FREE, swing by:

https://phoenixcapitalmarketing.com/stockmarketcrash.html

Best Regards,

Posted by Phoenix Capital Research in stock collapse?

My Roadmap For Where Stocks Go From Here (And How to Profit)

Stocks took it on the chin last week, slicing through critical support at 4,480 on the S&P 500. All told, this sell-off has erased six months’ worth of gains bringing stocks back to the levels of last August 2021.

Chart, histogram

Description automatically generated

The big question for investors this week is: where do we go from here?

First and foremost, the market is deeply oversold. The S&P 500 is well below the lower Bollinger Band on its daily chart. The market is also showing the lowest relative strength index (RSI) reading since the March 2020 crash. Yes, the market is as oversold as it was during the first wave of the global pandemic.

A picture containing graphical user interface

Description automatically generated

This suggests a bounce is coming. It is highly unlikely stocks go straight down from here. Instead, we are likely to get a rally into this week’s FOMC on Wednesday, with the S&P 500 revisiting former support, if not breaking a little above it. I’ve drawn this out on the chart below.

Chart, histogram

Description automatically generated

What happens there is key. If stocks hold those gains, then this recent drop was likely just a plain vanilla sell-off to take out the excess froth in the markets.

However, if, instead of holding those gains, stocks roll over and begin falling again, then we are likely at the start of a more pronounced breakdown and possibly a new bear market.

For those looking to prepare and profit from this mess, our Stock Market Crash Survival Guidecan show you how.

Within its 21 pages we outline which investments will perform best during a market meltdown as well as how to take out “Crash insurance” on your portfolio (these instruments returned TRIPLE digit gains during 2008).

To pick up your copy of this report, FREE, swing by:

https://phoenixcapitalmarketing.com/stockmarketcrash.html

Best Regards

Posted by Phoenix Capital Research in stock collapse?
Is the $USD Warning That Inflation is About to Become BAD News For Stocks?

Is the $USD Warning That Inflation is About to Become BAD News For Stocks?

By Graham Summers, MBA

Yesterday, I outlined how the markets are likely at a very critical point regarding inflation.

By quick way of review:

1)    Stocks initially love inflation because it boosts results (companies don’t report inflation-adjusted returns, so any increase in product pricing due to inflation is instead reflected as “growth”).

2)    This love relationship eventually turns to hatred as inflation leads to higher operating costs, which squeeze profit margins.

In yesterday’s article, I illustrated how this played out during the last major bout of inflation in the 1970s. 

At that time, stocks initially roared higher as inflation initially boosted corporate results. However, by the time 1974 rolled around and inflation (as measured by the consumer price index or CPI) hit 11%, stocks began to crash, eventually losing ~50%.

I mention all of this because it is highly likely that something similar is about to manifest in the markets today.

Stocks have erupted higher on the back of inflation, courtesy of $11 trillion in Fed QE/ fiscal stimulus from the Federal Government between March 2020 and today.

However, inflation is now taking a turn for the worse. And, as usual, the signs are showing up in the currency markets first.

The Fed is in the process of ending its QE program. Fed officials have also signaled that they intend to raise rates three or four times this year. All of this should be highly U.S. dollar positive.

And yet… the $USD is breaking down.

The greenback has taken out key support (green line in the chart below). Even worse, it’s also broken its bull market trendline (blue line in the chart below).

Chart, histogram

Description automatically generated

This is a MAJOR signal that the Fed’s actions are not enough. Put another way, the Fed is behind the curve on inflation! This is extremely negative for stocks as it means inflation is getting out of control (just like in 1974).

So, what would a similar, 1970s-style crisis look like today? The market is warning us, though few have noticed.

For those looking to prepare and profit from this mess, our Stock Market Crash Survival Guidecan show you how.

Within its 21 pages we outline which investments will perform best during a market meltdown as well as how to take out “Crash insurance” on your portfolio (these instruments returned TRIPLE digit gains during 2008).

To pick up your copy of this report, FREE, swing by:

https://phoenixcapitalmarketing.com/stockmarketcrash.html

Best Regards

Posted by Phoenix Capital Research in Inflation, stock collapse?
Are Stocks At a Major Turning Point When It Comes to Inflation?

Are Stocks At a Major Turning Point When It Comes to Inflation?

By Graham Summers, MBA

We’ve now reached the point at which inflation will become a major problem.

Inflation is not inherently bad for stocks. The reason for this is that companies report growth in nominal terms, not in “real” or inflation-based terms.

Think of it this way: XYZ company sells widgets for $1.00. Then inflation hits and the company raises widget prices to $1.10. Even if the company sells the EXACT same number of widgets, revenues “grow” by 10%. After all, they don’t have to report that the 10% in growth was 100% due to inflation!

This is why stocks often spike higher when inflation initially hits. We saw this during the last major bout of inflation in the early 1970s. At that time, stocks roared higher, rising 50% while CPI, which measures inflation, gradually rose to 6.3%.

However, the relationship between stocks and inflation quickly goes from love to hate once costs rise fast enough that profit margins are squeezed. To return to the 1970s, this started in 1973 as CPI hit 11%. From that point onward, stocks crashed losing almost 50%.

I bring all of this up because we are likely about to witness something similar today. Stocks have erupted higher on the back of inflation, courtesy of $11 trillion in Fed QE/ fiscal stimulus from the Federal Government between March 2020 and today.

This is the good part of inflation. And by the look of things, it’s about to go sour. Indeed, we are getting clear signs that costs are about to explode higher for corporations. 

Profit margins are at all-time highs (there’s nowhere to go but down), while real wages (incomes adjusted for inflation) are DEEPLY negative.

Workers are now demanding higher wages. This means higher operating costs for corporations, which in turns means lower profit margins.

In simple terms, the clock is ticking for stocks. Sure, they might not crash this week, but another bloodbath is coming. The markets will soon be a sea of red. And the losses will be staggering.

The markets are warning us, but few have noticed.

The coming bust is going to be life-changing for many people. Most will lose much if not everything. But a small number of investors will generate LITERAL FORTUNES.

For those looking to prepare and profit from this mess, our Stock Market Crash Survival Guidecan show you how.

Within its 21 pages we outline which investments will perform best during a market meltdown as well as how to take out “Crash insurance” on your portfolio (these instruments returned TRIPLE digit gains during 2008).

To pick up your copy of this report, FREE, swing by:

https://phoenixcapitalmarketing.com/stockmarketcrash.html

Best Regards,

Posted by Phoenix Capital Research in Inflation
The Fed Just “Rang the Bell”… Are You Ready For What’s Coming?

The Fed Just “Rang the Bell”… Are You Ready For What’s Coming?

By Graham Summers, MBA

The Fed just “rang the bell.”

One of the oldest adages in investing is that “they don’t ring a bell at the top.”

This is quite misleading.

While it’s true it’s impossible to predict the exact day of a market top, what is totally false is that there are not clear signals that a top is being made.

The clearest one of all, is the Fed aggressively tightening monetary policy. Indeed, the last two major bear markets (2000-2003 and 2007-2009) were both triggered by the Fed.

Why?

Because the markets move in similar cycles. And for over 20 years, the most important cycle has been the following:

1) The Fed ignores clear and obvious signs of a bubble for far too long.

2) The Fed is finally forced to act to attempt to deflate the bubble waaaaay past the point at which a soft landing is possible.

3) The bubble bursts in spectacular fashion triggering a crisis.

This was the case in 2000, 2007, 2018, and it’s the case today.

Yesterday Fed Chair Jerome Powell confirmed this with the following statement made to the U.S. Senate.

“If we see inflation persisting at higher levels, longer than expected, if we have to raise interest rates more over time, then we will.”

This is coming from the same Fed Chair who told the markets for the last year that inflation was “transitory” and didn’t require the Fed to act.

So what changed?

Inflation is now a politically toxic issue for voters. 2022 is an election year. And a CNN poll from December shows that the the #1 issue for voters is higher prices.

In this context, the Fed is receiving tremendous pressure from the Biden administration to stop inflation NOW. We know this because Fed Chair Jerome Powell only changed his tune on inflation AFTER he was nominated for a second term by President Biden.

That’s the bell.

Both the White House and the Fed want inflation killed. This means the Fed must now act aggressively to try to stop it by hiking rates faster and more frequently than most investors believe.

Given the Fed’s success with deflating the last two bubbles (both instances lead to crises), what are the odds it is able to succeed this time without a crash?

Put another way… what are the odds this time it’s any different?

For those looking to prepare and profit from this mess, our Stock Market Crash Survival Guidecan show you how.

Within its 21 pages we outline which investments will perform best during a market meltdown as well as how to take out “Crash insurance” on your portfolio (these instruments returned TRIPLE digit gains during 2008).

To pick up your copy of this report, FREE, swing by:

https://phoenixcapitalmarketing.com/stockmarketcrash.html

Best Regards,

Posted by Phoenix Capital Research in stock collapse?

What Does the Market Look Like Without Fed Interventions?

By Graham Summers, MBA

The markets are about to lose their “training wheels.”

And by the look of things, it won’t be pretty.

On March 23, 2020, during the depths of the market crash triggered by the economic shutdowns, the Fed moved to backstop everything.

And I do mean EVERYTHING.

The Fed On Monday March 23nd, 2020, the Fed staged an Emergency Meeting during which it announced that it would be expanding its $700 billion QE program to “unlimited”… meaning it would print as much money as was needed.

It also announced that it would be using this unlimited QE to fund various credit facilities that would buy: 

·      Mortgage-Backed Securities (MBS)

·      U.S. Treasuries

·      Corporate debt or debt issued by corporations.

·      Corporate debt-related ETFs (stock funds linked to corporate debt).

·      Municipal debt (debt issued by states, counties, and cities).

·      Certificates of Deposit (CDs)

·      Student Loans

·      Auto Loans 

Since that time, stocks have ripped higher in a near straight line… 

Diagram

Description automatically generated with low confidence

The Fed, nearly two years later, finally decided to its time to end the interventions. Within eight weeks its current QE program will be over. And the Fed intends to start raising rates soon after.

So, what will the market look like once the Fed stops its nearly weekly interventions?

High yield credit is already offering a preview. The Fed stopped intervening in this market weeks ago.

Chart, line chart

Description automatically generated

The signs are clear… another bloodbath is just around the corner.

For those looking to prepare and profit from this mess, our Stock Market Crash Survival Guidecan show you how.

Within its 21 pages we outline which investments will perform best during a market meltdown as well as how to take out “Crash insurance” on your portfolio (these instruments returned TRIPLE digit gains during 2008).

To pick up your copy of this report, FREE, swing by:

https://phoenixcapitalmarketing.com/stockmarketcrash.html

Best Regards,

Posted by Phoenix Capital Research in stock collapse?

Three Charts That Warn Another Bloodbath is Just Around the Corner!

The technical damage of the last week has been severe.

The S&P 500 broke below critical support at 4,705 with heavy selling this week. That’s bad news.  Even worse, the market has failed to reclaim that level during yesterday’s bounce.

This means that what used to be support is now resistance. The fact the bulls couldn’t reclaim this level means we are going lower.

How much lower?

Breadth is telling us to expect 4,600.

Chart, line chart, histogram

Description automatically generated

High yield credit says it will be even lower at 4,500.

Chart, line chart

Description automatically generated

The signs are clear… another bloodbath is just around the corner.

For those looking to prepare and profit from this mess, our Stock Market Crash Survival Guidecan show you how.

Within its 21 pages we outline which investments will perform best during a market meltdown as well as how to take out “Crash insurance” on your portfolio (these instruments returned TRIPLE digit gains during 2008).

To pick up your copy of this report, FREE, swing by:

https://phoenixcapitalmarketing.com/stockmarketcrash.html

Best Regards

Posted by Phoenix Capital Research in stock collapse?