Over the last few days, I’ve illustrated how several major indicators are flashing “RECESSION!”
By quick way of review:
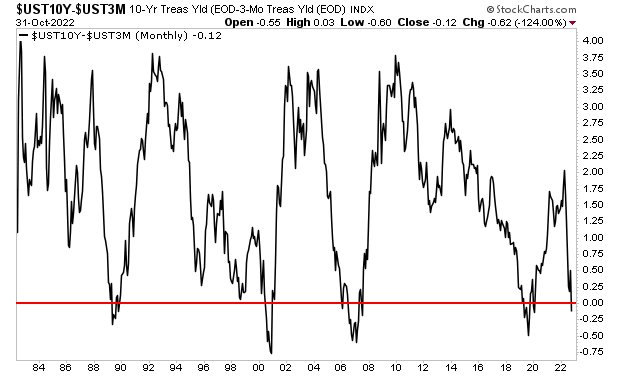
The 10y-3m yield curve has predicted every recession in the last 50 years. It’s telling us that a new severe recession is just around the corner.
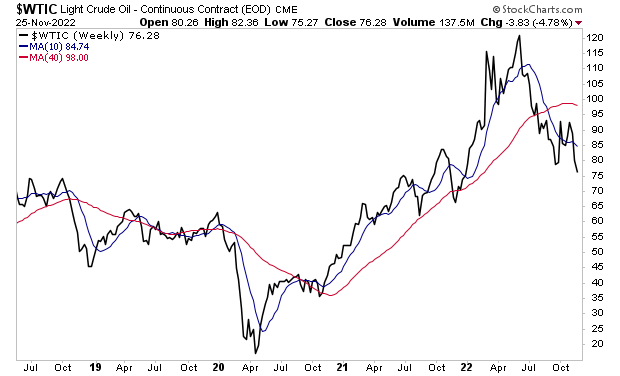
Oil has collapsed from $130 per barrel to ~$75 per barrel, indicating demand destruction is underway.
All of this is BAD news for stocks.
Why?
During the typical recession Earnings Per Share (EPS) decline by 25%.
Based on what bonds are doing, stocks are priced between 16 and 18 times forward EPS. Wall Street is currently forecasting EPS growth of 5% next year to $230.
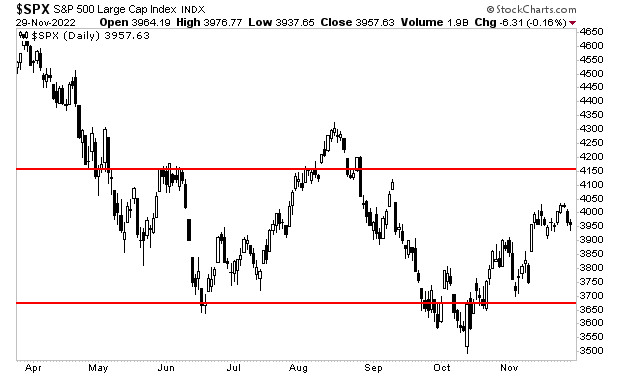
$230 X 16 (or 18)= 3,680 to 4,410.
Incidentally, that is the trading range that stocks have been in for most of the last six months.
By Graham Summers, MBA
Over the last few days, I’ve illustrated how several major indicators are flashing “RECESSION!”
By quick way of review:
The 10y-3m yield curve has predicted every recession in the last 50 years. It’s telling us that a new, severe recession is just around the corner.
Oil has collapsed from $130 per barrel to ~$75 per barrel, indicating demand destruction is underway. This only happens during a recession.
All of these data points are BAD news for stocks.
Why?
During the typical recession Earnings Per Share (EPS) decline by 25%.
Based on what bonds are doing, stocks are priced between 16 and 18 times forward EPS. And Wall Street is currently forecasting EPS growth of 5% next year to $230.
$230 X 16 (or 18)= 3,680 to 4,410.
Incidentally, that is the trading range that stocks have been in for most of the last six months.
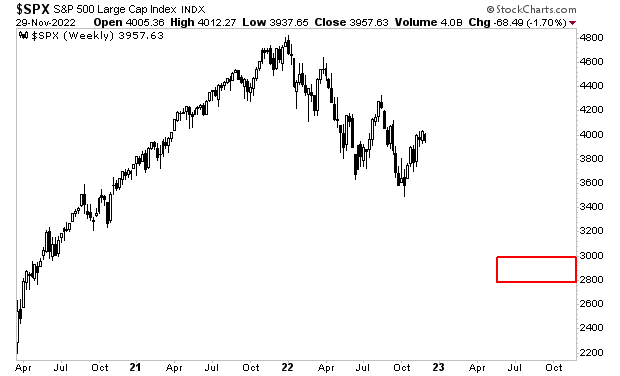
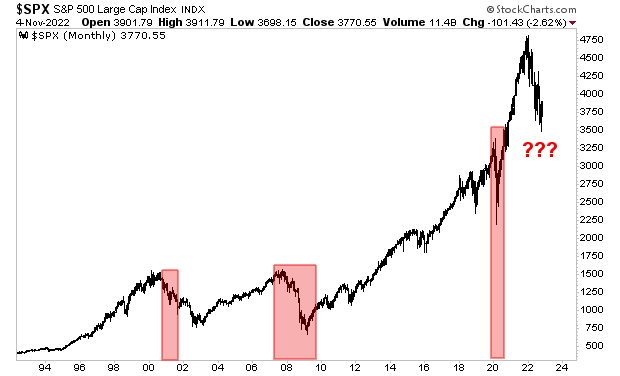
However, a recession would mean that EPS for 2023 is closer to $172.
$172 X 16 (or 18)= 2,752 to 3,096
That’s the red box in the chart below.
Put simply, a recession will erase trillions of dollars in wealth…and Wall Street is once again asleep at the wheel, driving its clients off a cliff.
You don’t need to be one of them!
If you’ve yet to take
steps to prepare for this, we just published a new exclusive special
report How to Invest During This Bear Market.
It details the #1
investment to own during the bear market as well as how to invest to potentially
generate life changing wealth when
it ends.
As I noted yesterday, the bond market is telling us that a recession is just around the corner.
By quick way of review, the U.S. treasury market is comprised of 12 bonds, with durations ranging from four weeks to 30 years.
When you plot the yield on all of these bonds, you get the “yield curve.” And the difference in yield between the 10-Year U.S. Treasury and the 3-month U.S. Treasury is one of the best predictors of recessions in the world.
Put simply, anytime this difference becomes negative (meaning the 3-month yield is actually higher than the 10-year yield) this indicates a recession is about to hit.
It happened in 1989, 2001, 2007, and 2019 and today.
This alone is bad news, but we get additional confirmation of a recession from oil.
As you know, oil is extremely closely linked to economic growth. And oil is collapsing, having fallen from $120+ per barrel to the mid-$70s per barrel.
There is only one reason for oil to fall like this during a period of high inflation: demand destruction.
Demand destruction is when the economy rolls over and there is less demand for oil. It only happens during recessions.
And what do you think a recession will do to stocks?
It’s called a crash.
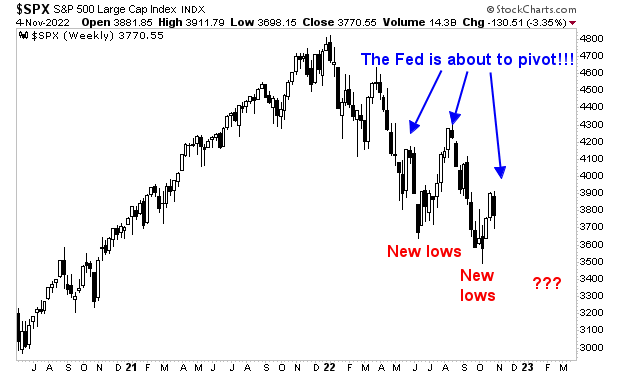
This is going to
force stocks to new lows. I’ll explain why in Friday’s article. Until then…
know this: it is highly likely that a recession is going to trigger a major
crash in stocks. It’s not a question of “if,” it’s a question of “when.”
If you’ve yet to take
steps to prepare for this, we just published a new exclusive special
report How to Invest During This Bear Market.
It details the #1
investment to own during the bear market as well as how to invest to potentially
generate life changing wealth when
it ends.
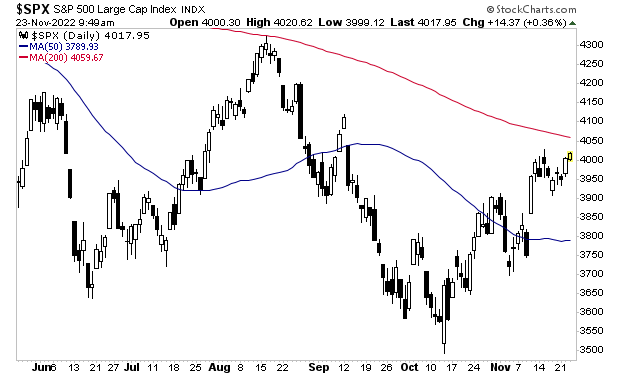
The stock market is closed tomorrow for Thanksgiving. It will also close early on Friday November 25th at 1PM. As one can imagine, most of Wall Street has already left for the holidays.
This means that trading volume will be extremely light. And that means that those few traders/funds who are active will have an easier time moving the market.
As I write this, the S&P 500 is within spitting distance of its 200-day moving average. There’s little doubt in my mind that stocks will make a run for that line sometime over the holiday.
However, that is a short-term issue. The longer-term issue is that the Treasury market is telling us a severe recession is coming.
The Treasury is comprised of numerous bonds with different maturation periods. They are:
Treasury Bill Maturation Periods:
4 Weeks
13 Weeks
26 Weeks
52 Weeks
Treasury Note Maturation Periods
2 Years
3 Years
5 Years
7 Years
10 Years
Treasury Bond Maturation Periods
20 Years
30 Years
When you plot the yield on all of these bonds, you get the “yield curve.” And the difference in yield between various bonds on this curve is one of the most accurate predictors of recession.
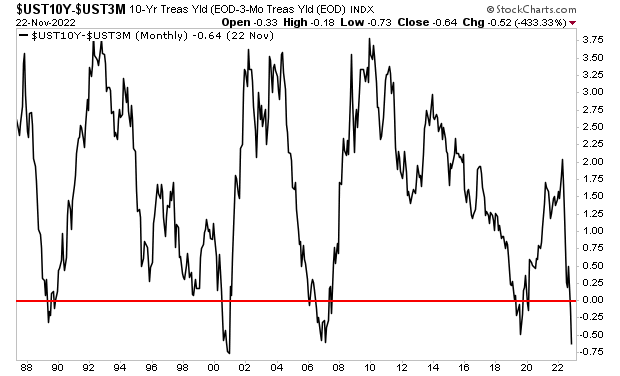
Specifically, the difference between the yield on the 10-Year U.S. Treasury and the yield on the 3-month U.S. Treasury. Anytime this difference becomes negative (meaning the 3-month yield is actually higher than the 10-year yield) this indicates a recession is about to hit.
I’ve illustrated this in the chart below. Anytime the black line falls below the red line, the 10-year 3-month yield curve is “inverted.” This was the case in 1989, 2001, 2007, and 2019: all of those preceded recessions.
It is happening again now. And as you can see, this metric is MORE negative today than it was before the COVID-19 crash as well as the Great Financial Crisis.
Put simply, the yield curve of the Treasury market is predicting a severe recession in the near future, likely the start of 2023.
This is going to force stocks to new lows. I’ll explain why in Friday’s article. Until then… know this: it is highly likely that a recession is going to trigger a major crash in stocks. It’s not a question of “if,” it’s a question of “when.”
If you’ve yet to take
steps to prepare for this, we just published a new exclusive special
report How to Invest During This Bear Market.
It details the #1
investment to own during the bear market as well as how to invest to potentially
generate life changing wealth when
it ends.
Ever since inflation entered the financial system is early 2021, there has been a debate as to when the higher cost of living would hit consumer spending to the point of inducing a recession.
Sure, consumers can rely on savings or credit to make ends meet in the near-term. However, if inflation remains elevated for a prolonged period, eventually it becomes too much to bear, and the consumer is forced to “tap out” and cut discretionary expenses. That’s when a recession hits.
I mention all of this because the stock market is telling us that the recession has arrived.
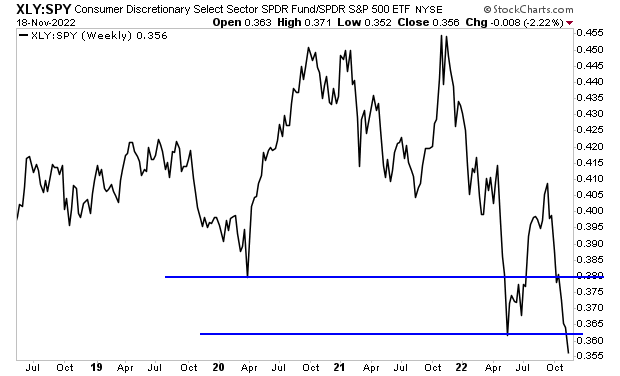
One of the best means of analyzing intra-market developments is ratio work. This consists of comparing the performance of one asset or stock relative to the performance of another.
For example, let’s look at the ratio between the Consumer Discretionary ETF (XLY) and the S&P 500 (SPY). During periods of consumer spending strength, this line rises. And during periods of consumer spending weakness this line falls.
Below is a chart of the ratio over the last four years. As you can see, this ratio is dropping like a stone. It is actually lower today than it was at the lows of the March 2020 Crash!
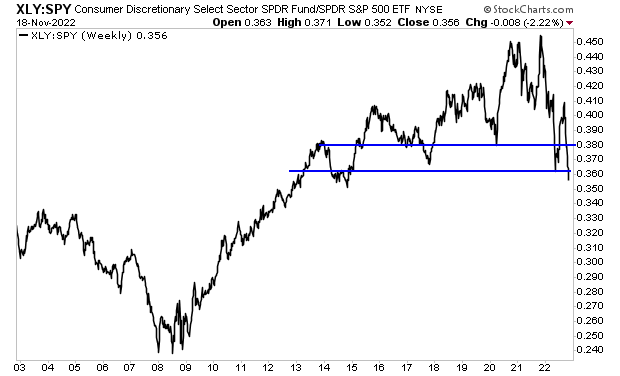
This suggests the consumer is “tapping out” right here and now. The question now is if this is just a slight downturn or the start of a major recession. To answer that, let’s step back and look at a longer-term chart.
From an economics perspective, this is the most disturbing thing I’ve seen in years. It suggests the U.S. is entering its first major recession since the Great Financial Crisis of 2007-2009.
I think we all remember what happened to stocks during that time: an extraordinary crash in which stocks lost over 50% of their value.
A crash is coming. And it’s going to make 2008 look like a joke.
If you’ve yet to take steps to prepare for this, we just published a new exclusive special report How to Invest During This Bear Market.
It details the #1 investment to own during the bear market as well as how to invest to potentially generate life changing wealth when it ends.
Last week, I warned you not to trust the positive economic data being put out concerning the U.S. economy.
The reasons for my warning were simple: the data was bunk, made up, and of no real value.
By quick review, ALL of the jobs that were supposedly created in October 2022 were not real jobs; they were created in a government spreadsheet via various accounting gimmicks… not in the economy. And yes, I’m talking about all 261,000 of them.
The inflation data that everyone was so excited about last week was also NOT positive.
Month over Month inflation was 0% in July, 0.1% in August, and 0.4% in September. With that in mind, I ask… “how was a month over month reading of 0.4% in October a great thing? Technically the inflation data was BETTER during the summer!!!”
Moreover, the items that DECLINED in price… allowing the beancounters to make inflation look better than it is, were used cars and trucks, medical care, apparel, and airline fare.
By way of contrast, shelter, gas and food prices all increased.
Again… how is any of that good for the economy?
I realize it might be difficult to believe me here. After all, 99% of mainstream economists and financial media talking heads are saying the exact opposite: the economy is doing fine and inflation is coming down.
So, with that in mind, I ask you to take a look at the following data points. What do they tell you about the TRUE status of the U.S. economy?
· Juul lays off ~1/3rd of its workforce.
· Redfin lays off 13% of its staff.
· Meta to fire 13% of its workforce.
· Twitter lays off ~50% of its workforce.
· Snap lays off 20% of its employees.
· Wayfair: lays off 10% of its corporate team.
· Microsoft fires 1,000 workers.
· Disney to begin layoffs, targeted hiring freeze.
· Re/Max to fire 17% of its workforce.
· Compass to layoff 10% of its workforce.
Let’s be blunt here… corporations implement major layoffs like this during only one kind of economic environment: a recession.
And what impact do you think a recession is going to have on the stock market?
I’ll detail in tomorrow’s article. For now, the key item to note is that the Everything Bubble has burst.
On that note, we are putting together an Executive Summary outlining how to invest in this new bearish environment.
It will be available exclusively to our clients. If you’d like to have a copy delivered to your inbox when it’s completed, you can join the wait-list here.
Yesterday I illustrated that the Fed has NOT pivoted and won’t be for months. Anyone who says otherwise isn’t listening to what the Fed is actually saying!
Reviewing the Fed’s public statements since March 2022 (the month it began tightening monetary conditions), nowhere is there any hint or mention of a Fed pivot.
If anything, even formerly dovish Fed officials like Neel Kashkari (President of the Federal Reserve Bank of Minneapolis) or John Williams (President of the Federal Reserve Bank of New York) reveals that they are all inflationary hawks!
However, this hasn’t stopped the shills in the media from pushing the narrative that the Fed is about to pivot. And has been the case multiple times this year, investors have fallen for this narrative, piling into stocks.
The latest Fed pivot-induced rally began in mid-October. It went into hyperdrive on October 21, when Nick Timiraos, a Wall Street Journal reporter who is believed to be a Fed conduit in the media, published an article titled, Fed Set to Raise Rates by 0.75 Point and Debate Size of Future Hikes.
At the time, the Fed was in a “blackout” period in which Fed officials couldn’t make public appearances to dissuade the investing public from interpreting this article as suggesting a Fed “pause” and possibly even a “pivot” in monetary policy were at hand.
This presented under performing fund managers with a golden opportunity.
Many funds (both mutual and hedge) have performed TERRIBLY this year. With numerous large financial institutions’ fiscal years ending October 31 (Fidelity, Vanguard, etc.) and November 15th serving as the date by which large investors need to alert hedge funds of their intentions to withdraw money, fund managers were under TREMENDOUS pressure to game performance going into month-end and mid-November.
In this context, the Timiraos article published on October 21, 2022, was the perfect excuse to ramp stocks higher based on the ignorant and deceptive notion that the Fed was about to pivot.
THAT is why stocks have been rallying.
Not because the macro situation has improved (it hasn’t) Not because the Fed or Fed officials have hinted at a pivot (they haven’t). Not because the inflation data is improving (it isn’t). But because fund managers were desperate for any excuse to push stocks higher, and a supposed Fed conduit in the financial media gave them that excuse.
Full stop.
So where do we go from here?
I’ll detail that in tomorrow’s article. For now, the key item to note is that the Everything Bubble has burst.
On that note, we are putting together an Executive Summary outlining how to invest in this new bearish environment.
It will be available exclusively to our clients. If you’d like to have a copy delivered to your inbox when it’s completed, you can join the wait-list here.
Ever since the Fed began tightening monetary policy in March of 2022, numerous pundits, social media personalities, and financial media types have been pushing the notion that the Fed will “pivot” or stop tightening monetary policy soon which will ignite a new bull market in stocks.
This narrative is both ignorant and deceptive.
It is ignorant in that history has shown us that stocks usually don’t bottom for another 14 months once the Fed starts easing monetary conditions following a cycle of tightening. This was the case during the Tech Crash and the Housing Crash.
I’ve received questions from several of you as to why this was not the case during the COVID-19 crash. In that particular instance the market was imploding due to an exogenous issue (the pandemic) triggering an economic shutdown, as opposed an organic bear market triggered by Fed tightening.
Moreover, during COVID-19, the Fed effectively backstopped the entire financial system, spending over $3 trillion buying municipal bonds, corporate bonds, corporate bond ETFs, student loans, auto loans, and more in the span of three months. Were the Fed to abandon its current monetary tightening and begin easing financial conditions, it would NOT implement similar schemes; rather it would likely simply cut rates.
So again, history is very clear here: barring an exogenous issue (another pandemic, nuclear war, etc.) if the Fed were to abandon its tightening and begin easing conditions, stocks would continue to fall and likely not bottom for another year.
However, the “Fed is about to pivot” narrative is not only ignorant… it is also deceptive in that there is practically ZERO evidence that the Fed has even begun considering it.
Looking over the statements made by Fed officials since March 2022, I’m struck by the fact that even the most formerly dovish Fed officials have become inflationary hawks.
Neel Kashkari is the President of the Federal Reserve Bank of Minneapolis. Prior to the Fed’s current monetary tightening it is quite difficult to find any instances in which he wasn’t a fan of money printing/ QE/ maintaining easy monetary conditions.
However, since the Fed embarked on its crusade to end inflation, Mr. Kashkari has been extremely hawkish. Some notable headlines from the last six months…
Fed’s Kashkari: We may have to push long-term real rates into restrictive territory.
~May 2022
Fed’s Kashkari says officials are ‘a long way’ from backing off inflation fight.
~July 2022
Kashkari stakes out the most aggressive stance on lifting interest rates
~August 2022.
Kashkari Says Bar for Fed Policy Pivot on Rates Is ‘Very High’
~October 2022.
Again, this is Neel Kashkari, the man who was arguing that the Fed shouldn’t “overreact” to “temporary inflation” throughout 2021. And now he is adamant that the Fed needs to be aggressive in raising rates to end inflation. Nowhere do you see him even hinting at the Fed pausing rate hikes let alone easing.
Another example of a formerly dovish Fed official turning inflation hawk is John Williams.
Mr. Williams is the current President of the Federal Reserve Bank of New York: the branch of the Fed responsible for market operations. In September of 2021, when inflation cleared 5% for the first time in 13 years, Mr. Williams commented that it might be “appropriate” for the Fed to ends its emergency level Quantitative Easing Program sometime in “mid-2022.”
Yes, he wanted the Fed to run QE for another eight months despite inflation clearing 5%. This was insanely dovish and negligent.
Fast forward to the middle 0f 2022, and Mr. Williams is making the following statements:
NY Fed president urges big interest-rate hike but believes ‘economy is strong’
~June 2022.
Fed’s Williams pushes back on market expectations of a rate cut next year.
~August 2022.
Fed’s Williams says more rate hikes needed to bring down inflation
~ September 2022.
My point with the above examples is anyone who pushes the narrative that the Fed will soon pivot isn’t actually paying attention to what the Fed (and Fed officials) are saying. In this sense, the people who keep finding excuses to push this narrative are being highly deceptive.
But that hasn’t stopped them from trying…leading investors to the slaughter time and again!
I’ll detail what’s really driving stocks higher in tomorrow’s article.
A crash is coming. And it’s going to make 2008 look like a joke. I coined the term the “Everything Bubble” in 2014. I warned about it for the better part of 10 years.
And it has officially burst.
On that note, we are putting together an Executive Summary outlining how to invest now that the Everything Bubble has burst.
It will be available exclusively to our clients. If you’d like to have a copy delivered to your inbox when it’s completed, you can join the wait-list here.
Once again, the bean counters at the Bureau of Labor Statistics (BLS) made the economy look better than reality.
According to the BLS, the economy added 261,000 jobs in October. This was significantly higher than the 200,000 that was expected. The investing world was ecstatic to see this and bought stocks hand over fist on Friday.
The only problem with this is that none of those “jobs” were real.
As Bill King notes in the King Report, the BLS tweaked its seasonal adjustments in 2022 to boost the NFP numbers.
In 2021, for the month of October, the BLS reduced the total number of jobs in America from 149.31 million jobs down to 148.005 million jobs, an adjustment of -1.305 million.
For some reason, this year (2022) the BLS only adjusted the total number of jobs by -1.061 million.
That’s a difference of +244,000 from the 2021 adjustment.
So, right off the bat, 244,000 of the 261,000 jobs the economy “created” in October of 2022 were imaginary, created via a seasonal adjustment in a spreadsheet by the BLS.
For those of you keeping track this means that over 93% of the jobs created in October 2022 were fake or made up.
Actually, in reality, things were even worse than this.
Another gimmick the BLS used was to create “jobs” was its Birth-Death Model.
You see, in the real world, jobs are not created consistently throughout the year. Some months see a lot of jobs created and others don’t, depending on how many businesses are created or go bust in a given month.
The BLS tries to “smooth” over this by using a Birth-Death Model. It too, is a gimmick, nothing more. And for some reason, this gimmick boosted the number of jobs crated in October 2022.
In 2021, the Birth-Death model added 363,000 jobs in October. In 2022, this same model added 455,000 jobs. That’s a difference of 92,000 jobs.
So, there’s another 92,000 FAKE jobs created in a spreadsheet instead of in the economy.
And people were BUYING stocks based on this?!?!
The reality is that stripped of gimmicks, the economy LOST more jobs than it created in October. This only adds to the evidence that the U.S. economy is in fact in recession.
And what happens to stocks during recessions?
A crash is coming. And it’s going to make 2008 look like a joke. I coined the term the “Everything Bubble” in 2014. I warned about it for the better part of 10 years.
And it has officially burst.
On that note, we are putting together an Executive Summary outlining how to invest now that the Everything Bubble has burst.
It will be available exclusively to our clients. If you’d like to have a copy delivered to your inbox when it’s completed, you can join the wait-list here.
The financial system is currently experiencing a “relief rally.”
For the eight weeks ending October 28th, the primary problems facing the financial system were:
1) The collapse of the British Pound/ UK Government Bonds
2) The collapse of the Japanese Yen.
3) The collapse of U.S. Treasuries.
All of those have been resolved temporarily, courtesy of the Truss Government resigning in the U.K., the Bank of Japan making its largest intervention ever in the currency markets, and U.S. Treasuries catching a bid, courtesy of Treasury Secretary Janet Yellen verbally intervening to help the Biden Administration with the mid-term elections.
All of these solutions are temporary however.
The fact is that the U.S. is in an inflationary recession. I know it. You know it. Policymakers know it, though they have to lie to prop up the bogus narrative that everything is under control.
It’s not.
The financial system has already erased more wealth in 2022, than it did in 2020 or 2008. During those prior crises, bonds rallied providing a hedge against the collapse in stocks.
Not this time.
Bonds AND stocks are both collapsing, erasing over $18 trillion in wealth. And bear in mind, that’s NOT counting the loss of capital in housing or other asset classes.
And unfortunately for the bulls, we are nowhere near the bottom for either stocks or bonds.
Stanley Druckenmiller is arguably the greatest investor alive today. He averaged 30% a year for 30 years straight. And he notes that historically, whenever inflation gets over 5%, inflation never comes down until the Fed raises rates ABOVE CPI.
Currently, rates are 3.0-3.25%.
CPI is over 8%.
We have a looooong ways to go here. And there is plenty of historical data to back that up.
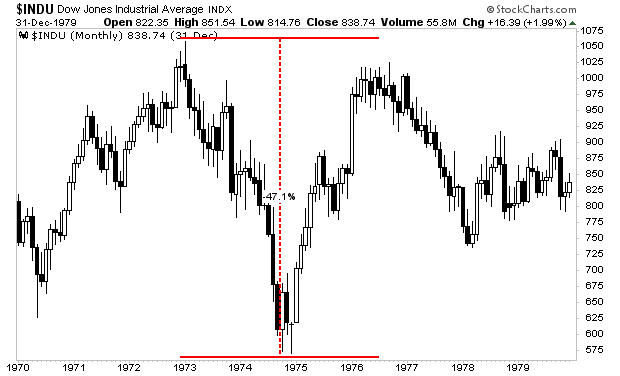
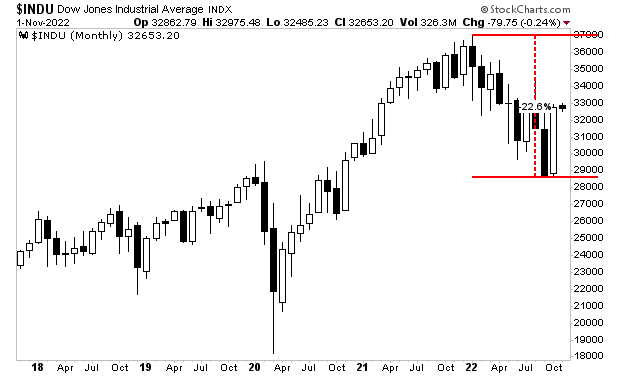
During the last stagflationary crisis in the 1970s, stocks lost 50% of their value before bottoming.
Thus far, in 2022, stocks have only lost 22%. If we are LUCKY, we are half way through this bear market.
Who would you rather bet on being correct… an investment legend like Druckenmiller, who has one of the greatest track records in history… or the Fed or some other establishment shill whose job it is to claim everything is great?
A crash is coming. And it’s going to make 2008 look like a joke. I coined the term the “Everything Bubble” in 2014. I warned about it for the better part of 10 years.
And it has officially burst.
On that note, we are putting together an Executive Summary outlining how to invest now that the Everything Bubble has burst.
It will be available exclusively to our clients.
If you’d like to have a copy delivered to your inbox when it’s completed, you
can join the wait-list here.
According to the Bureau of Economic Analysis (BEA), the U.S. economy grew at an annual rate of 2.6% in 3Q22. So all of our concerns about a recession were misguided! The economy is back on track!
There’s only one problem with this narrative: the BEA “massaged” the data to make things look better than reality.
As Bill King notes in the King Report, the BEA used an inflation rate of 4.1% to manufacture the GDP growth of 2.6%.
Yes, you read that correctly. The BEA claims inflation was 4.1% in 3Q22.
It’s an odd claim, given that the BEA used an inflation rate of over 9% during 2Q22. So the BEA is claiming that inflation was cut in half between June and October?
Good luck with that!
It’s not like we don’t have other data to compare to. Heck, even the Consumer Price Index (CPI), which most people know understates inflation, had inflation around 8% for most of 3Q22.
Why would the BEA claim inflation was so much lower than reality?
Because UNDER-stating inflation allowed them to OVER-state growth.
Let’s say that GDP grows by 10% in a given quarter. On the surface that sounds pretty fantastic. But what if inflation was at 10% during that same quarter? Well then in real terms, there was ZERO growth: all of the “growth” was in fact the product of prices rising courtesy of inflation.
Put another way, by using the ridiculously low inflation rate of 4.1%, the BEA was able to manufacture GDP growth 2.6% for 3Q22. Had the BEA used a more realistic measure of inflation, GDP growth would have been ZERO if not negative.
And we can’t have that a mere two weeks before the mid-terms can we?
The reality is that the economy is already in recession. I know it. You know it. Heck, the bond market just told all of us when the yield curve inverted… just as it did in 2007, late 2019 and today.
By the time the official numbers admit this, stocks will have already collapsed to new lows. In the meantime, those investors who are buying into the BEA’s ridiculous growth claims are being lead like sheep to the slaughter.
Meanwhile, smart investors are taking advantage of this to prepare for the coming crash.
For those looking to prepare and profit from this mess, our Stock Market Crash Survival Guide can show you how.
Today is the last day this report will be available to the public. We extended this deadline based on the dead cat bounce in stocks the last week. But this is it! No more extensions!