By Graham Summers, MBA | Chief Market Strategist
The stock market is in melt up mode… with the markets entering bubble territory. And it’s going to end in disaster.
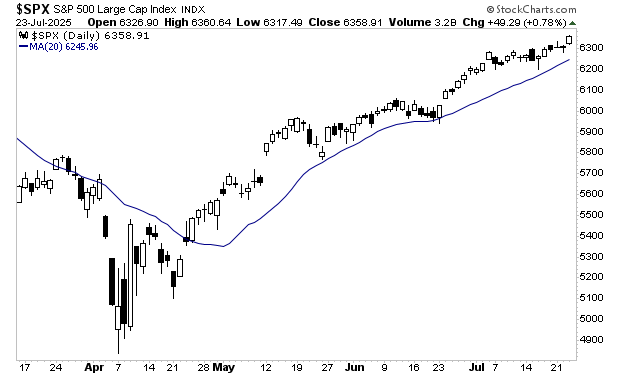
The S&P 500 has now gone 62 days without touching is 20-day moving average (DMA). There have been intraday moves where the index briefly touched the line, but we haven’t had a daily close on it in over two months.
This hasn’t happened since the Dot Com bubble in the late 1990s.
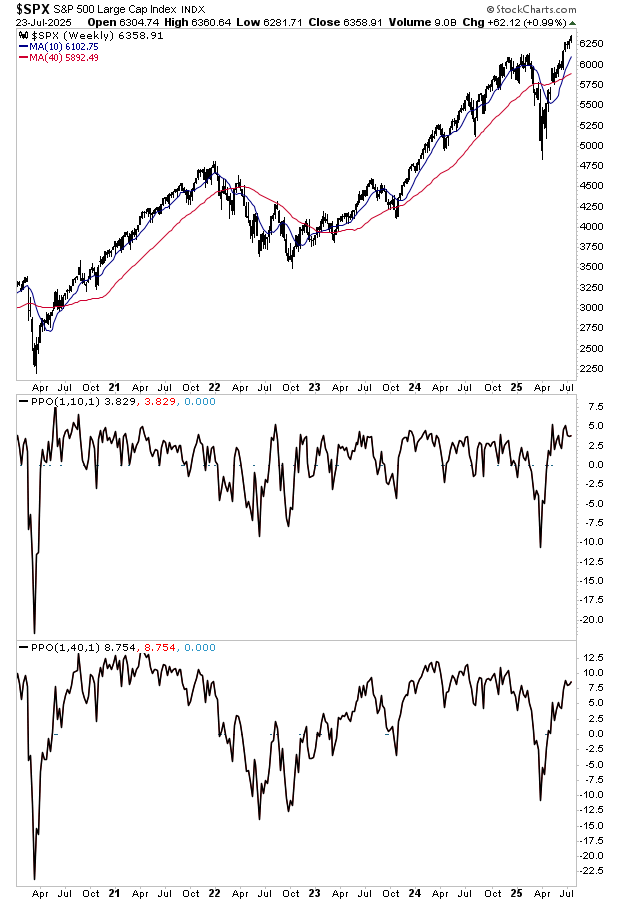
Similarly, the S&P 500 is ~4% above its 10-week moving average (the same as the 50-DMA) and ~8% above its 40-WMA (the same as the 200-DMA). Historically, these levels of extension above the intermediate and long-term trend have marked short-term tops, or at least periods of consolidation. They’re not this time… which again suggests a bubble is forming.
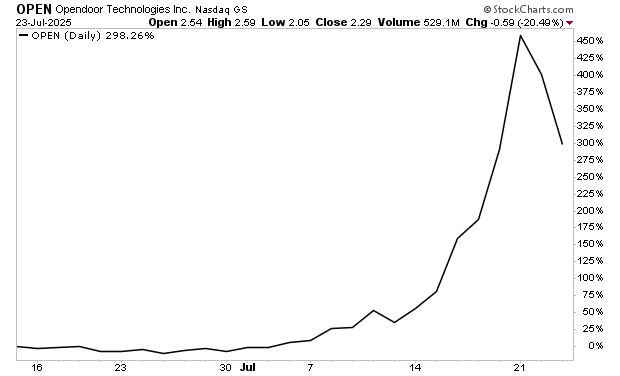
And finally, we are back to the meme stock days where companies with poor to awful fundamentals are exploding higher by hundreds of percentage points. The latest example is Opendoor Technologies (OPEN) which, despite never earning a cent in net income, has rallied over 400% in the last week or so.
When will this end? I have no idea… but we all know HOW it will end: in disaster as every mania does.
This is when BIG money can be made.
With this in mind, investors should ride the current bull market in stocks while keeping one eye on the exits. We are urging our clients to do precisely this with a tool we’ve developed that has accurately predicted every major market collapse in the last 40 years.
We detail it, how it works and what it’s saying about the markets today in How to Predict a Crash. Normally we’d sell this report for $499, but in light of what’s happening in markets today, we’re making just 99 copies available to the investing public.
To pick one up…
Graham Summers, MBA
Chief Market Strategist
Phoenix Capital Research