Debt Bomb

The Bond Bubble Has Begun Bursting

The Bond Bubble Has Begun Bursting

The bursting of the bond bubble has begun.

As I’ve outlined previously the primary concern for Central Banks is the bond bubble. CNBC and other financial media focus on stocks because the asset class is more volatile and so makes for better content, but the foundation of the financial system is bonds. And bonds are THE focus for Central Banks.

In the simplest of terms, the world is awash in too much debt. The bond bubble was close to $80 trillion in size going into 2008. The Central Banks had a choice to either let the defaults hit and clear out the garbage debt from the financial system or attempt to inflate the debts away.

They chose to attempt to inflate the debts away. Put differently, all of their policies were aimed at containing debt deflation… or the process through which debt becomes less and less serviceable leading to eventual insolvency and default.

To whit:

  • Central Banks cut interest rates to zero to make bond payments smaller.
  • Central Banks launched QE and other programs to put a floor beneath bond prices (when bond prices rise, bond yields fall and debt payments become smaller and easier to service).
  • Central Banks provided verbal intervention promising to do “more” or “whatever it takes” whenever bonds came close to ending their bull market.

As a result of this, the financial system has become even more leveraged than it was in 2007 at the beginning of the last debt crisis.

Globally the bond bubble has grown by more than $20 trillion since 2008. Today it is north of $100 trillion, with an additional $555+ trillion in derivatives trading based on it.

Yes, $555 TRILLION, more than seven times global GDP, and more than 10 times the Credit Default Swap market ($50 trillion), which triggered the 2008 Crisis.

———————————————————————–

The Single Best Options Trading Service on the Planet

Our options service THE CRISIS TRADER is absolutely KILLING it.

We have a success rate of 72% meaning we make money on more than seven out of 10 trades.

Even if you include ALL of our losers, we are up 35% year to date.

Over the same time period, the S&P 500 is 0%.

That’s correct, with minimal risk, we are outperforming the S&P 500 by 35%… and the year isn’t even over yet! Heck, we just closed out another 35% winner yesterday!

Our next goes out tomorrow morning… you can get it and THREE others for just 99 cents.

To take out a $0.99, 30 day trial subscription to THE CRISIS TRADER…

CLICK HERE NOW!!!

———————————————————————–

By not allowing the bad debts to clear in 2008, the Central Banks conditioned everyone from consumers to corporations to believe that business cycles could be contained and that the bond bubble/ bull market had not ended.

As a result of this, TRILLIONS of dollars of capital have been misallocated. The evidence is everywhere you look. Corporates around the globe have been issuing record amounts of debt, much of it in US Dollars.

Few of these bonds were high quality. Indeed, globally over 50% of all corporate bonds are now “junk.”

Chinese firms might be the most out of control when it comes to bond issuance, but they are hardly unique. As the below chart reveals, the pace of corporate debt issuance in Emerging Markets worldwide has been extraordinary relative to economic growth.

Today, the Emerging Market corporate bond market is equal to nearly 75% of total Emerging Market GDP. It was at just 50% in 2007 during the last peak!

EM-corp-bonds

H/T Jeroen Blokland

This has also been the case in the US where corporates have posted four straight years of record bond issuance.

Moreover, most of US corporate bond issuance is going towards stock buybacks and financial engineering (massaging results to look better than they are) NOT legitimate expansion.

As a result of this, the financial system today is even more leveraged with more garbage debt than it was going into 2008.

Another Crisis is coming. Smart investors are preparing now.

If you’re an investor who wants to make big money from the markets, then you NEED to take out a trial subscription to our paid premium investment newsletter Private Wealth Advisory.

Private Wealth Advisory is a WEEKLY investment newsletter with an incredible track record.

Over the last 14 months we’ve closed out 48 straight winning trades. That’s an average of nearly FOUR winners per month.

And throughout this period, we’ve not closed a SINGLE loser.

In fact, I’m so confident in my ability to pick winning investments that I’ll give you 30 days to try out Private Wealth Advisory for just 98 CENTS.

If you have not seen significant returns from Private Wealth Advisory during those 30 days, just drop us a line and we’ll cancel your subscription with no additional charges.

All the reports you download are yours to keep, free of charge.

To take out a $0.98, 30-day trial subscription to Private Wealth Advisory…

CLICK HERE NOW!

Best Regards

Graham Summers

Phoenix Capital Research


Posted by Phoenix Capital Research in Debt Bomb

Deflation is Back… Will It Lead to Another Crash?

Central Bankers are flummoxed.

Having cut interest rates over 600 times since 2009 (and printed over $15 trillion), they’ve yet to generate the expected economic growth.

Despite these failures, the ECB, and the Bank of Japan are currently engaging massive QE programs. The Fed is the only major Central Bank not rapidly expanding its balance sheet.

Why, after six years, are we still seeing such aggressive policies?

Because deflation, the bad kind, is once again lurking around the corner.

Anyone with a functioning brain knows that deflation is a good thing. No one complains when they are able to buy something at a lower price, whether it is a home, gasoline, or computer.

However, debt deflation is a different story. Debt deflation means that future debt payments are becoming more expensive. This means that debt servicing will become more difficult, eventually leading to default and debt restructuring.

It is debt deflation that remains the primary focus for the global Central Banks. Indeed, if you consider the threat of debt deflation, every Central Bank move makes sense. ZIRP, NIRP, and QE all have the same goal in mind: to lower interest rates and push bonds higher (thereby making sovereign debt loads more serviceable).

With this in mind, even a whiff of debt deflation is enough to give Central Bankers nightmares. It’s also why they are so fond of inflation via currency devaluation, as it permits them to render massive debt loads more serviceable.

Unfortunately, the great “reflation experiment” is failing. Indeed, as Societe General has noted, it appears the developed world may be “turning Japanese” i.e. moving into a long-term deflationary cycle similar to that which has plagued Japan for the last 20 years.

———————————————————————–

The Single Best Options Trading Service on the Planet

Our options service THE CRISIS TRADER is absolutely KILLING it.

We have a success rate of 72% meaning we make money on more than seven out of 10 trades.

Even if you include ALL of our losers, we are up 35% year to date.

Over the same time period, the S&P 500 is FLAT (0%).

That’s correct, with minimal risk, we are outperforming the S&P 500 by 35%… and the year isn’t even over yet! Heck, we just closed out another 30% winner earlier this week!

Our next goes out shortly… you can get it and THREE others for just 99 cents.

To take out a $0.99, 30 day trial subscription to THE CRISIS TRADER…

CLICK HERE NOW!!!

———————————————————————–

To whit, inflation expectations are collapsing globally.

In Europe, despite three cuts into NIRP, the announcement of QE and an extension of QE, inflation is barely positive at 0.2%.

euro-area-inflation-cpi-1

Then of course there is the US.

There, one of the better measures of inflation expectations is the 5 Year, 5-Year Forward Inflation Expectation Rate. That is simply a long way of saying that this chart measures where investors expect inflation to be in five years… and running for five years after that date.

GPC1221152
As you can see, inflation expectations have collapsed in the latter half of 2015. Post-2008, any time this measure has fallen below the Fed’s desired threshold of 2%, it has launched a new monetary policy. In 2010 it was QE 2. In 2011 it was Operation Twist.

We’re now well below that level. And this is AFTER six years of ZIRP and $4 trillion in QE!

Deflation is back… and as it rears its head again in the west, Western Central Banks will soon be forced to answer the question.

Can we actually stop deflation?

Unfortunately for them, the answer is likely no.

Consider Japan.

Japan has engaged in NINE QE programs since 1990. Since that time, the country’s GDP growth has been anemic at best. Indeed, even its latest MASSIVE QE program (a single monetary program equal to 25% of Japan’s GDP) only boosted Japan’s GDP for two quarters before growth rolled over again. Indeed, Japan is once again back in technical recession as of our writing this.

japan-gdp-growth

The reality is slowly beginning to sink in that Central Banks cannot put off the business cycle. They’ve spent over $15 trillion and cut interest rates over 600 times and all they’ve generated is one of the weakest recoveries on record.

What happens the next time global GDP takes a nosedive when Central Banks have already used up all of their ammunition?

Two works: Markets Crash.

If you’re an investor who wants to increase your wealth dramatically, then you NEED to take out a trial subscription to our paid premium investment newsletter Private Wealth Advisory.

Private Wealth Advisory is a WEEKLY investment newsletter with an incredible track record.

To whit, we just closed out two new double digit winners yesterday, bringing us to 40 straight winning trades over the last 12 months.

That correct, during the last year, we’ve not closed a SINGLE LOSER.

And if you go back further, 46 of our last 47 trades have made money.

In fact, I’m so confident in my ability to pick winning investments that I’ll give you 30 days to try out Private Wealth Advisory for just 98 CENTS.

During that time, you’ll receive over 50 pages of content… along with investment ideas that will help make you money… ideas you won’t hear about anywhere else.

If you have not seen significant returns from Private Wealth Advisory during those 30 day, just drop us a line and we’ll cancel your subscription with no additional charges.

All the reports you download are yours to keep, free of charge.

To take out a $0.98, 30-day trial subscription to Private Wealth Advisory…

CLICK HERE NOW!

Best Regards

Graham Summers

Chief Market Strategist
Phoenix Capital Research

Posted by Phoenix Capital Research in Debt Bomb, stock collapse?

The Fed Rate Hike Will Trigger a $9 Trillion Meltdown

Yesterday, the Fed has hiked interest rates from 0.25% to 0.5%.

It is the first rate hike in 10 years. And it is now clear that the Fed is not only behind the ball in terms of raising rates… but that it has now primed the financial system for another 2008-type meltdown.

By way of background we need to consider the relationship between the US Dollar and the Euro.

The Euro comprises 56% of the basket of currencies against which the US Dollar is valued. As such, the Euro and the Dollar have a unique relationship in which whatever happens to the one will have an outsized impact on the other.

Here’s why the Fed’s decision to raise rates will implode the financial system.

In June 2014 the ECB cut interest rates to negative. Before this, the interest rate differential between the Euro and the US Dollar was just 0.25% (the US Dollar was yielding 0.25% while the deposit rate on the Euro was at exactly zero).

While significant, the interest rate differential was not enough to kick off a complete flight of capital from the Euro to the US Dollar. However, when the ECB launched NIRP, cutting its deposit rate to negative 0.1%, the rate differential (now 0.35%) and punitive qualities of NIRP (it actually cost money to park capital in the Euro) resulted in vast quantities of capital fleeing Euros and moving into the US Dollar.

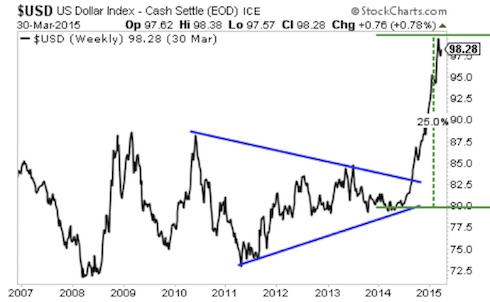
Soon after, the US Dollar erupted higher, breaking out of a multiyear triangle pattern and soaring over 25% in a matter of nine months.

GPC1217151
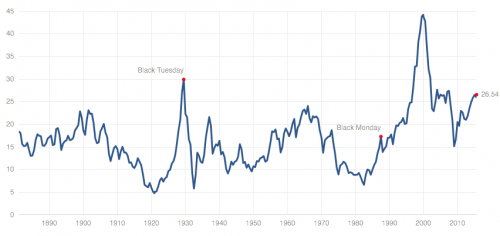
To put this into perspective, this move was larger in scope than the “flight to safety” that occurred in 2008 when everyone thought the world was ending.

———————————————————————–

The Opportunity to Make Triple If Not QUADRUPLE Digit Gain is Here

The largest investor fortunes in history were made during crises.

For that reason, we’ve launched a special options trading service designed specifically to profit from the coming crisis.

It’s called THE CRISIS TRADER and already it’s locking in triple digit winners including gains of 151%, 182%, 261% and even 436%!

And the REAL crisis hasn’t even started yet!

We have an success rate of 72%(meaning you make money on more than 7 out of 10 trades)…and thanks to careful risk control, we’re outperforming the S&P 500 by over 50%!

Our next trade is going out shortly… you can get it and THREE others for just 99 cents.

To take out a $0.99, 30 day trial subscription to THE CRISIS TRADER...

CLICK HERE NOW!!!

———————————————————————–

The reason this is problematic?

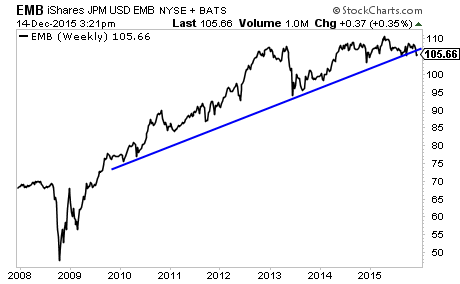
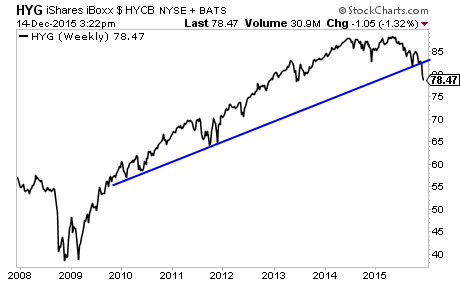
There are over $9 trillion in borrowed US Dollars sloshing around the financial system. And much of it is parked in assets that are denominated in emerging market currencies (the very currencies that have imploded as the US Dollar rallied).

This is the US Dollar carry trade… and it is larger in scope that the economies of Germany and Japan… combined.

In short, when the ECB cut rates to negative, the US Dollar carry trade began to blow up. The situation only worsened when the ECB cut rates even further into negative territory in September 2014 and again last week bringing the rate differential between the US Dollar and Euro to 0.55%.

Now, the Fed has raised interest rates to 0.5%. This has made the interest rate differential between the Euro and the US Dollar 0.75%. This will trigger a complete implosion of the $9 trillion US Dollar carry trade.

This is a long-term, multi-decade chart of the US Dollar.

GPC121715As you can see it has just broken out of the largest falling wedge pattern in monetary history. The chart predicts that during the next leg up, the US Dollar will rally to 120 or even 130.

At that point, the $9 trillion US Dollar carry trade will implode triggering a 2008-type event. Our timeline for this is within the next 12 months.

Smart investors are preparing now.

Private Wealth Advisory subscribers are already profiting from the markets, having just closed THREE more winners yesterday, bringing us to a FORTY THREE trade winning streak…

What is Private Wealth Advisory?

Private Wealth Advisory is a WEEKLY investment newsletter that can help you  profit from the markets. Every week you get pages of high quality editorial presenting market conditions and outlining the best trades to make to profit from them.

It is the only newsletter to have closed 72 consecutive winning trades in a 12 month period (ZERO losers during that time). And we just began another winning streak last year, already racking up 43 straight winners.

And we’ve only closed ONE loser in the last FOURTEEN MONTHS.

You can try Private Wealth Advisory for 30 days (1 month) for just $0.98 cents.

However, this offer will be expiring tomorrow at midnight. I cannot maintain a track record of over a YEAR of straight winners with thousands and thousands of investors following these recommendations.

To take out a $0.98 30-day trial subscription to Private Wealth Advisory… and lock in one of the few remaining slots….

CLICK HERE NOW!

Best Regards

Graham Summers

Chief Market Strategist

Phoenix Capital Research

Posted by Phoenix Capital Research in Debt Bomb, stock collapse?

The Fuse on the Global Debt Bomb Has Just Been Lit

The global bond bubble has begun bursting.

This process will not be fast by any means.

Central Banks and the political elite will fight tooth and nail to maintain the status quo, even if this means breaking the law (freezing bank accounts or funds to stop withdrawals) or closing down the markets (the Dow was closed for four and a half months during World War 1).

There will be Crashes and sharp drops in asset prices (20%-30%) here and there. However, history has shown us that when a financial system goes down, the overall process takes take several years, if not longer.

By way of example let us consider the details surrounding the Tech Bubble: the single largest stock market bubble of the last 100 years. In this case, the Bubble pertained to just one asset class (stocks). In fact, the bubble was relatively isolated to one specific sector, Tech Stocks.

And to top if off, it was absolutely obvious to anyone that it was a Bubble: note that the Cyclical Adjusted Price to Earnings or CAPE ratio for the Tech Bubble dwarfed all other bubbles dating back to 1890.

CAPEStocks were so obviously overvalued that it was truly absurd.

And yet, despite the fact that this bubble was absolutely obvious and involved only one asset class, it still took investors well over six months after the initial 20% crash to realize that the top was in and the bubble had burst.

sc-3

———————————————————————–

The Opportunity to Make Triple If Not QUADRUPLE Digit Gain is Here

The largest investor fortunes in history were made during crises.

For that reason, we’ve launched a special options trading service designed specifically to profit from the coming crisis.

It’s called THE CRISIS TRADER and already it’s locking in triple digit winners including gains of 151%, 182%, 261% and even 436%!

And the REAL crisis hasn’t even started yet!

We have an success rate of 72%(meaning you make money on more than 7 out of 10 trades)…and thanks to careful risk control, we’re outperforming the S&P 500 by over 50%!

Our next trade is going out shortly… you can get it and THREE others for just 99 cents.

To take out a $0.99, 30 day trial subscription to THE CRISIS TRADER...

CLICK HERE NOW!!!

———————————————————————–

Let that sink in for a moment. Stocks were clearly in a bubble. Indeed, it was literally THE stock bubble of the last 100 years. And yet, when it burst, there was no clear consensus as to where the market was heading.

My point with all of this is that even when the bubble was both very specific AND obvious, the collapse was neither quick nor clean. There were several large 20%+ crashes, but overall, it was a roller coaster with jarring rallies than gradually wore its way down.

And when you extend the collapse from peak to bottom, the whole collapse took nearly three years.

To return to my initial point: the coming collapse in the financial markets will take its time. This is particularly true this time around because the bubble pertains to bonds: the senior-most asset class in the financial system.

By way of explanation, let’s consider how the current monetary system works…

The current global monetary system is based on debt. Governments issue sovereign bonds, which a select group of large banks and financial institutions (e.g. Primary Dealers in the US) buy/sell/ and control via auctions.

These financial institutions list the bonds on their balance sheets as “assets,” indeed, the senior-most assets that the banks own.

The banks then issue their own debt-based money via inter-bank loans, mortgages, credit cards, auto loans, and the like into the system. Thus, “money” enters the economy through loans or debt. In this sense, money is not actually capital but legal debt contracts.

Because of this, the system is inherently leveraged (uses borrowed money).

Consider the following:

  • Total currency (actual cash in the form of bills and coins) in the US financial system is little over $1.2 trillion.
  • If you want to include money sitting in short-term accounts and long-term accounts the amount of “Money” in the system is about $10 trillion.
  • In contrast, the US bond market is well over $38 trillion.
  • If you include derivatives based on these bonds, the financial system is north of $191 trillion.

Bear in mind, this is just for the US.

Again, debt is money. And at the top of the debt pyramid are sovereign bonds: US Treasuries, German Bunds, Japanese Government Bonds, etc. These are the senior most assets used as collateral for interbank loans and derivative trades. THEY ARE THE CRÈME DE LA CRÈME of our current financial system.

So, this time around, when the bubble bursts, it won’t simply affect a particular sector or asset class or country… it will affect the entire system.

So…. the process will take considerable time. Remember from the earlier pages, it took three years for the Tech Bubble to finally clear itself through the system. This time it will likely take as long if not longer because:

  • The bubble is not confined to one country (globally, the bond bubble is over $100 trillion in size).
  • The bubble is not confined to one asset class (all “risk” assets are priced based on the perceived “risk free” valuation of sovereign bonds… so every asset class will have to adjust when bonds finally implode).
  • The Central Banks will do everything they can to stop this from happening (think of what the ECB has been doing in Europe for the last three years)
  • When the bubble bursts, there will very serious political consequences for both the political elites and voters as the system is rearranged.

The size of the bond bubble alone should be enough to give pause.

However, when you consider that these bonds are pledged as collateral for other securities (usually over-the-counter derivatives) the full impact of the bond bubble explodes higher to $555 TRILLION.

To put this into perspective, the Credit Default Swap (CDS) market that nearly took down the financial system in 2008 was only a tenth of this ($50-$60 trillion).

On that note, we should point that the fuse is already lit on the global debt bomb. Emerging Market bonds taking out their bull market trendline.

GPC1215151Junk bonds are also in the process of ending their multi-year bull market.

GPC1215152The bursting of the bond bubble has begun. This process will take months to unfold and it will culminate in a stock market crash.

Private Wealth Advisory subscribers are already profiting from the markets, having just closed THREE more winners yesterday, bringing us to a FORTY THREE trade winning streak…

What is Private Wealth Advisory?

Private Wealth Advisory is a WEEKLY investment newsletter that can help you  profit from the markets. Every week you get pages of high quality editorial presenting market conditions and outlining the best trades to make to profit from them.

It is the only newsletter to have closed 72 consecutive winning trades in a 12 month period (ZERO losers during that time). And we just began another winning streak last year, already racking up 43 straight winners.

And we’ve only closed ONE loser in the last FOURTEEN MONTHS.

You can try Private Wealth Advisory for 30 days (1 month) for just $0.98 cents.

However, this offer will be expiring tomorrow at midnight. I cannot maintain a track record of over a YEAR of straight winners with thousands and thousands of investors following these recommendations.

To take out a $0.98 30-day trial subscription to Private Wealth Advisory… and lock in one of the few remaining slots….

CLICK HERE NOW!

Best Regards

Graham Summers

Chief Market Strategist

Phoenix Capital Research

Posted by Phoenix Capital Research in Debt Bomb, stock collapse?