Month: November 2021

The Market is Telling Us It’s VERY Sick… Is Another Puke Coming?

The Market is Telling Us It’s VERY Sick… Is Another Puke Coming?

Let’s cut through the BS here.

You cannot predict the future. No one can. Not me. Not Warren Buffett. No one.

We cannot predict if omicron will prove to be a devastating mutation of the virus. Similarly, we cannot predict if world leaders will shut-down the economy again, regardless of the “science” behind that policy.

We also cannot predict if this hiccup will force the Fed to abandon its tightening policy. Nor can we predict what the impact will be on growth. Even if there are NOT shutdowns, we have no idea how another mutation will impact human behavior as far as spending, demand, and the like.

So what can we do?

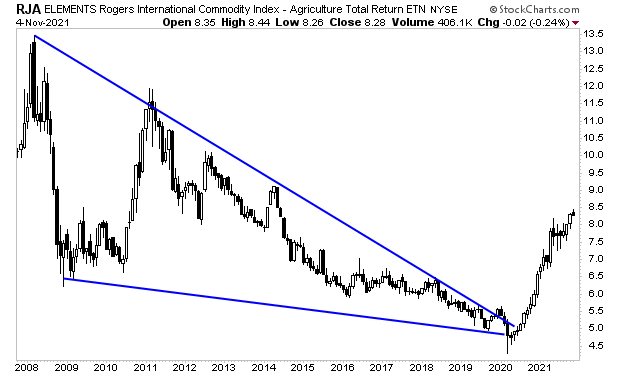
Focus on price and let the market show us.

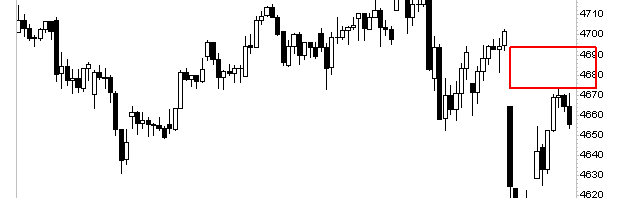
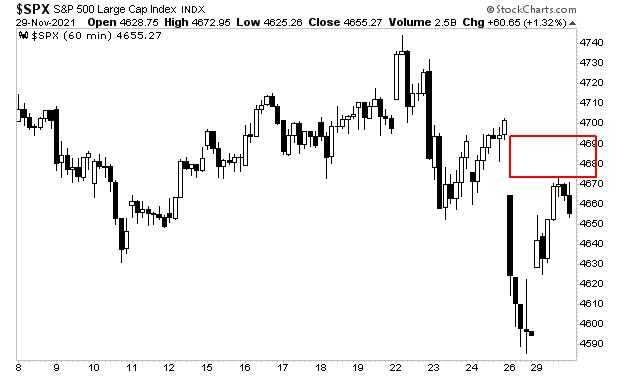
Yesterday’s price action was awful. You’d think after a dump like Friday’s we’d get a major bounce. NOPE. Stocks didn’t even “close the gap” created by that drop.

A picture containing text, antenna, screenshot

Description automatically generated

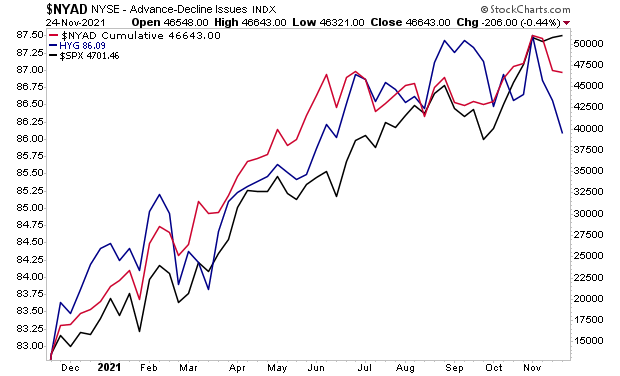
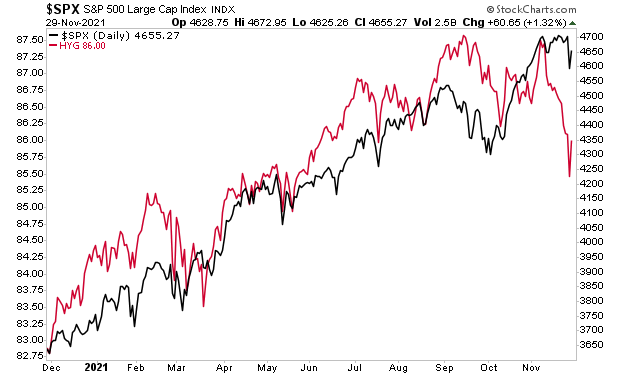
Moreover, high yield credit, which leads stocks, hasn’t recovered much if at all. If anything, it’s telling us that stocks are due for another bloodbath shortly.

As I said yesterday, I didn’t trust yesterday’s bounce…at all. Another puke is coming. And this time around, smart investors will be using it to get rich, instead of getting taken to the cleaners.

For those looking to prepare and profit from this mess, our Stock Market Crash Survival Guidecan show you how.

Within its 21 pages we outline which investments will perform best during a market meltdown as well as how to take out “Crash insurance” on your portfolio (these instruments returned TRIPLE digit gains during 2008).

To pick up your copy of this report, FREE, swing by:

https://phoenixcapitalmarketing.com/stockmarketcrash.html

Best Regards,

Posted by Phoenix Capital Research in stock collapse?
The Bloodbath Has Arrived

The Bloodbath Has Arrived

For weeks I’ve been pounding the table that the market is in serious trouble.

I’ve shown that four out of the market’s five most heavily weighted stocks have begun breaking down.

I’ve shown that only a handful of stocks are holding up the entire market as the number of NASDAQ stocks hitting new lows is approaching levels associated with the fastest 30% market crash in history.

I’ve explained in great detail that the market is extremely stretched to the upside. Indeed, the only time it has been this stretched or more was right before the 1987 crash and during the Tech Bubble.

Chart, histogram

Description automatically generated

I’ve even shown that leading market indicators such as high yield credit and breadth had rolled over and were dropping hard.

Chart, histogram

Description automatically generated

Now the bloodbath has arrived.

For those looking to prepare and profit from this mess, our Stock Market Crash Survival Guidecan show you how.

Within its 21 pages we outline which investments will perform best during a market meltdown as well as how to take out “Crash insurance” on your portfolio (these instruments returned TRIPLE digit gains during 2008).

To pick up your copy of this report, FREE, swing by:

https://phoenixcapitalmarketing.com/stockmarketcrash.html

Best Regards,

Posted by Phoenix Capital Research in stock collapse?
The Government Created Inflation… and Has No Idea How to Fix It

The Government Created Inflation… and Has No Idea How to Fix It

As I outlined yesterday, inflation has arrived in the financial system… and there’s nothing policymakers can do to fix it.

When the U.S. opted to shut down its economy in 2020, it embarked on the single greatest mistake in policy history. Economies are not like Netflix, you can’t just pause them for a while without doing MAJOR structural damage.

That damage has arrived in the form of supply chain issues and labor shortages.

Everywhere you look, the manufacturing and delivery of goods and services is taking weeks if not months longer than usual.

  • Over 100 cargo ships are just sitting off the coast of California waiting to be unloaded by dock workers who have changed jobs or simply aren’t returning to work.
  • The trucking industry has been decimated as the shutdowns resulted in many drivers retiring early. Throw in vaccine mandates, and you’ve got even fewer truckers hitting the roads and transporting much needed goods.
  • Coal and energy resources are sitting in the earth, as coal workers and oil employees changed careers entirely or are refusing to return to work.

And on and on.

Meanwhile, demand for everything has come roaring back as Americans are keen to return to “normal life” after a year in lockdown.

Regular Demand + Fewer Goods and Services =HOT INFLATION

And get this… the craziest thing about this whole mess is that the same policymakers who created it, can’t do a thing to fix it.

The Fed, which has printed over $4 TRILLION to prop up the financial system can’t print new workers keen to return to work. Keeping interest rates at zero doesn’t make oil prices come down. And spending $120 billion on QE per month doesn’t result in cargo ships being unloaded and life returning to normal.

Similarly, the DC crowd, which didn’t just choose to crash the economy, but has spent over $11 TRILLION in stimulus (50% of GDP) over the last 18 months, has no idea how to fix the mess they made (aside from spending more money).

The Department of Energy Secretary, the highest official for the energy industry in the U.S. doesn’t even know how many barrels of oil the U.S. consumes per day. The Secretary of Transportation is on paternity leave during the single greatest supply chain crisis in decades. The President thinks releasing 50 million barrels of oil from the Strategic Petroleum Reserve (SPR) over several months will lower gas prices… when the U.S. consumes 22 million barrels of oil per day.

It would be hilarious if it wasn’t so tragic. And the reality is that it has unleashed an inflationary storm that is giving investors a ONCE IN A LIFETIME opportunity to get filthy rich from government incompetence.

During the last major bout of inflation in the 1970s, smart investors locked in gains in the QUADRUPLE digits (1,000% or higher). And THAT version of inflation was the kind the Fed could easily stop!

So you can imagine the profit potential of this crisis today.

I outline five investments that could explode higher as inflation rips through the financial system in a Special Investment Report titled Survive the Inflationary Storm.

To pick up a free copy, swing by

https://phoenixcapitalmarketing.com/inflationstorm.html

Best Regards

Posted by Phoenix Capital Research in Inflation

Policymakers Have Unleashed Inflation… and There’s Nothing They Can Do to Fix It

Government bureaucrats have accomplished what Central Bankers have failed to do.

For decades, Central Banks have attempted to “create inflation.”

They’ve cut interest rates over 800 times.

They’ve printed over $20 TRILLION in new money.

They’ve even tried buying every asset you can name (corporate bonds, municipal bonds, student loans, auto loans, Treasuries, Mortgage-Backed Securities, etc.).

None of these strategies worked. Inflation never ran HOT. Heck, it never even rose above 3% for more than a few months.

However, with one simple move, government bureaucrats have accomplished what Central Bankers failed to do.

By shutting down the economy, the government has managed to create crises in both labor (people are not returning to work or have changed careers completely) AND the supply chain (items are delayed for months: sitting idly in cargo ships or simply not being produced at all).

These crises in labor and the supply chain are resulting in lower supplies of much needed resources. Factories are operating at partial capacity or in some cases, not operating at all. Grocery store shelves are running bare. Orders are taking twice if not THREE times as long to be fulfilled.

Much lower supplies + normal demand = HOT INFLATION.

And there’s NOTHING central banks can do to fix this.

The Fed can’t print employees or oil.

QE doesn’t suddenly make factories operate normally.

Yield curve control doesn’t start unloading cargo ships that are sitting at docks.

And the bureaucrats who created this mess don’t have any solutions for it either.

The Biden administration announced today that it will try to force oil prices lower by releasing 50 million barrels of oil from the Strategic Petroleum Reserve (SPR) over the next few months.

This number (50 million barrels) sounds like a lot… until you consider that the U.S. consumes 20 million barrels per day.

Put another way, this release accomplishes nothing. Oil has already rebounded on the news and is back at $80 per barrel.

Again, this kind of inflation cannot be stopped by the Fed or the government. And it has presented us with the opportunity to profit from once in a lifetime event: the arrival of an inflationary crisis that cannot be slowed or stopped by the Fed or fixed by government policies.

During the last major bout of inflation in the 1970s, smart investors locked in gains in the QUADRUPLE digits (1,000% or higher). And THAT version of inflation was the kind the Fed could easily stop!

So you can imagine the profit potential of this crisis today.

I outline five investments that could explode higher as inflation rips through the financial system in a Special Investment Report titled Survive the Inflationary Storm.

To pick up a free copy, swing by

https://phoenixcapitalmarketing.com/inflationstorm.html

Best Regards

Posted by Phoenix Capital Research in Inflation

Is the Everything Bubble About to Burst?

We are getting DARN close to a top of some kind.

The market is being propped up by fewer and fewer stocks. This week, the NASDAQ has had more stocks making new lows than at any time in since the March 2020 CRASH.

And the NASDAQ is at all-time highs.

Again, the NASDAQ is at all-time highs, but the number of NASDAQ stocks hitting new lows is approaching levels associated with the fastest 30% market crash in history.

A picture containing chart

Description automatically generated

This is truly incredible, and it tells us that just a handful of stocks are holding up the entire market. And this is during the greatest stock market bubble of all time… a bubble so massive that it makes the Tech Bubble look like a joke in terms of speculation.

The coming bust is going to be life-changing for many people. Most will lose much if not everything. But a small number of investors will generate literal fortunes.

If you’re interested in becoming one of them, you need to check out the signals that I rely on to tell me when a crash is about to hit.

I detail them, along with what they’re currently saying about the market today in a Special Investment Report How to Predict a Crash.

To pick up a free copy, swing by

https://phoenixcapitalmarketing.com/predictcrash.html

Best Regards

Posted by Phoenix Capital Research in stock collapse?, The Everything Bubble
The Next Fed Chair is Irrelevant… But This Sure As Heck Isn’t!!!

The Next Fed Chair is Irrelevant… But This Sure As Heck Isn’t!!!

The markets are waiting on President Biden who will announce his nominee for the new Fed Chair in three days’ time (over the weekend).

Will current Fed Chair Jerome Powell land a second term… or will the President hand the reins to Lael Brainard or some other Beltway insider?

Or… more importantly… does it even matter?!?!

The Fed has created the largest bubble in financial history… a situation so out of control that:

  1. Crypto currencies that were created as jokes are worth tens of billions of dollars.
  2. People are selling NFTs of farts.
  3. Tesla (TSLA), a $1 trillion company, is trading like a penny stock.
  4. SPACs with NO ACTUAL BUSINESS OPERATIONS being valued at billions of dollars.
  5. Clean energy automobile companies with ZERO REVENUE are valued as being worth more than Volkswagen.

The bubble is massive even using normal metrics.

Warren Buffett’s favorite indicator (stock market capitalization vs. GDP) is at an all-time high, indicating this bubble is even larger than the Tech Bubble.

Options trading volume (a sign of speculation) also dwarfs that of the Tech Bubble. As Bill King noted, this is truly biblical in scope.

And then there’s the fact that the market is stretched a full 40% above its 50-month moving average (MMA). The only times in the last 35 years that it’s been stretched higher than this was right before the 1987 Crash and during the Tech Bubble’s final run to its peak before bursting.

So, whoever President Biden chooses as the next Fed Chair doesn’t really matter. Whoever it is, the bubble is still there, and is still going to burst, triggering the next major crisis.

So forget about the next Fed Chair. What you should be asking yourself is, “how can I avoid THIS?”

To figure this out, I rely on certain key signals that flash before every market crash.

I detail them, along with what they’re currently saying about the market today in a Special Investment Report How to Predict a Crash.

To pick up a free copy, swing by

https://phoenixcapitalmarketing.com/predictcrash.html

Best Regards​

Posted by Phoenix Capital Research in stock collapse?, The Everything Bubble
What’s Coming Will Be Worse Than 2008. Here’s Why…

What’s Coming Will Be Worse Than 2008. Here’s Why…

The great inflationary tidal wave continues to worsen. If anything, all signs indicate an absolute bloodbath is coming to the markets.

Five-year inflation breakeven’s just hit 3.11%. This is the highest reading running back to a least 2003. It’s higher than in 2011, when inflation triggered a food crisis around the globe. It’s also higher than in 2005-2006 when housing was in the largest bubble of all time and oil was about explode higher to $150 a barrel.

Put simply, the financial system is telling us that investors are terrified of inflation and that something truly horrific is coming our way. Worse still, by the look of things, the Fed will have a real problem on its hands trying to stop this. 

Think of it this way… the last time five-year inflation break-evens were even close to this level was in 2005-2006 and the economy and financial system were about to begin the worst recession and financial crisis in 80+ years.

This time around, the situation is far worse. Back then, the economy was growing by 5%-6% and the Fed had interest rates at 5%+ so it had plenty of room to ease to cushion the collapse.

Today the economy is structurally crippled due to the after-effects of the 2020 lockdown while the Fed still has rates at ZERO. If you think the economy is strong, consider that the Fed has admitted it doesn’t believe it can raise rates until the second quarter of 2022 (at the earliest). 

What kind of economy needs rates at zero to function?

Another key difference between the 2005-2006 period and today is that back then the Fed had yet to launch a single QE program. So, the impact of QE was still quite strong.

Today, the Fed is already engaged in a $120 billion QE program which it won’t fully end until mid 2022. 

Put simply, in 2005/ 2006 the Fed was in a much better position to combat a collapsing economy/ financial crisis. This time around, the Fed has already used every tool at its disposal, including some tools (buying corporate debt, municipal debt, etc.) that it technically shouldn’t be allowed to buy at all!

What will the Fed be forced to do when this happens? Cut rates into negative territory? Monthly QE of $250 billion? $500 billion? And what’s going to happen to the markets when this insane bubble bursts and this happens?

Even more importantly for investors…HOW DO WE AVOID THIS? 

To figure this out, I rely on certain key signals that flash before every market crash.

I detail them, along with what they’re currently saying about the market today in a Special Investment Report How to Predict a Crash.

To pick up a free copy, swing by

https://phoenixcapitalmarketing.com/predictcrash.html

Best Regards

​​

Posted by Phoenix Capital Research in stock collapse?, The Everything Bubble

This is the Real Reason the Fed is Terrified of Raising Rates From Zero

Why is the Fed so worried about tapering QE and raising rates?

Think about it… The Fed launched this current version of QE in a single day. Why does it take SIX months for the Fed to end it… especially since stocks are at all-time highs and the COVID-19 induced recession technically ended in June of 2020?

Moreover, this is the LARGEST QE program the Fed has ever run. The prior record was set by QE 3 in 2012 which saw the Fed printing $80 billion in new money per month. The Fed is currently printing $120 billion per month and has been doing so since March of 2020. And because it’s only tapering this program at a pace of $15 billion per month, this current QE will STILL BE larger than the prior largest QE ever a full two months into the taper!

Bear in mind, we’re only talking about QE here. The Fed is terrified of raising rates a full 15 months after the recession supposedly ended… at a time when there are truly INSANE signs of froth in the financial system

Some of the more egregious examples include:

  1. Crypto currencies that were created as jokes worth tens of billions of dollars.
  2. People selling NFTs for farts.
  3. Tesla (TSLA) a $1 trillion company trading like a penny stock.
  4. Options trading volume dwarfing that of the Tech Bubble.
  5. SPACs with NO ACTUAL BUSINESS OPERATIONS being valued at billions of dollars.
  6. Stocks at or recently at all-time highs across the board.
  7. Home prices at all-time highs and rising by 20% year over year.

And the Fed is SCARED of raising rates from ZERO!?!?! We’re not even talking about raising them by 2% or more… we’re talking about raising them from 0.25%!!!

What is going on here?

What’s going on is that this entire “recovery” is based on the Fed manipulating bond yields to extraordinarily low levels.

Our current financial system is based on debt, not gold or some other hard asset. U.S. government debt, called Treasuries, are the bedrock of this financial system. The yields on these bonds represent the “risk free” rate of return against which all risk assets (stocks, commodities, real estate, crypto, etc.) are valued.

The only reason you’ve got stocks at all-time highs is because the Fed has kept rates so low while pumping over $4 trillion in new money into the system. Take that away, and the whole mess is a house of cards.

You can see this everywhere, though you might not be able to connect the dots.

The whole situation is not a real recovery, it’s just a massive band-aid over deep structural wounds that policymakers forced on the economy and financial system when they pushed to shut the economy down.

You can tell the whole thing is total BS based on the stock market alone. Notice how this latest bubble is so extreme it actually exploded out of an uptrend in ways that neither the Tech Bubble nor the Housing Bubble ever did?

Diagram

Description automatically generated

That’s why the Fed is so terrified of normalizing monetary policy. Because it threw the kitchen sink at the financial system to create this bubble.

So what happens when the bubble bursts as all bubbles do? $250 billion in QE per month? $500 billion in QE per month?

At the end of the day, this is coming whether the Fed wants it or not. It’s just a matter of when.

The big question for investors is… HOW DO WE AVOID THIS? 

To figure this out, I rely on certain key signals that flash before every market crash.

I detail them, along with what they’re currently saying about the market today in a Special Investment Report How to Predict a Crash.

To pick up a free copy, swing by

https://phoenixcapitalmarketing.com/predictcrash.html

Best Regards

Posted by Phoenix Capital Research in Debt Bomb, stock collapse?, The Everything Bubble
The Fed is Trapped and a Crash is Coming

The Fed is Trapped and a Crash is Coming

The Fed is now trapped.

Consider:

  • Stocks were just at or are currently at all-time highs, trading at multiples that exceed even those of the Tech Bubble in 1999 (Market Cap/ GDP).
  • There are truly INSANE levels of froth in the markets:
    1. Options trading volume (a sign of speculation) is exponentially higher than it was during the Tech Bubble.
    2. Crypto currencies that were invented as jokes trade at tens of billions of dollars.
    3. Tesla (TSLA) a $1 trillion company, trades like a penny stock rising 15% in a single day.
    4. People are selling Non-Fungible Tokes (NFTs) of farts, and other garbage… and making significant money.
    5. “Meme stocks” or stocks that are traded for ironic/ humorous purposes rise triple digits in a single day.
    6. Former President Trump’s Special Purpose Acquisition Company (SPAC) rose to a value of $5 billion despite having no business or operations.
  • Real estate is on fire. Home prices are up 20% across the board, while apartment rents are up 7%-15%.
  • Gasoline prices are up 122% year over year, while protein prices (meat, fish, eggs) are up 10.5% year over year.

Despite all of this, the Fed has only just begun to taper its $120 billion Quantitative Easing (QE) program at a pace of $15 billion per month. Even at this pace, QE will STILL be above its former peak for another two and a half months (QE 3 was the prior record set in 2012 at $80 billion per month).

Put another way, the Fed’s idea of tightening monetary policy today is that it will run QE at emergency levels for another six months at least. It will only finally be DONE with QE in June of 2022.

Which is 24 months after the recession ended!

Oh, and the Fed doesn’t plan to start raising rates until around then either.

Meanwhile, inflation is ROARING. The Consumer Price Index (CPI) and Core Consumer Price Index (Core CPI) just hit their highest year over year readings since 1990 and 1991 respectively.

This is happening at a time when stocks are more stretched above historic metric than all but a few times in the last 40 years. The only times the market was MORE stretched than this was right before the 1987 crash and during the Tech Bubble.

So, the Fed is facing a conundrum. 

Either it starts tightening a lot more aggressively, thereby bursting this INSANE stock market bubble… or it continues down its current projected path, inflation destroys the economy and stocks crash anyway.

Simply put, one way or another, the following is coming.

The big question for investors is… HOW DO WE AVOID THIS? 

To figure this out, I rely on certain key signals that flash before every market crash.

I detail them, along with what they’re currently saying about the market today in a Special Investment Report How to Predict a Crash.

To pick up a free copy, swing by

https://phoenixcapitalmarketing.com/predictcrash.html

Best Regards,

​​

Posted by Phoenix Capital Research in stock collapse?
It’s Officially the Biggest Bubble of All Time… When Does It Burst?

It’s Officially the Biggest Bubble of All Time… When Does It Burst?

The market is on THIN ice.

This is the single largest stock market bubble in history. It’s larger than the Tech Bubble in multiple metrics including:

  1. Market cap/ GDP (Warren Buffett’s favorite metric).
Chart, line chart

Description automatically generated
  • Options trading volume (a sign of speculation). As Bill King has noted, this is BIBLICAL levels of speculation.
Chart

Description automatically generated
  • Tesla (TSLA) a $1 Trillion company (the size Mexico’s GDP) is trading like a penny stock, moving over 10% to the upside or downside on a given day.
Chart

Description automatically generated

Moreover, stocks are stretched some 40% above their 50-month moving average. It’s only been MORE stretched three times in the last 40 years: right before the 1987 Crash and during the Tech Bubble in the late ‘90s.

Chart, histogram

Description automatically generated

This whole mess is going to come crashing down in spectacular fashion… just as all bubbles do. In chart form, it’s only a matter of time before we experience this:

The big question for investors is… HOW DO WE AVOID THIS? 

To figure this out, I rely on certain key signals that flash before every market crash.

I detail them, along with what they’re currently saying about the market today in a Special Investment Report How to Predict a Crash.

To pick up a free copy, swing by

https://phoenixcapitalmarketing.com/predictcrash.html

Best Regards

Posted by Phoenix Capital Research in stock collapse?
OK, Now This is REALLY Serious

OK, Now This is REALLY Serious

OK, now things are getting really serious.

We all know the Fed is dead wrong about inflation. It is not transitory… and least not in the “it will go away by itself” kind of way the Fed claims.

Worse still, there is nothing the Fed can much of it.

As I’ve noted before, monetary policy cannot fix the supply chain/ labor problems in the economy. The Fed can’t print oil or coal. QE doesn’t make dock workers return to work and start unloading containers. Maintaining lower interest rates doesn’t resolve issues in shipping/ trucking/ manufacturing/ etc.

This situation was already a MAJOR problem when it pertained to microchips and other manufacturing goods. But now it’s spilling over into something more critical.

Food.

In case you missed it, yesterday Bloomberg reported that the current nitrogen shortage has become so problematic that farmers aren’t able to procure the necessary fertilizer to produce their usual crop yields.

So, are we going to have to add a FOOD crisis on top of the inflation that is headed our way? 

Take a look at the below chart of agricultural commodities and you tell me.

That’s a 12-year bear market ending in spectacular fashion. Food inflation was already here BEFORE this nitrogen shortage. So what happens when the next round of crops doesn’t get anywhere near what is expected?

A true inflationary storm.

It’s horrifying, but it has ALSO presented us with the opportunity to profit from once in a lifetime event: the arrival of an inflationary crisis that cannot be slowed or stopped by the Fed.

During the last major bout of inflation in the 1970s, smart investors locked in gains in the QUADRUPLE digits (1,000% or higher). And THAT version of inflation was the kind the Fed could stop!

I outline five investments that could explode higher as inflation rips through the financial system in a Special Investment Report titled Survive the Inflationary Storm.

To pick up a free copy, swing by

https://phoenixcapitalmarketing.com/inflationstorm.html

Best Regards

Posted by Phoenix Capital Research in Inflation
This Ridiculous Accounting Gimmick Has Opened the Door to Potentially Massive Profits

This Ridiculous Accounting Gimmick Has Opened the Door to Potentially Massive Profits

Inflation is bad… so much worse than the official numbers admit.

Dissecting all the gimmicks the Bureau of Labor Statistics (BLS) employed to understate the official inflation numbers would take pages and pages than we have this week. However, one of the more egregious examples concerns its “Shelter” component which is supposed to measure how much it cost to own or rent property in the U.S..

Now, “Shelter” comprises almost 33% of the CPI. So, it’s a MAJOR component of the official inflation number. And as such it is massaged to UNDER-state inflation in a MAJOR WAY.

The BLS counts “Shelter” via two different measures called “Rent of Primary Residency” and “Owners Equivalent Rent.”

Rent of Primary Residence is meant to represent what you would pay to rent a residence including extra charges such as parking or garage facilities.

Owner’s Equivalent Rent is meant to replicate your cost of owning a home based on what you could potentially rent it out for.

The BLS calculates both measures via public surveys. Setting aside the fact that NO ONE wants to talk to the BLS about their expenses (which renders them highly accurate), the BLS still massages the data it does collect to an absurd degree.

Case in point, according to the BLS, Rent of Primary Residence is up only 2.4% over the last 12 months while Owner’s Equivalent Rent is up only 2.9%.

In the REAL world, apartment rental costs are up 8% to 20% depending on the specific market. And Home Prices are up 20% in the last 12 months.

Even if you already own a home, meaning that you don’t need to buy one so the rise in home prices doesn’t hit you right now, you’re still paying more in property taxes and other items related to the spike in home prices.

Put simply, unless you live in a cave, your real-world Shelter expenses are up triple if not quadruple the BLS’s claim of ~3%. And remember, Shelter comprises almost 33% of CPI!

So, what would happen to CPI, which is already clocking in at 5.4%, if the BLS were to use ACCURATE REAL WORLD data for its Shelter component?

It would tell us that REAL inflation is at 7.95%.

It’s terrifying, but it also presents us with an extraordinary opportunity.

During the last major bout of inflation in the 1970s, smart investors locked in gains in the QUADRUPLE digits (1,000% or higher). And THAT version of inflation was the kind the Fed could stop!

So, you can imagine the profit potential of this crisis today.

I outline five investments that could explode higher as inflation rips through the financial system in a Special Investment Report titled Survive the Inflationary Storm.

To pick up a free copy, swing by

https://phoenixcapitalmarketing.com/inflationstorm.html

Best Regards

Posted by Phoenix Capital Research in Inflation