Why is the Fed so worried about tapering QE and raising rates?
Think about it… The Fed launched this current version of QE in a single day. Why does it take SIX months for the Fed to end it… especially since stocks are at all-time highs and the COVID-19 induced recession technically ended in June of 2020?
Moreover, this is the LARGEST QE program the Fed has ever run. The prior record was set by QE 3 in 2012 which saw the Fed printing $80 billion in new money per month. The Fed is currently printing $120 billion per month and has been doing so since March of 2020. And because it’s only tapering this program at a pace of $15 billion per month, this current QE will STILL BE larger than the prior largest QE ever a full two months into the taper!
Bear in mind, we’re only talking about QE here. The Fed is terrified of raising rates a full 15 months after the recession supposedly ended… at a time when there are truly INSANE signs of froth in the financial system
Some of the more egregious examples include:
- Crypto currencies that were created as jokes worth tens of billions of dollars.
- People selling NFTs for farts.
- Tesla (TSLA) a $1 trillion company trading like a penny stock.
- Options trading volume dwarfing that of the Tech Bubble.
- SPACs with NO ACTUAL BUSINESS OPERATIONS being valued at billions of dollars.
- Stocks at or recently at all-time highs across the board.
- Home prices at all-time highs and rising by 20% year over year.
And the Fed is SCARED of raising rates from ZERO!?!?! We’re not even talking about raising them by 2% or more… we’re talking about raising them from 0.25%!!!
What is going on here?
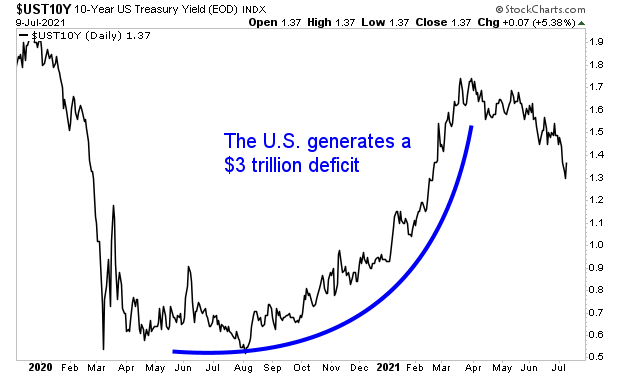
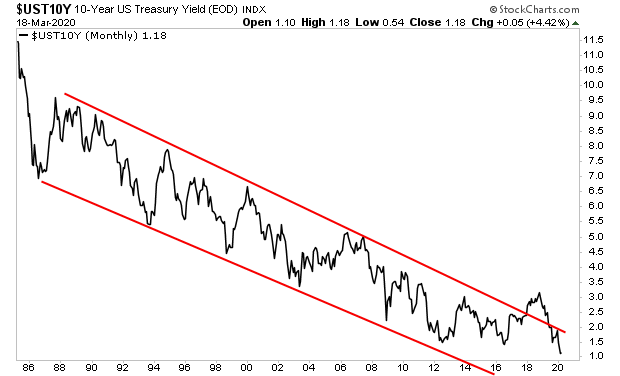
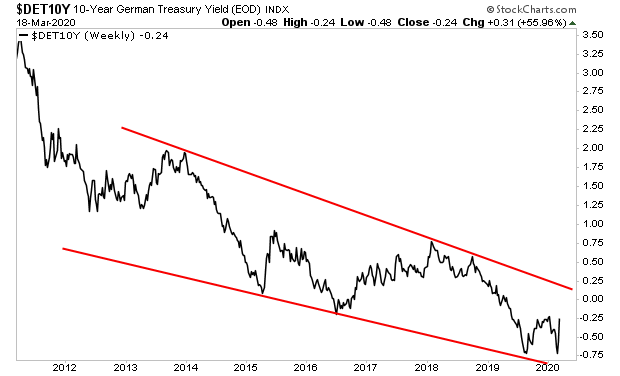
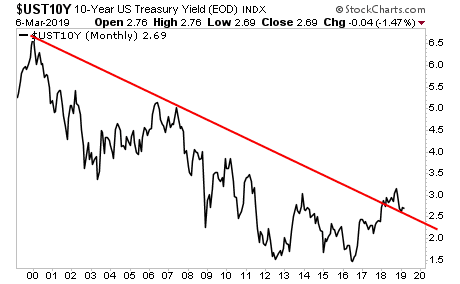
What’s going on is that this entire “recovery” is based on the Fed manipulating bond yields to extraordinarily low levels.
Our current financial system is based on debt, not gold or some other hard asset. U.S. government debt, called Treasuries, are the bedrock of this financial system. The yields on these bonds represent the “risk free” rate of return against which all risk assets (stocks, commodities, real estate, crypto, etc.) are valued.
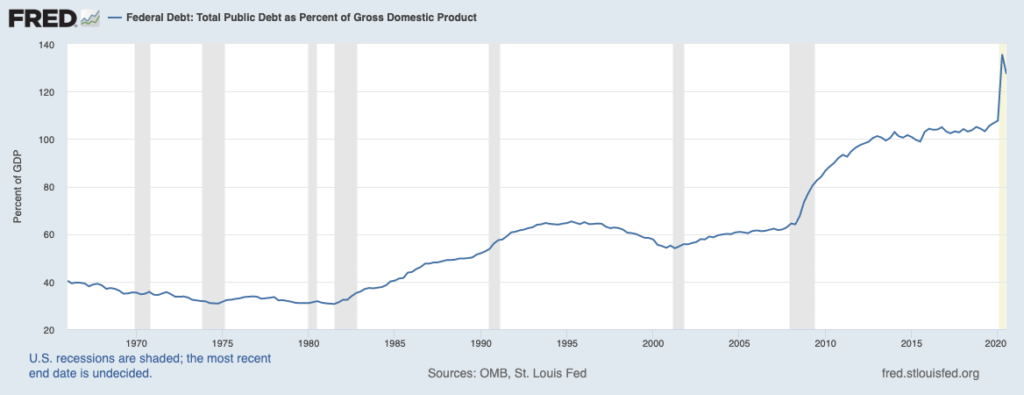
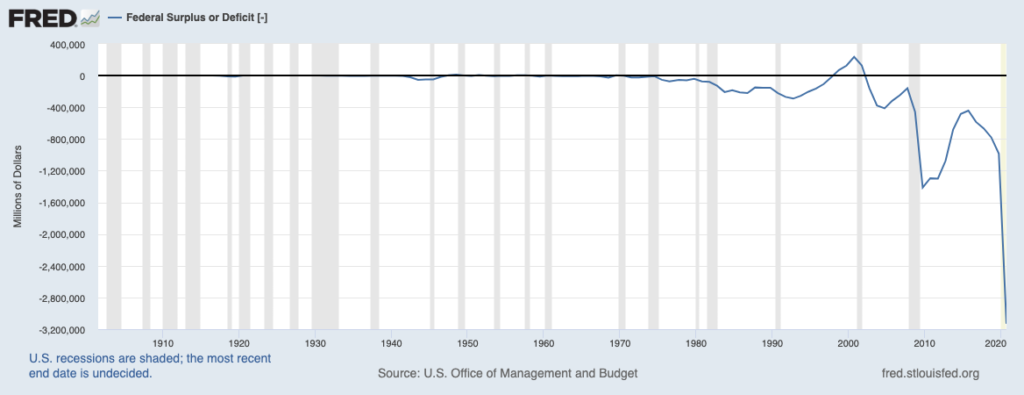
The only reason you’ve got stocks at all-time highs is because the Fed has kept rates so low while pumping over $4 trillion in new money into the system. Take that away, and the whole mess is a house of cards.
You can see this everywhere, though you might not be able to connect the dots.
The whole situation is not a real recovery, it’s just a massive band-aid over deep structural wounds that policymakers forced on the economy and financial system when they pushed to shut the economy down.
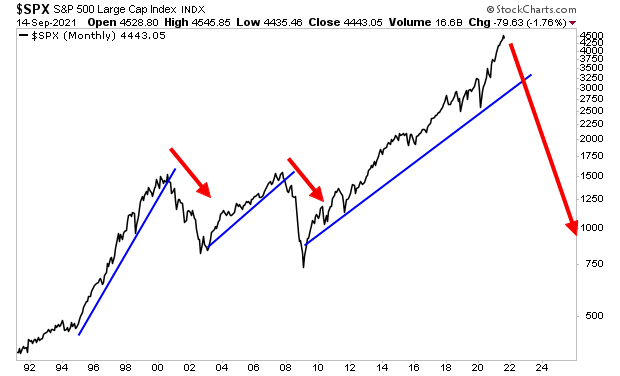
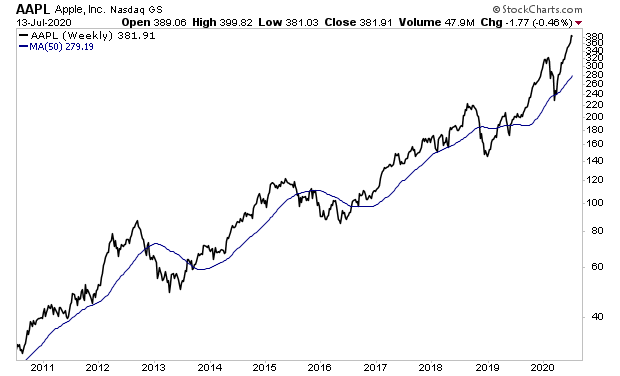
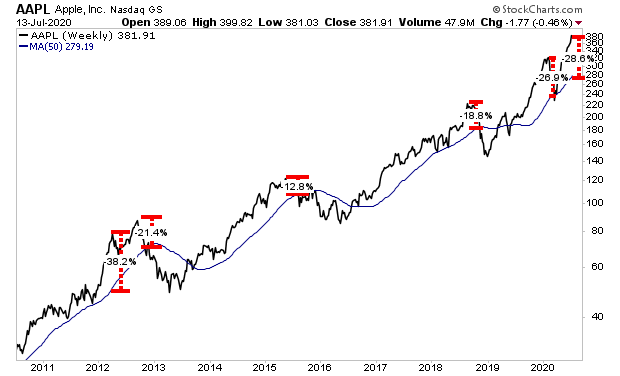
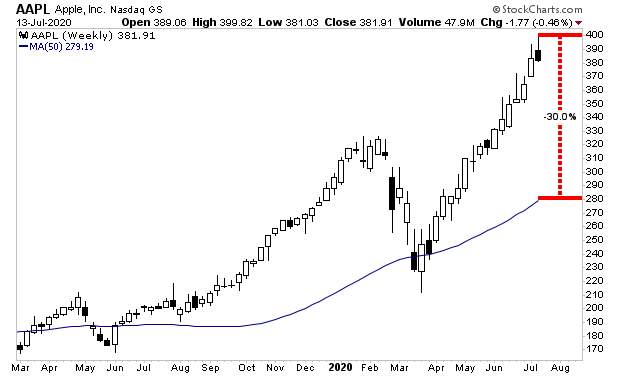
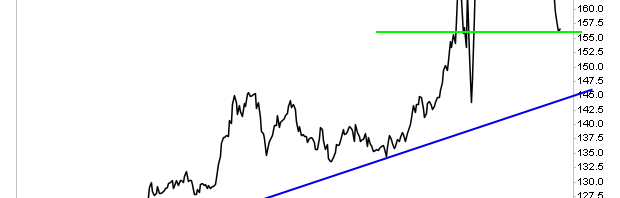
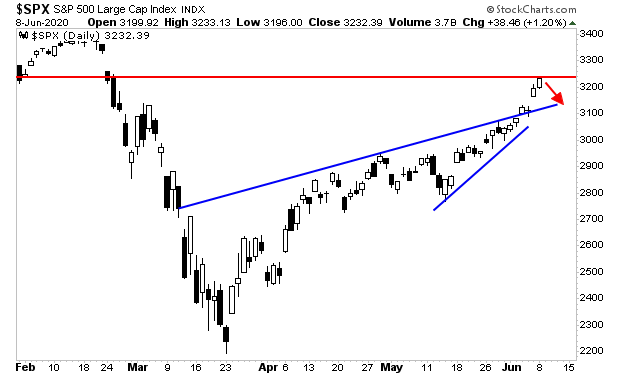
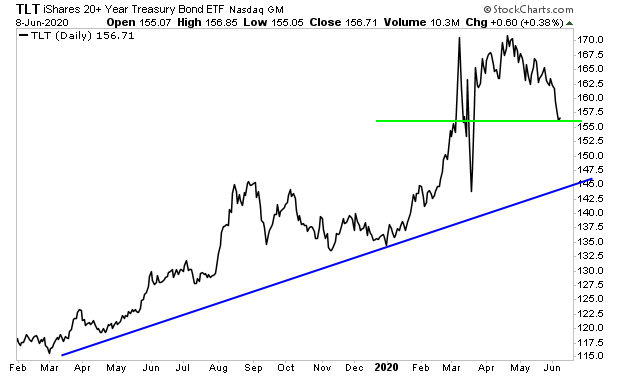
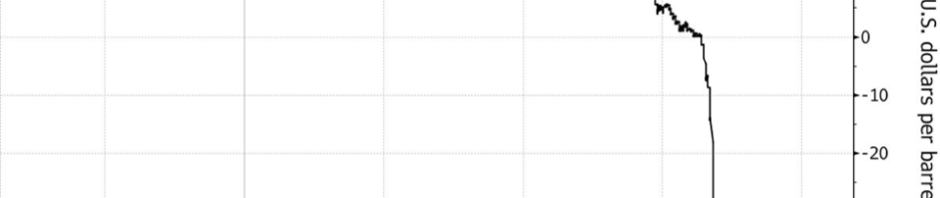
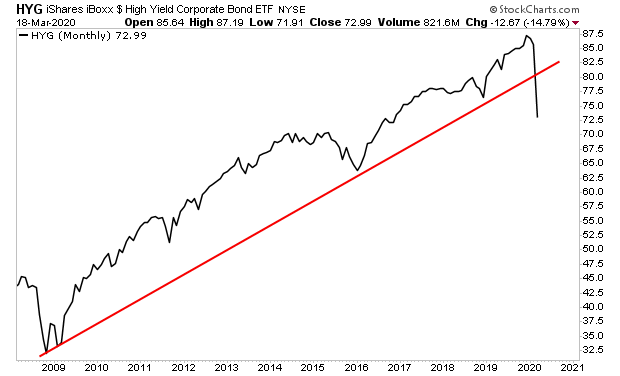
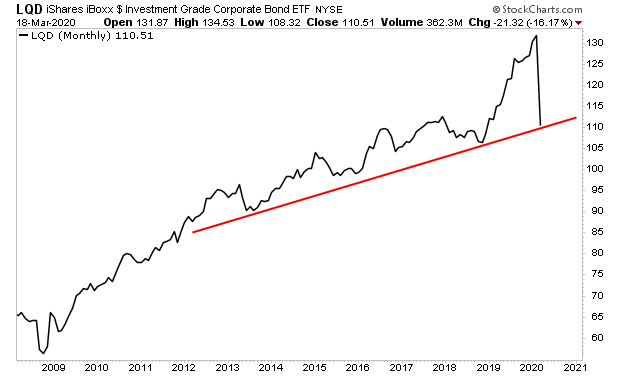
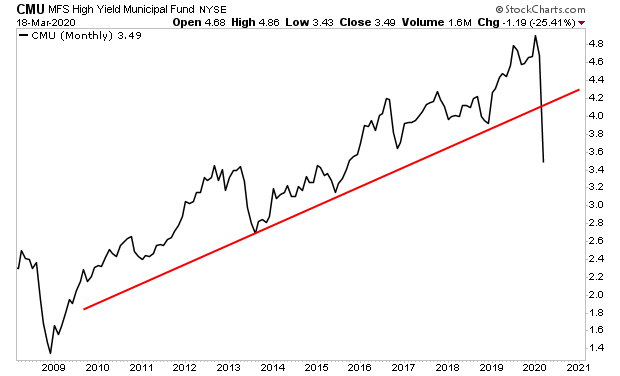
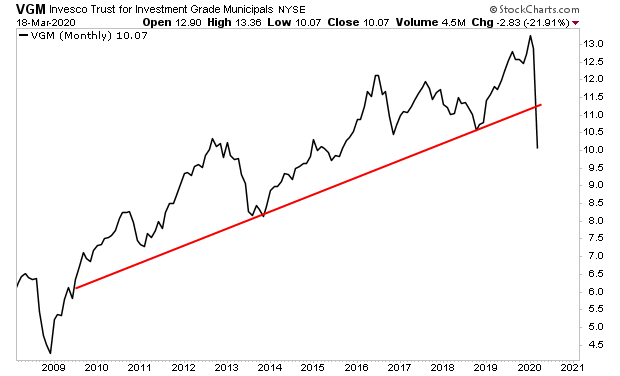
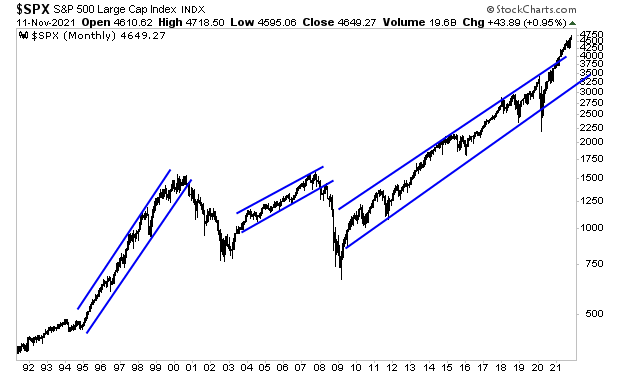
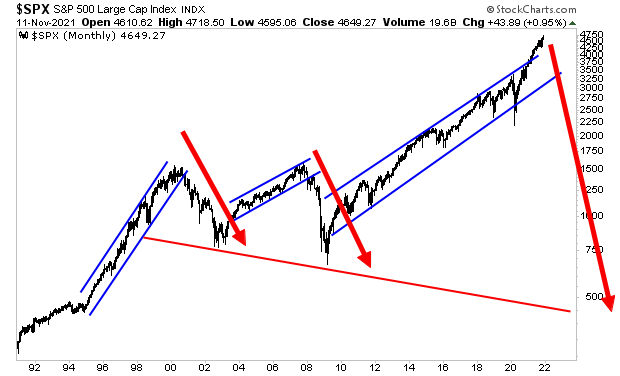
You can tell the whole thing is total BS based on the stock market alone. Notice how this latest bubble is so extreme it actually exploded out of an uptrend in ways that neither the Tech Bubble nor the Housing Bubble ever did?
That’s why the Fed is so terrified of normalizing monetary policy. Because it threw the kitchen sink at the financial system to create this bubble.
So what happens when the bubble bursts as all bubbles do? $250 billion in QE per month? $500 billion in QE per month?
At the end of the day, this is coming whether the Fed wants it or not. It’s just a matter of when.
The big question for investors is… HOW DO WE AVOID THIS?
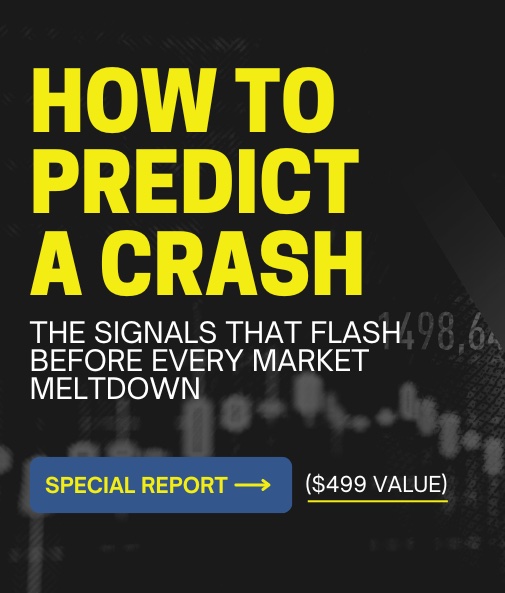
To figure this out, I rely on certain key signals that flash before every market crash.
I detail them, along with what they’re currently saying about the market today in a Special Investment Report How to Predict a Crash.
To pick up a free copy, swing by
https://phoenixcapitalmarketing.com/predictcrash.html
Best Regards