By Graham Summers, MBA
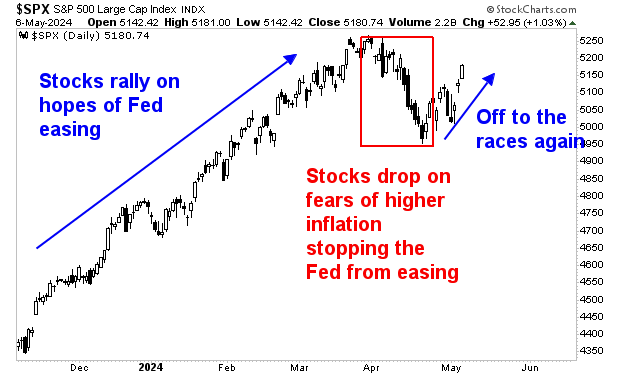
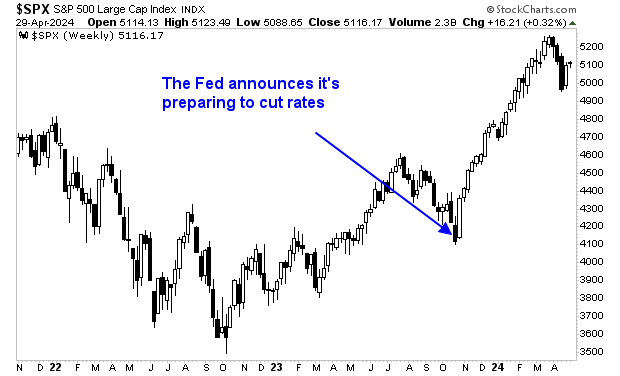
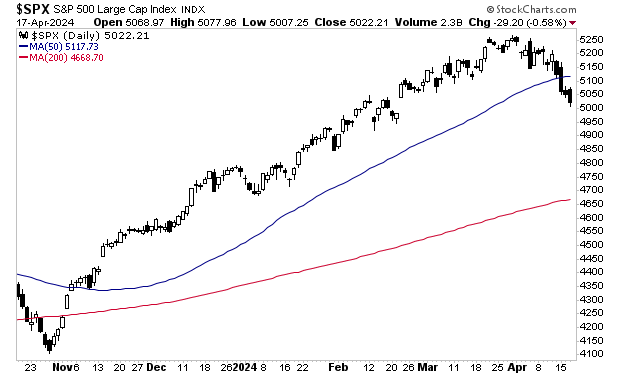
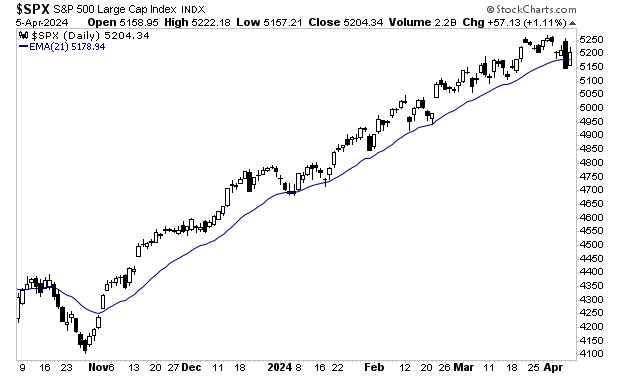
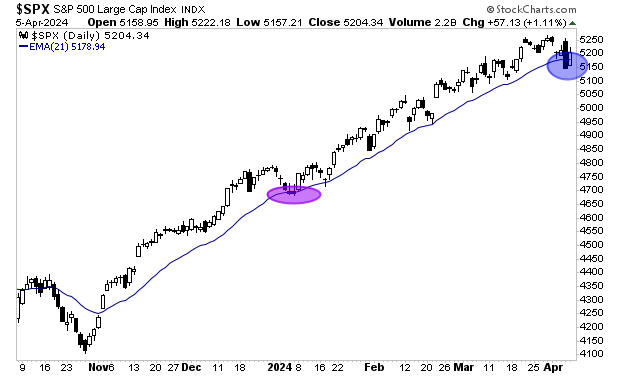
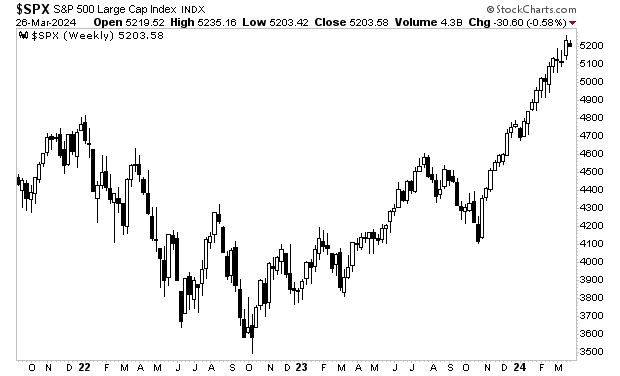
Stocks hit new all time highs last week.
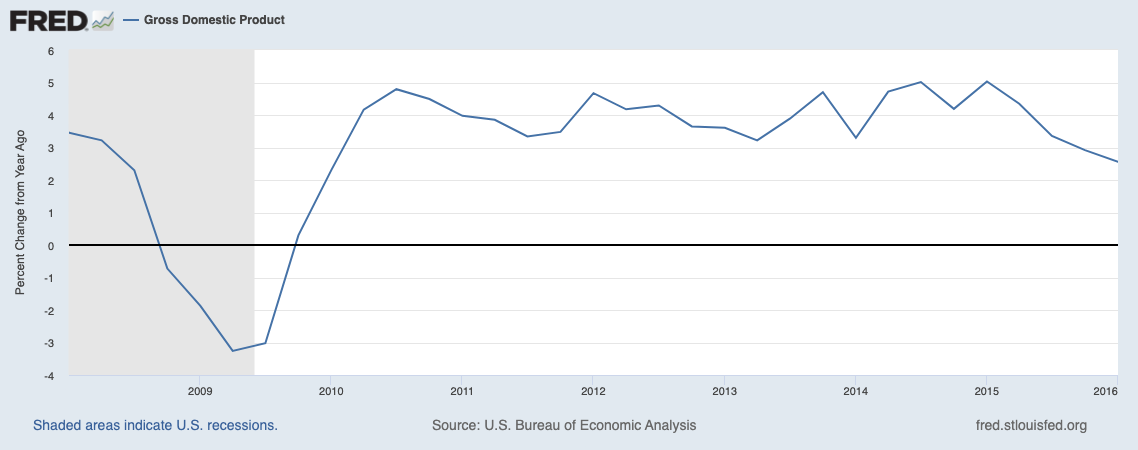
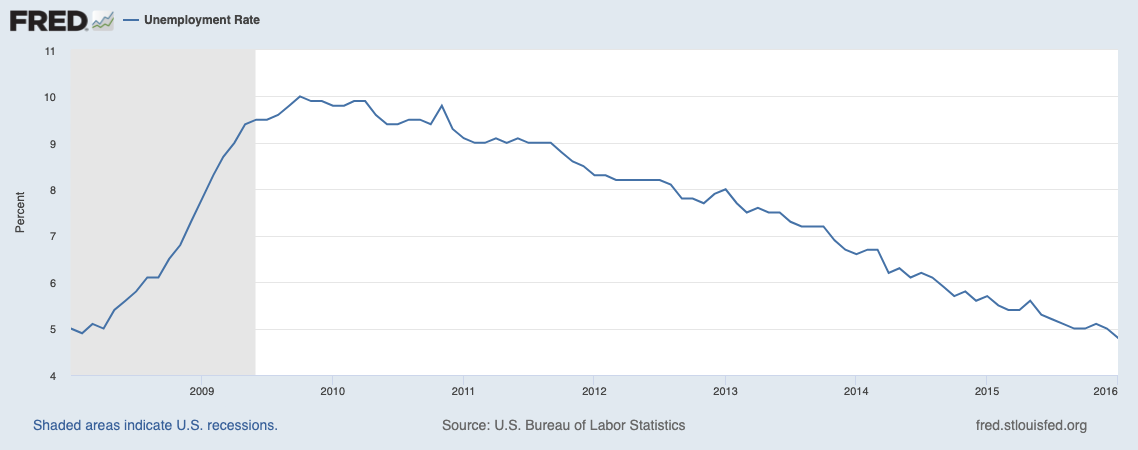
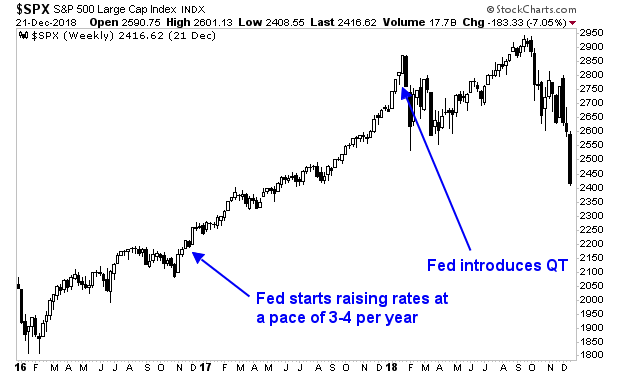
The reasoning here is quite simple: the economy is growing and the Fed has signaled it will start easing rates soon.
This is something of a goldilocks scenario. After all, what is a better environment for stocks than a growing economy (which means rising earnings) and lower rates (which mean investors paying a higher multiple for stocks’ higher rates of growth).
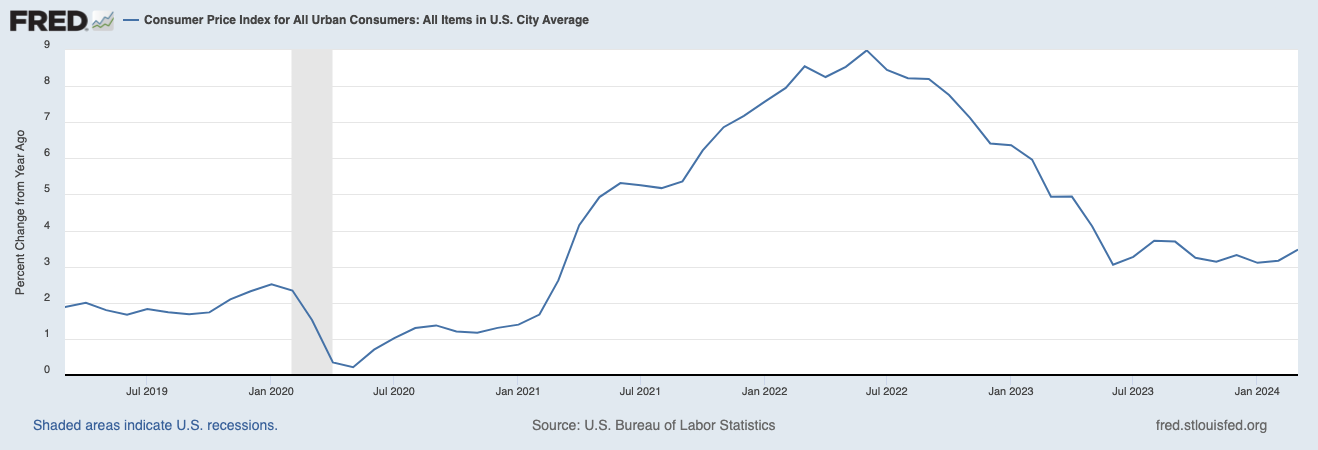
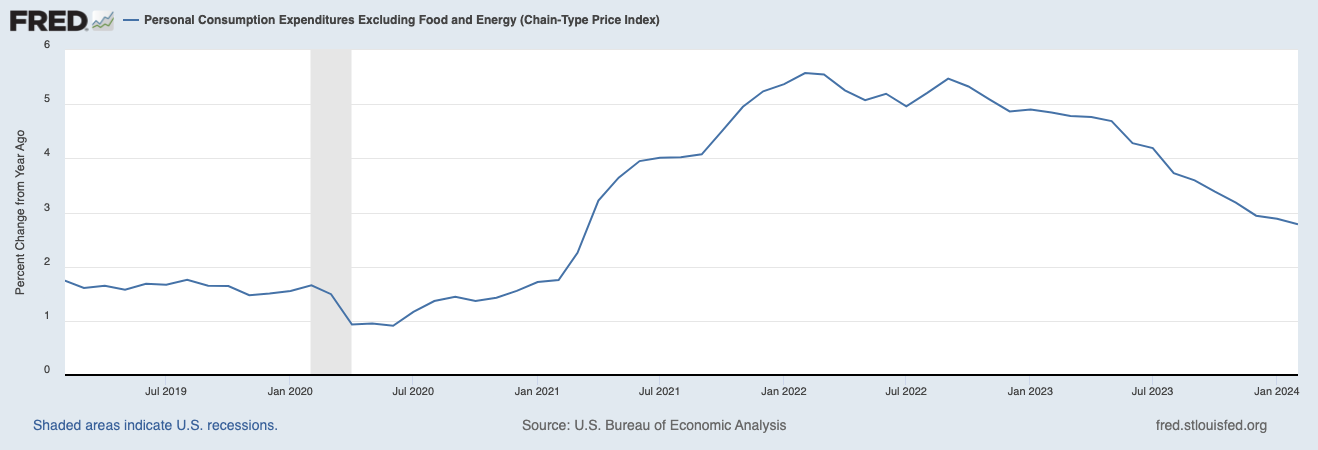
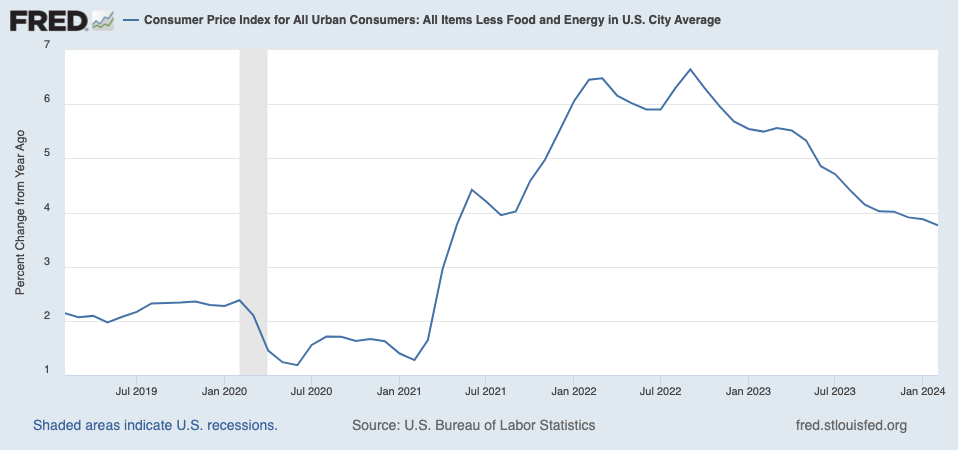
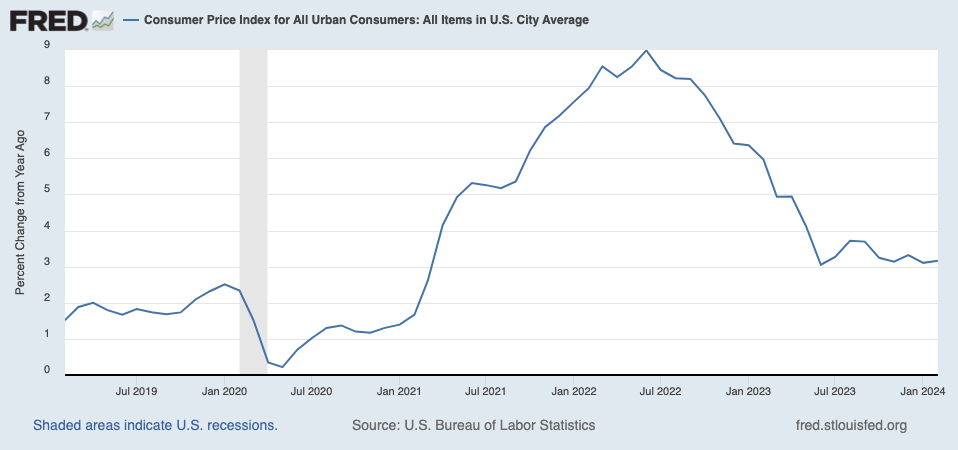
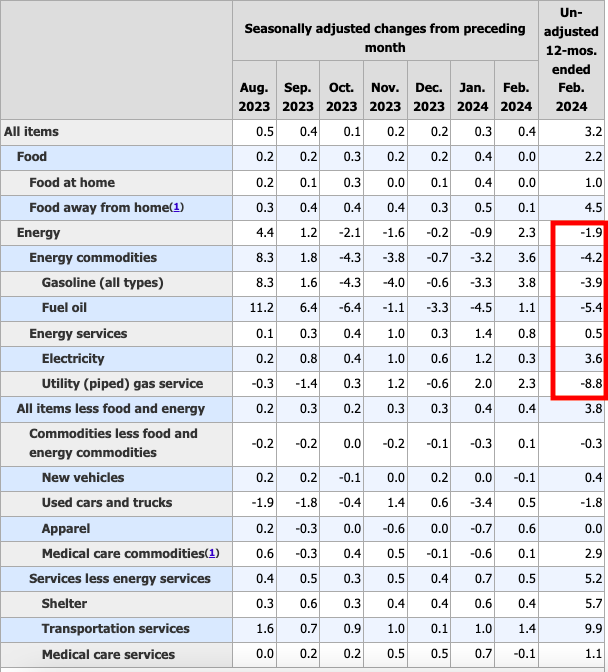
But what about the conflict in the Middle East, stocks being overvalued, inflation potentially turning back up, AI being in a bubble, and the dozens of other potential issues the market faces today?
There are ALWAYS problems in the world. And there are ALWAYS a multitude of things that can go wrong with the economy or the stock market. But until any one of those things becomes a big enough problem for the stock market to react… they remain hypotheticals.
I realize that sounds ludicrous, but think about your own health. The human body is comprised of ~36 trillion cells, 206 bones, 78 organs, and 11 organ systems.
The potential for something to go wrong is so large it’s incomprehensible. And yet, most days, we get up and function just fine. But if we sat down and chose to focus on the potential of something going wrong… we could easily convince ourselves that we were on the verge of a serious illness or worse.
The stock market is similar. There’s tremendous potential for something to go wrong… but we’re talking about potential not reality. Many of the potential issues never even materialize or if they do, they prove to be overblown as far as stocks are concerned.
This is why sophisticated investors don’t fret and panic about stocks every day. I’m not saying they don’t employ careful risk management protocols… but until a problem actually appears and becomes significant enough to impact stocks… they focus on MAKING MONEY, not worrying.
The end result is that while everyone else frets and worries, these people are growing their portfolios. The good news is that with the right guidance, you could EASILY do the same.
And if you’re looking for someone to guide your investments to insure you profit from it, I’m your guy.
Since 2015, subscribers of my Private Wealth Advisory have maintained a win rate of 74%.
Yes, we made money on three out of every four trades we closed… for EIGHT YEARS STRAIGHT!
And I believe 2024 is going to be our best year yet! We’ve already locked in gains of 10%, 15%, 27%, 30% and 67%… and the year isn’t even half over!
To join us in turning the markets into a source of life-changing profits, all you NEED to do is take out a 30-day $3.99 trial subscription to Private Wealth Advisory.
A full SIX (6) MONTH subscription to Private Wealth Advisory includes:

This is a HECK of a lot of value for just $3.99.
Indeed, the book alone is worth $9.99 and you’re getting FREE shipping on it!
Don’t delay, this trial offer will end soon! And by then, you’ll have missed out on our latest winning trades!
Graham Summers, MBA
Chief Market Strategist
Phoenix Capital Research