The world is lurching towards another Crash.
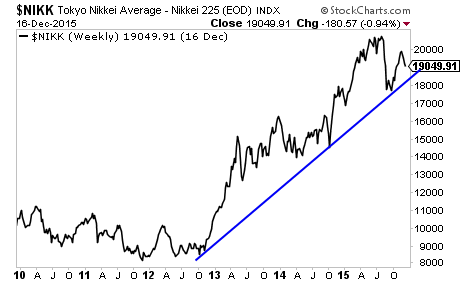
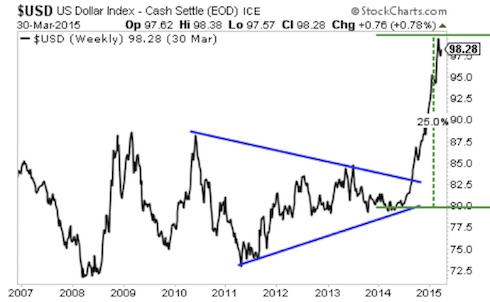
Japan, which has been ground zero for Keynesian insanity, is back in technical recession. This comes after the Bank of Japan launched the single largest QE program in history: a QE program equal to 25% of GDP launched in April 2013.
This program bought an uptick in economic growth for just six months before Japan’s GDP growth rolled over again. Similarly, an expansion of QE in October 2014 pulled Japan back from the brink, but GDP growth collapsed again soon after, plunging the country into technical recession earlier this year.

Japan is completely insolvent. The country has no choice but to continue to implement QE or else it will go crash in a matter of months. However, with the Bank of Japan already monetizing ALL of the country’s debt issuance, the question arises, “just what else can it buy?”
We’ll find out in 2016. But Japan is now officially in the End Game from Central Banking.
Europe is not far behind.
———————————————————————–
The Single Best Options Trading Service on the Planet
Our options service THE CRISIS TRADER is absolutely KILLING it.
We have a success rate of 72% meaning we make money on more than seven out of 10 trades.
Even if you include ALL of our losers, we are up 35% year to date.
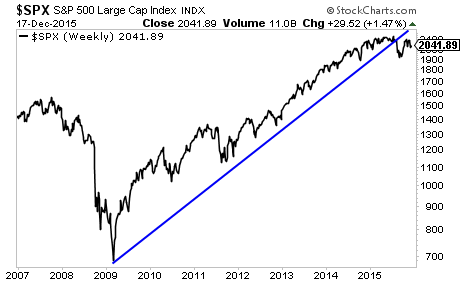
Over the same time period, the S&P 500 is 0%.
That’s correct, with minimal risk, we are outperforming the S&P 500 by 35%… and the year isn’t even over yet! Heck, we just closed out another 30% winner yesterday!
Our next goes out tomorrow morning… you can get it and THREE others for just 99 cents.
To take out a $0.99, 30 day trial subscription to THE CRISIS TRADER…
———————————————————————–
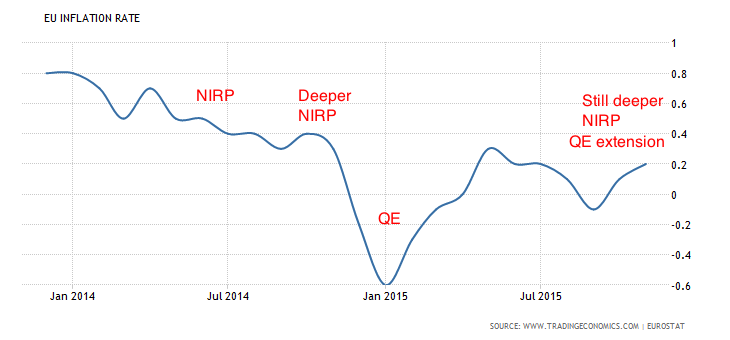
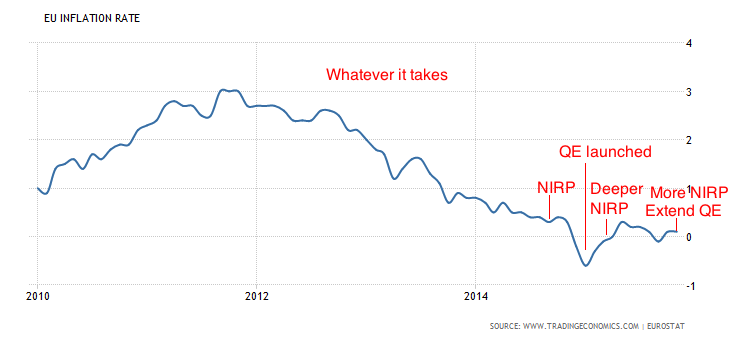
The ECB has cut interest rates to negative, cut them further into negative, launched a QE program, and then cut interest rates even further into negative while extending its QE program.
EU GDP growth has flat-lined at barely positive.
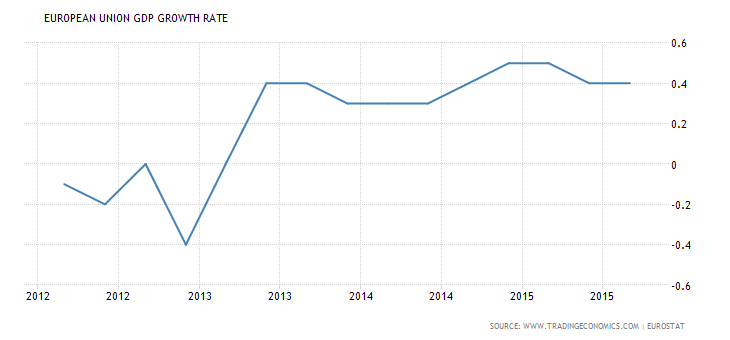
But the economy is having serious difficulty fending off deflation.
When your ENTIRE banking system is leveraged by 26 to 1, as is Europe’s, even a 4% drop in asset values renders the system insolvent. Without significant inflation, the EU’s banking system will crash.

ECB President Draghi better have more in his bazooka that what he’s fired so far, or the EU’s $46 trillion banking system will crash. However, as is the case with the Bank of Japan, the ECB is facing a shortage of viable assets to buy.
Between these two banking systems alone, you’ve got the makings of a global financial crisis at least on par with 2008. Both countries are sinking into deflation at a time when their respective Central Banks have little if any ammo left.
If you’re an investor who wants to increase your wealth dramatically, then you NEED to take out a trial subscription to our paid premium investment newsletter Private Wealth Advisory.
Private Wealth Advisory is a WEEKLY investment newsletter with an incredible track record.
To whit, we just closed out two new double digit winners yesterday, bringing us to 40 straight winning trades over the last 12 months.
That correct, during the last year, we’ve not closed a SINGLE LOSER.
And if you go back further, 46 of our last 47 trades have made money.
In fact, I’m so confident in my ability to pick winning investments that I’ll give you 30 days to try out Private Wealth Advisory for just 98 CENTS.
During that time, you’ll receive over 50 pages of content… along with investment ideas that will help make you money… ideas you won’t hear about anywhere else.
If you have not seen significant returns from Private Wealth Advisory during those 30 day, just drop us a line and we’ll cancel your subscription with no additional charges.
All the reports you download are yours to keep, free of charge.
To take out a $0.98, 30-day trial subscription to Private Wealth Advisory…
Best Regards
Graham Summers
Chief Market Strategist
Phoenix Capital Research