The longer I’m in this business, the clearer it becomes that no one actually reads anymore. Everyone simply trumpets headlines, or retweets articles, without looking at the data.
The latest and most glaring example of this is the claim that “inflation has peaked.” Everywhere you look in the media (and on social media) people repeat this statement as if it is a fact.
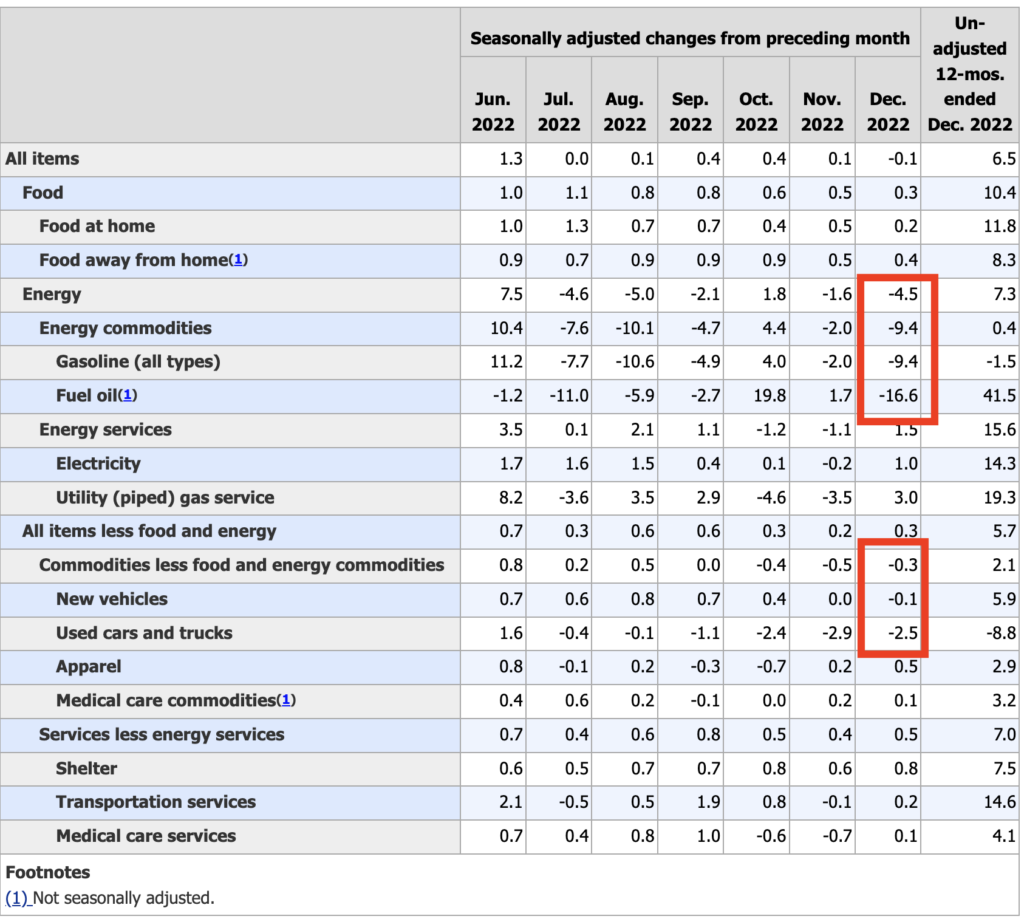
It is not. Inflation has not peaked. And the data confirms this.
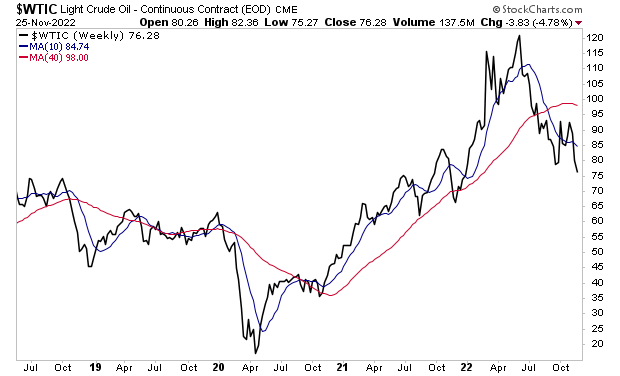
Almost ALL of the drop in inflation data has come from energy prices falling. And energy prices have fallen because the Biden administration dumped over 250 MILLION barrels of oil from the Strategic Petroleum Reserve (SPR).
To put this into perspective, it’s nearly 40% of the SPR. And the Biden admin dumped it in the span of less than two years. THAT is why energy prices dropped, which accounts for almost ALL of the drop in inflation data.
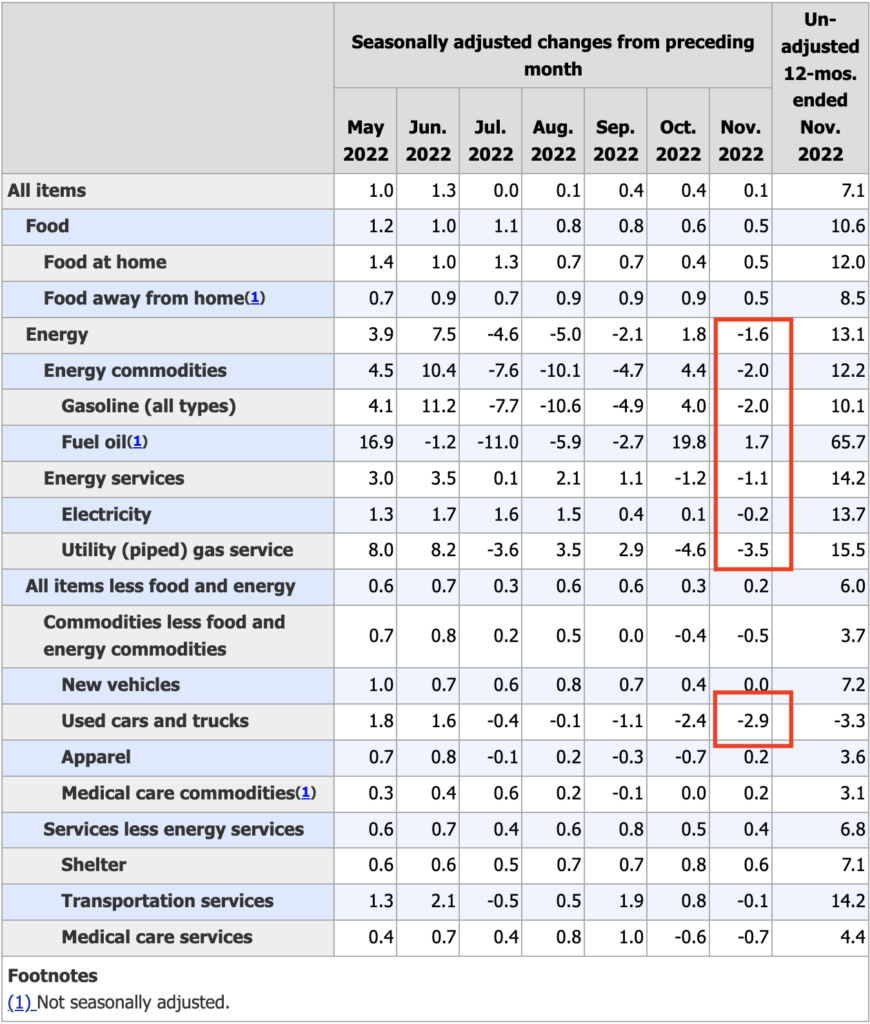
See for yourself. Outside of the drop in energy prices, the only significant drop in prices occurred in used car vehicles. Everything else is still RISING in price year over year.
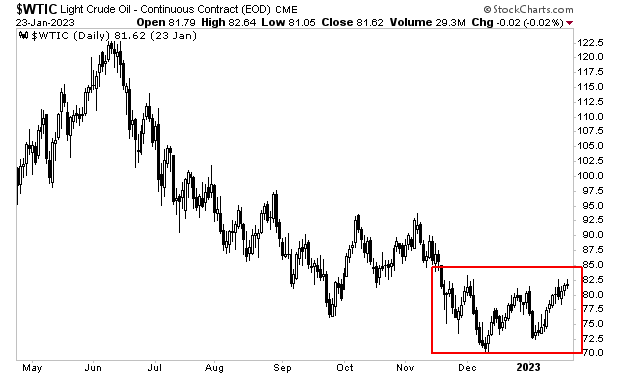
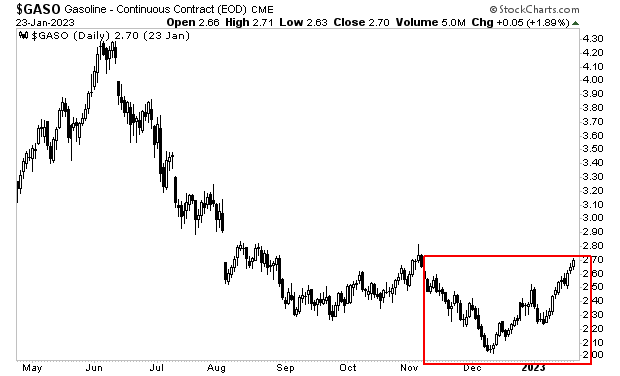
I bring all of this up because now that the Biden admin is no longer dumping tens of millions of barrels of oil on the open market, energy prices are bottoming.
Oil has bottomed and is starting to turn up.
The situation is even uglier for gasoline.
So, unless President Biden wants to empty the SPR to zero, this “inflation has peaked” narrative is over. Inflation is coming back in a big way. And NO ONE is positioned for it.
On that note, we published a Special Investment Report concerning FIVE secret investments you can use to make inflation pay you as it rips through the financial system in the months ahead.
The
report is titled Survive the Inflationary Storm. And it
explains in very simply terms how to make inflation PAY YOU.
We
made 100 copies available to the public.
Today
is the last day this report is available to the general public.
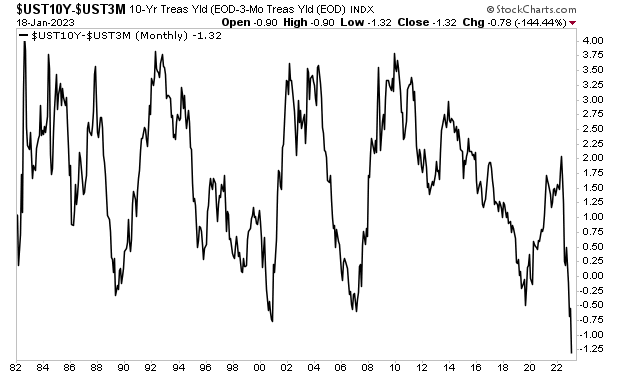
The data is finally beginning to register that a recession is at hand.
I’ve been forecasting that the U.S. economy was in recession back in November. Leading indicators and the bond market made this clear.
The yield curve has accurately predicted every recession since 1982. And it was SCREAMING that a recession was about to hit in the U.S. since mid-2022. As you can see in the chart below, the yield curve was more inverted than at any point in the last 40 years.
However, a big problem with economic forecasting is that most data sets are backwards looking. So often times you don’t get actual data telling you that a recession has arrived until the economy is already several months into the recession.
And the stock market pays attention to economic data, NOT leading indicators.
I mention all of this because the recession that I’ve seen unfolding since November is finally showing up in the economic data. Yesterday, the Commerce Department released a number of data series that were HIGHLY recessionary.
Retail Sales clocked in at -1.1% Month over Month. Similarly, Industrial Production came in at -0.7% Month Over Month while Manufacturing Production registered -1.3% Month Over Month.
Bear in mind, these are the data points for December. So, this is what was happening in the economy a month ago. And bear in mind, the Month Over Month numbers are a comparison between December and November. So, the downturn actually started more than seven weeks ago.
This is why stocks took it on the chin and bonds caught a bid yesterday. And judging by yesterday’s data, this process is just getting started.
And remember what happened to stocks during the last two major recessions in 2000 and 2007.
If you’ve yet to take steps to prepare for what’s coming, we just published a new exclusive special report How to Invest During This Bear Market.
It details the #1 investment to own during the bear market as well as how to invest to potentially generate life changing wealth when it ends.Paragraph
As I’ve outlined before, Japan is the grandfather of monetary policy insanity. The Fed first introduced Zero Interest Rate Policy (ZIRP) and Quantitative Easing (QE) in 2008.
The central bank of Japan, the Bank of Japan or BoJ introduced them in 1999 and 2001, respectively. And since that time, it’s NEVER been able to normalize monetary policy. Indeed, the longest the BoJ has even managed to tighten monetary conditions in 20+ years is a mere 14 months.
Put simply, Japan has been dealing with extraordinary monetary policy for an entire generation: 25 years. Along the way, the BoJ has launched:
1) Negative interest rate policy (NIRP), through which it charges lenders to lend it money.
2) A single QE program equal to 25% of Japan’s GDP (in 2013).
3) Unlimited QE in the form of yield control, through which it prints money and buys Japanese Government Bonds any time said bonds’ yields begin to rise above a certain level.
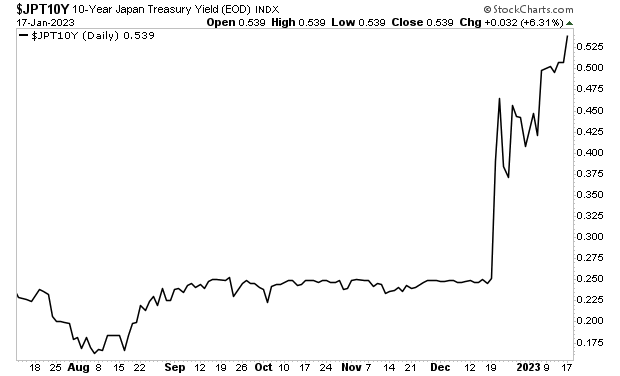
We are in the process of watching #3 blow up today.
Initially, the BoJ, wanted 10-Year Japanese Government Bond yields to remain at 0%. However, once inflation arrived, the BoJ found itself printing so much money to defend that level, that it was forced to raise its yield target to 0.5%.
And that’s when all hell broke loose. The bond market is repeatedly testing the BoJ’s resolve, with yields rising above 0.5% time and again. To counter this, the BoJ is being forced to launch previously unscheduled QE programs on a near daily basis.
Friday and Monday alone, the BoJ spent $78 BILLION. And bond yields STILL rose above its desired level of 0.5%.
Something is about to break here. The BoJ just announced that it won’t be changing its policy despite the obvious signs that it is losing control of its bond market.
Put another way: we’re about to find out what happens when a bond market breaks a major central bank. Think of the 2023 crisis for Italy and Spain… only with the world’s THIRD largest economy and third most used currency.
As I keep stating, the Great Crisis… the one to which 2008 was a warm-up, has finally arrived. In 2008 entire banks went bust. In 2023, entire countries will do so.
If you’ve yet to take steps to prepare for what’s coming, we just published a new exclusive special report How to Invest During This Bear Market.
It details the #1 investment to own during the bear market as well as how to invest to potentially generate life changing wealth when it ends.Paragraph
Japan’s central bank, the Bank of Japan, or BoJ, is beginning to lose control of its financial system.
The BoJ is the grandfather of monetary insanity. The U.S.’s Federal Reserve (the Fed) first introduced Zero Interest Rate Policy (ZIRP) and Quantitative Easing (QE) in 2008.
The BoJ introduced them in 1999 and 2001, respectively.
Since that time, the BoJ has NEVER been able to normalize monetary policy. The longest it managed to tighten financial conditions without having to reverse and start easing again was a measly 14 months.
So we’re talking about 20+ years of loose monetary policy or a slow-motion nationalization of Japan’s financial system. The BoJ has bought so many assets during this time that today it:
1) Owns more than half (50%) of all Japan Government Bonds outstanding.
2) Owns more Japanese stocks than any other entity (country or institution) in the world.
3) Is a top 10 shareholder in 40% of Japan’s publicly listed companies.
4) Has a balance sheet that is equal to 92% of Japan’s GDP.
Having spent 17 odd years printing money and buying assets with little success in creating economic growth, in 2016, the BoJ attempted a new kind of policy: Yield Curve Control (YCC).
In its simplest rendering, the BoJ stated that anytime the yields on Japanese Government Bonds rose above a certain level (0% for the 10-Year Government Bonds), the BoJ would print new money and use it to buy bonds until the yields fell back to the desired range.
This was an open-ended, unlimited form of QE. And the BoJ maintained it for six years straight until inflation finally appeared in the financial system.
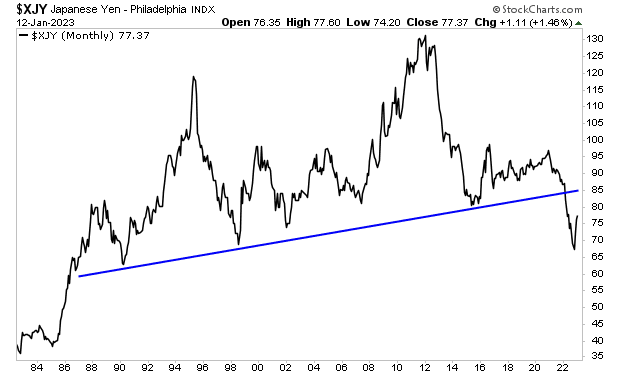
And that’s when things started to break: the Yen collapsed to a 35 year low.
At this point, the BoJ had a choice: defend its currency or continue defending its bonds.
The BoJ chose to defend the currency by RAISING the target yield for 10-Year Japanese Government Bonds from 0% to 0.5%. This was an implicit admission that it would print less money defending bonds. And it’s why the Yen began to rally in late 2022 (see the large bounce in the chart above).
Unfortunately, that’s the end of the good news. The bond market has begun testing the BoJ’s resolve, with the yields on Japanese Government Bonds rising above the BoJ’s target repeatedly. Things have begun to spiral out of control to the point that the BoJ is being forced to intervene on a near daily basis to try and stop the bond yields from soaring higher.
The BoJ is now in a corner. If it keeps printing money to defend bonds the Yen collapses making inflation worse. And if it doesn’t print money to defend bonds the bond yields soar and Japan becomes insolvent (unable to make debt payments).
As I keep stating, the Great Crisis… the one to which 2008 was a warm-up, has finally arrived. In 2008 entire banks went bust. In 2022, entire countries will do so.
If you’ve yet to take steps to prepare for what’s coming, we just published a new exclusive special report How to Invest During This Bear Market.
It details the #1 investment to own during the bear market as well as how to invest to potentially generate life changing wealth when it ends.
In 2022, the Everything Bubble burst courtesy of the inflation created by over $8 trillion in Fed and Federal government money printing.
As I outlined in my best-selling book, The Everything Bubble: the Endgame for Central Bank Policy, the Fed created the Everything Bubble when it attempted to corner the U.S. Treasury market in the aftermath of the Great Financial Crisis.
Treasuries are the bedrock of our current financial system, and their yields represent the “risk free” rate of return against which all risk assets (stocks, bonds, real estate, etc.) are priced. So, when the Fed created a bubble in Treasuries via Zero Interest rate Policy (ZIRP) Quantitative Easing (QE), it ended up creating a bubble in EVERYTHING.
So, it’s no small irony that the Fed and its absurd money printing from 2020-2021 was what unleashed inflation, which burst this bubble. You see, Treasury yields don’t just trade based on Fed intervention. They also trade based on economic growth as well as inflation.
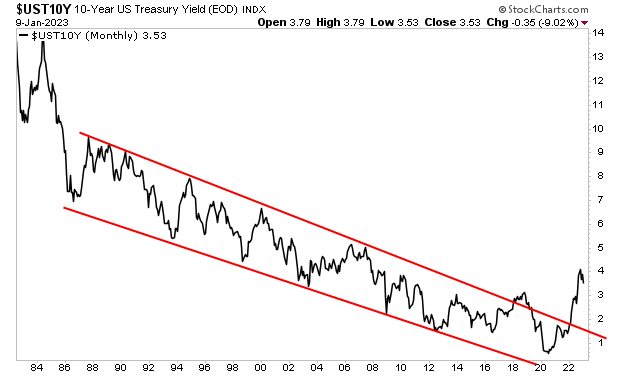
So once inflation ignited in 2021, U.S. treasury yields broke out of their 35+ year downtrend.
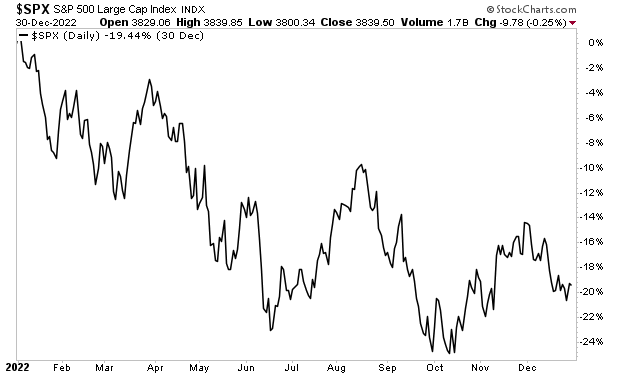
Remember, when I wrote that the yields on these bonds represent the “risk free” rate of return against which all risk assets, including stocks, are valued? Once Treasury yields started rising, stocks were soon repriced much lower to account for this. The S&P 500 ended 2022 DOWN 19%, making it the seventh worst year for stocks since 1920.
Which brings us to today.
The single most common question my clients are asking is if “the worst is over” for this bear market.
To answer that, we need to determine the answers to two other questions:
1) Has the Fed managed to kill inflation?
2) Will the U.S. economy experience a soft landing as opposed to a severe recession?
I’ll delve into those tomorrow. In the meantime if you’ve yet to take steps to prepare for what’s coming, we just published a new exclusive special report How to Invest During This Bear Market.
It details the #1 investment to own during the bear market as well as how to invest to potentially generate life changing wealth when it ends.
Investors should be praying for a stock market crash.
From a systemic perspective, the markets have entered a period of “risk off”. This has been the case since March of 2022. And the single best thing for investors would be for the markets to get this situation over with quickly via a crash.
Yes, I am fully aware that crashes are extremely painful and involve investors losing a lot of money. However, when the markets crash, they also bottom quickly, which means the pain is over FAST.
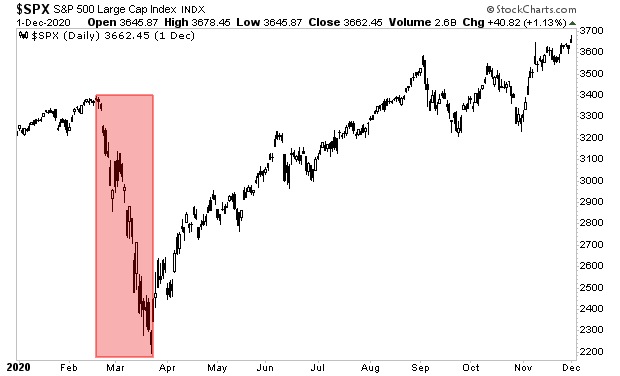
Consider the 2020 Crash: the entire collapse was over in about five weeks. And stocks had already begun to recover much of their losses within a few months. In fact, within six months they were at new all-time highs!
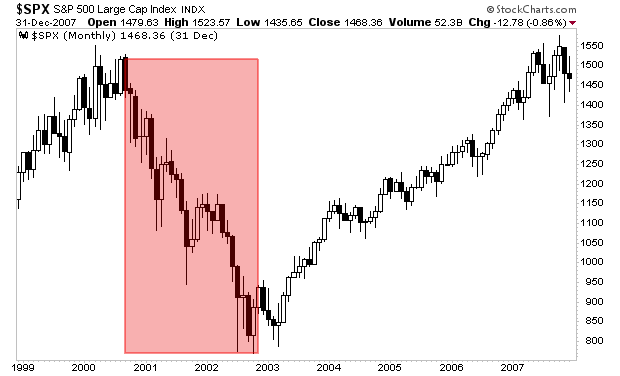
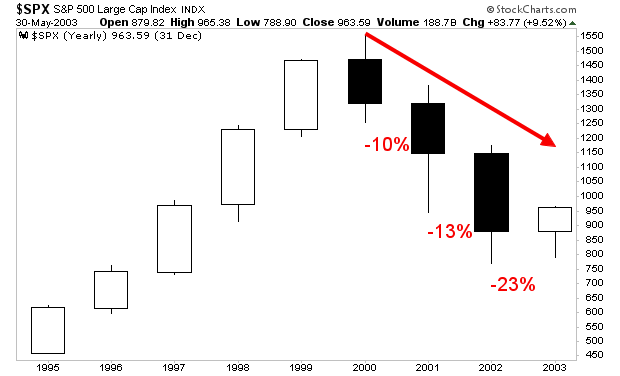
Now compare that to the Bear Market of 2000-2002.
That collapse took over TWO YEARS to complete. Not months… YEARS. Peak to trough the S&P 500 lost 50%. And on a yearly basis the losses were actually worse with each successive year. The market lost 10% in 2000, 13% in 2001, and 23% in 2002.
Worst of all, it took the S&P 500 FIVE years to recoup its losses. Investors lost money for years and then had to wait half a decade to make those losses back.
So again, the best thing for investors would be for the markets to crash soon. A crash would mean the pain would be over quickly and stocks could bottom.
Unfortunately, I don’t think that is going to be the case.
I’ll explain why in tomorrow’s article… however, in the meantime if you’ve yet to take steps to prepare for what’s coming, we just published a new exclusive special report How to Invest During This Bear Market.
It details the #1 investment to own during the bear market as well as how to invest to potentially generate life changing wealth when it ends.
In 2014, I coined the term “the Everything Bubble” to describe the Fed’s insane monetary policies. By quick way of review, after the Great Financial Crisis of 2008, the Fed created a bubble in U.S. sovereign bonds, also called Treasuries.
The Fed did this by cutting interest rates to zero and introducing large-scale Quantitative Easing (QE) programs to the tune of $3.5 trillion. The end result was that the entire Treasury curve was repriced at extraordinarily low levels of risk.
Because these bonds are the bedrock of our current financial system, and their yields represent the “risk free” rate of return against which all risk assets (stocks, bonds, real estate, etc.) are priced, when the Fed created a bubble in Treasuries, it ended up creating a bubble in EVERYTHING.
This is why I coined the term “the Everything Bubble.” And in 2017 I published a best-selling book by the same name (The Everything Bubble: The Endgame For Central Bank Policy), explaining what the Fed was doing and what the final outcome would be.
That outcome?
That the Everything Bubble would burst, just like the Tech bubble of the 1990s and the Housing Bubble of the ‘00s. And when this happened, it would bring about the worst financial crisis of our lifetimes.
That process has now begun. Last year, 2022, was one of the worst years for the financial system in history.
It was literally the worst year for bonds on record, with bonds losing anywhere from 4% to 22% depending on the duration of bonds you owned.
The situation wasn’t much better for stocks. The S&P 500 finished the year down 18%, making it the seventh worst year running back to 1920. The only years during which stocks performed worse than this were during the during major financial crises or during a severe recession/ depression.
And unfortunately, this is just the beginning.
Unlike the Great Financial Crisis or the collapse of 2020, this process will NOT be quick. The reason is quite simple: during those situations the Fed was able to introduce extraordinary monetary policy to cushion the collapse.
This time it cannot.
The entire reason the Everything Bubble burst was because the Fed maintained its emergency level monetary policies for far too long. The recession of 2020 supposedly ended in May of that year, but the Fed printed $2.6 TRILLION after this, while also keeping interest rates at zero.
The Fed wasn’t the only one. Between multiple Stimulus programs and as well as socialist schemes disguised as infrastructure/ fiscal stimulus, the U.S. government has spent over $8 TRILLION in the last 34 months.
The end result is that inflation has arrived in the financial system. And the Fed CANNOT try to “cushion” this situation because more money printing/ easing is only going to make things worse.
Put another way, this crisis is going to take longer, and get much worse than anyone expects. It’s quite possible stocks don’t bottom until 2024… at levels most investors can’t even imagine.
The time to prepare for this is NOW. During the bear market of 2000-2003, things actually got worse each successive year with stocks losing 10% in 2000, 13% in 2001, and 23% in 2002.
I believe something similar will happen this time around
If you’ve yet to take steps to prepare for this crisis, we just published a new exclusive special report How to Invest During This Bear Market.
It details the #1 investment to own during the bear market as well as how to invest to potentially generate life changing wealth when it ends.
Over the last 25 years, the financial system has been in what I call the “era of serial bubbles”: a time in which central banks create asset bubbles, said asset bubbles burst, and central banks respond by creating another, larger bubble in a more systemically important asset class.
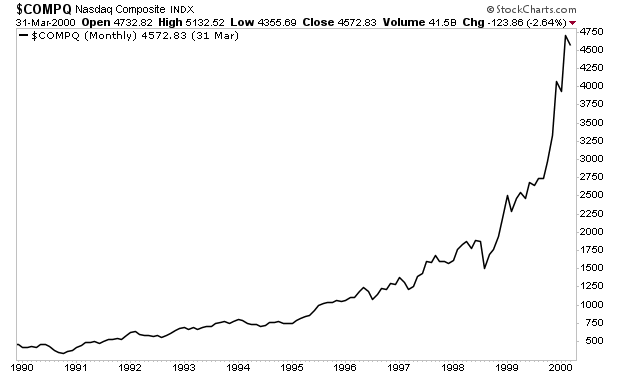
The first primary bubble was the Tech Bubble of the late 1990s. While that bubble was isolated to a particular sector in a particular asset class (Tech Stocks), it was egregious in scope. A third grader could have looked at a chart of the NASDAQ and told you the situation wouldn’t end well.
When that bubble burst, the Fed opted to create another bubble by employing extraordinary monetary policies. Specifically, the Fed kept interest rates too low for too long, essentially making credit free. And because congress passed legislation that lowered lending standards to potential homeowners, the subsequent bubble took place in real estate: a much larger, systemically important asset class.
However, this time around, the bubble became truly global in scope, courtesy of Wall Street derivatives that the Fed ignored/ refused to regulate. In simple terms, Wall Street packaged up garbage mortgages into “assets” that were sold to everyone from hedge funds to pension funds, banks and more. In this manner, toxic mortgages in Florida, Las Vegas, etc. ended up on the balance sheets of everyone from Japanese banks to Spanish hedge funds.
So, when the housing bubble burst, all of these assets had to be revalued at much lower values… resulting in the global banking system imploding during the Great Financial Crisis of 2008.
What did the Fed do to address this situation?
It attempted to corner/ create a bubble in U.S. sovereign bonds, also called Treasuries.
These are the senior most asset class in the world. These bonds act as the bedrock of our current financial system, with their yields representing the “risk free” rate of return against which all assets (stocks, bonds, real estate, etc.) are valued.
Put simply, when the Fed created a bubble in these bonds it was actually creating a bubble in EVERYTHING, because ALL asset classes would eventually be repriced based on Treasuries were doing.
This is why I coined the term “the Everything Bubble” in 2014.
And that bubble has now burst.
The yield on the all-important 10-year U.S. Treasury has broken its 35 year down trend. The era of Serial Bubbles is over. And there is nothing the Fed can do to fix this situation.
After all, what can it do? There isn’t a larger more systemically important asset class the Fed could use to create another bubble. And introducing more extraordinary monetary policy would make the situation worse.
What does this mean?
The Great Crisis of our lifetimes is finally here.
I’ll detail what’s coming for the markets in tomorrow’s article. In the meantime, if you’ve yet to take steps to prepare for this crisis, we just published a new exclusive special report How to Invest During This Bear Market.
It details the #1 investment to own during the bear market as well as how to invest to potentially generate life changing wealth when it ends.
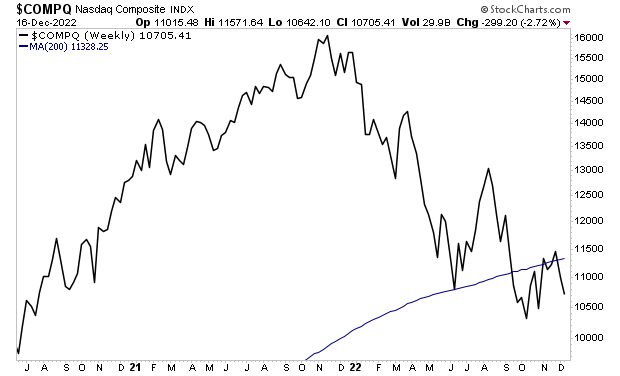
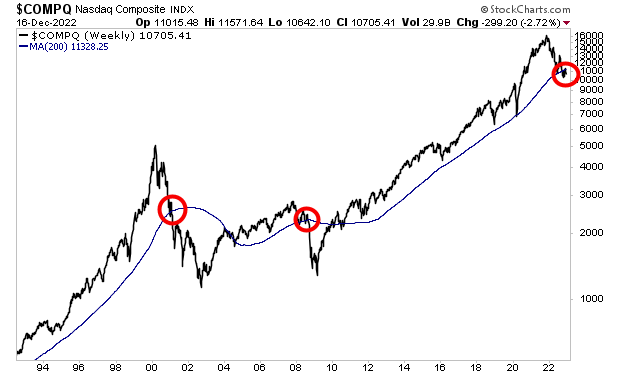
Something MAJOR happened last week for Tech Stocks.
That something?
The NASDAQ failed to reclaim its 200-week moving average (WMA).
See for yourself.
Why does this matter?
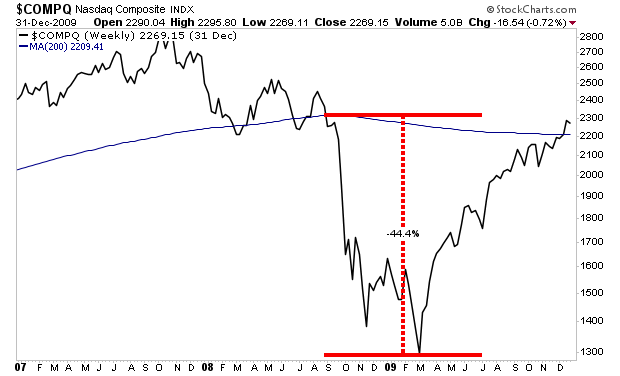
The NASDAQ has only lost its 200-WMA two other times in the last 30 years. Both of these instances (2001 and 2008) were during major bear markets that saw stocks lose an additional 44%-55% of their total value.
I’ve illustrated them in the chart below with red circles. Note that even during the 2020 crash, stocks managed to hold this line.
Not this time.
There is a small chance the bulls might be able to rally here and stop a full-scale collapse. But the clock is ticking.
If they don’t, consider that after the NASDAQ lost its 200-WMA in 2001, stocks lost another 55% in value.
In 2008, when they lost this line, stocks lost another 44%.
Suffice to say, a lot is at stake here. And as I said before… the clock is ticking.
If you’ve yet to take steps to prepare for the next leg down in the markets, we just published a new exclusive special report How to Invest During This Bear Market.
It details the #1 investment to own during the bear market as well as how to invest to potentially generate life changing wealth when it ends.
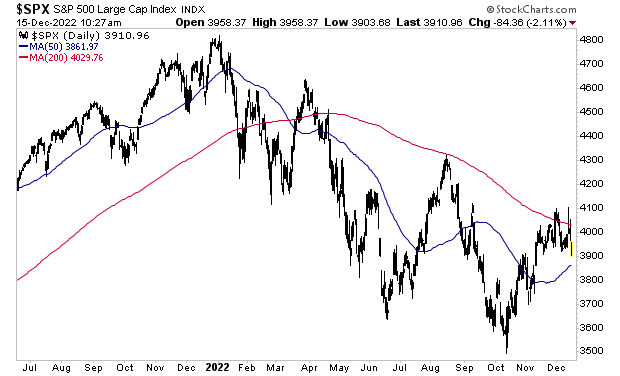
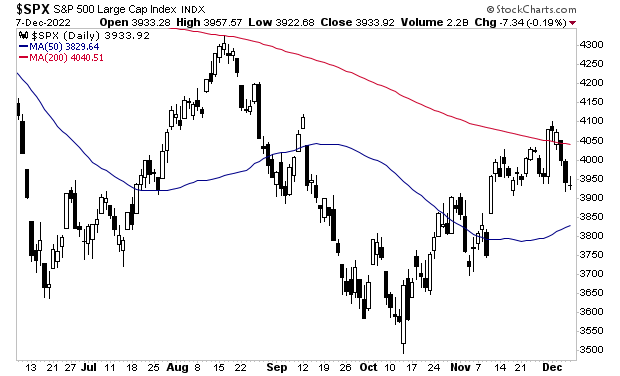
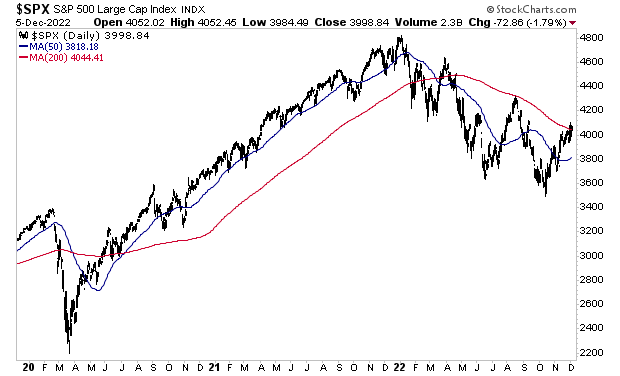
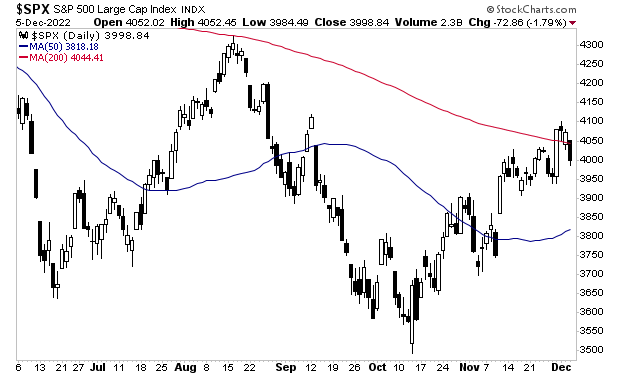
The big news this week is that stocks lost their 200-Day Moving Average (DMA) again.
Historically, November and December are two of the most bullish months for stocks. Only April is better from a single month perspective. So, the fact the market was unable to reclaim its 200-DMA and remain there is EXTREMELY bearish.
The price action was feeble to say the least.
The bulls have everything going for them: the Fed has reduced the pace of its interest rate hikes, the economy is not yet in recession, and we are in one of the best months for stock market returns: the famed Santa Rally of December.
So the fact that the bulls were unable to get stocks above their 200-DMA indicates that this recent market rally was nothing more than a Bear Market Rally, NOT the start of a new Bull Market.
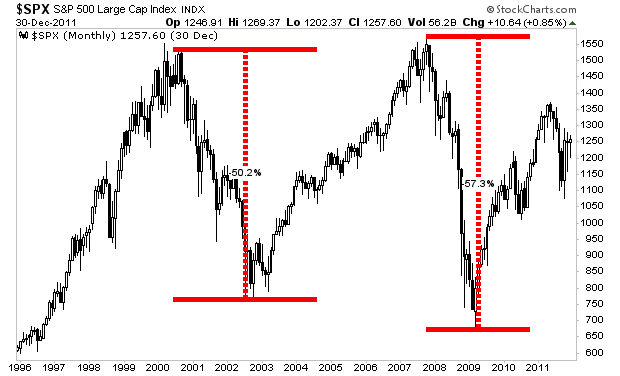
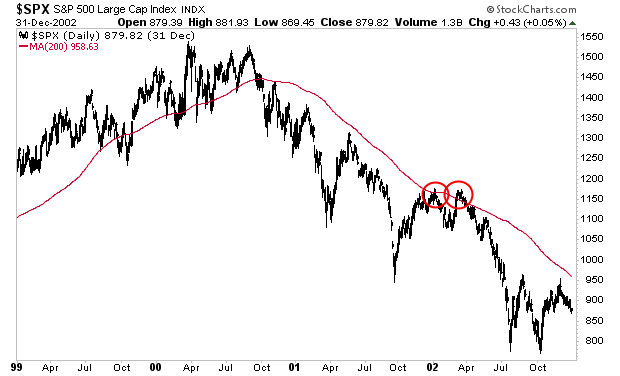
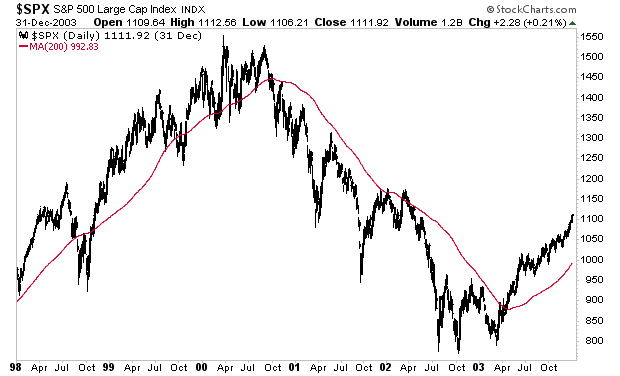
Below is a chart of what happened to stocks when they failed to maintain their 200-DMA during the Bear Market of 2000-2003. I’ve highlighted this in red circles. Stocks dropped another 30%.
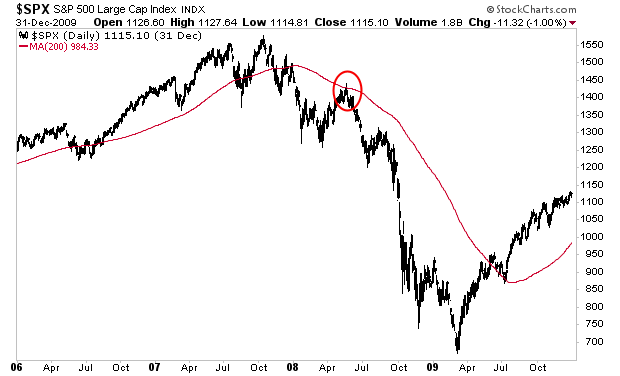
Here’s the same item during the bear market of 2007-2009. This time around stocks lost 50%.
Unfortunately for anyone who is buying into this narrative that stocks are in a new bull market, the bear market is NOT over. With a recession just around the corner, stocks will soon collapse to new lows.
If you’ve yet to take steps to prepare for this, we just published a new exclusive special report How to Invest During This Bear Market.Paragraph
It details the #1 investment to own during the bear market as well as how to invest to potentially generate life changing wealth when it ends.
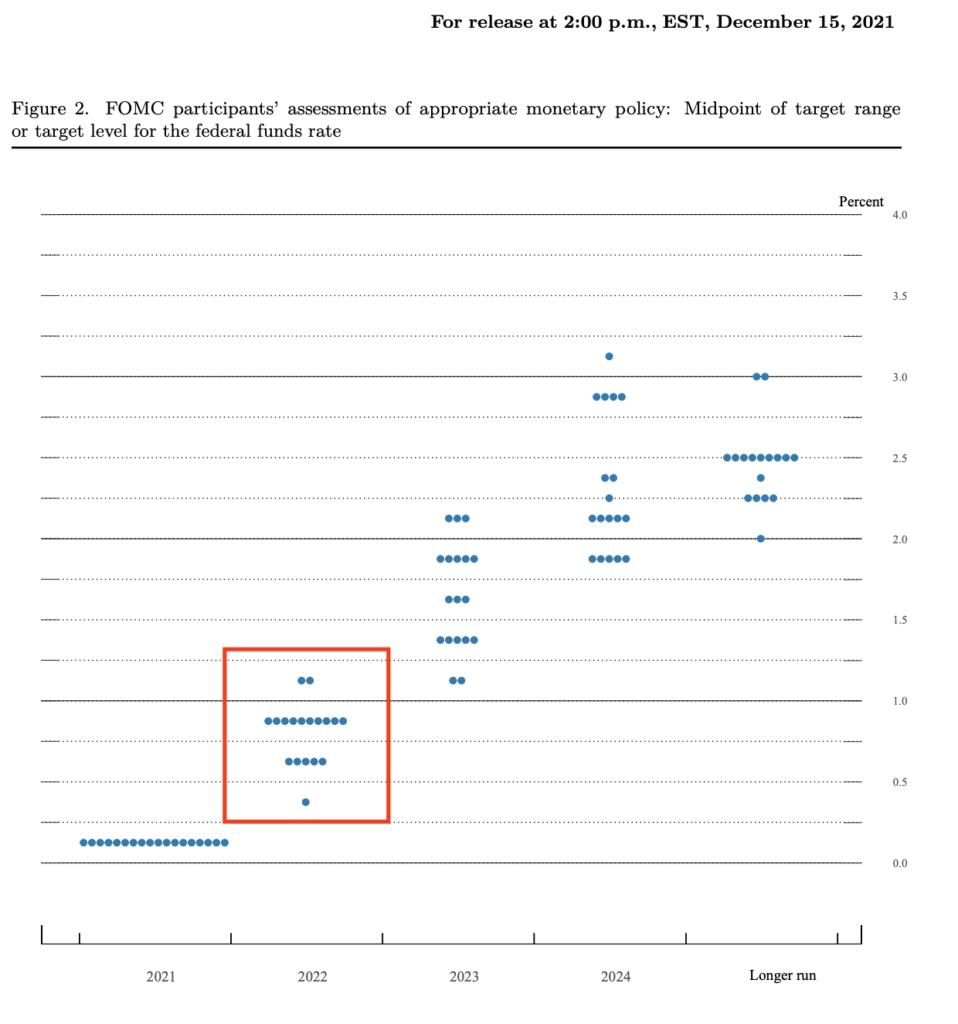
The Fed will end its two-day Federal Open Market Committee (FOMC) meeting today at 2PM East Standard Time.
The known universe expects the Fed to raise rates by 0.5%. And the current consensus is that by this time next year, inflation will be down near 2%.
It’d be hilarious if it didn’t involve so much suffering.
To understand what I mean by this, let’s wind the clocks back a year to the Fed’s December 15th 2021, FOMC meeting. At that time, the Fed had only just decided that inflation was NOT “transitory.”
Bear in mind, inflation has measured by the Consumer Price Index (CPI) had cleared 5% in June of 2021. It had since increased to over 7% as of December 2021.
Despite this, the Fed had yet to raise rates or end its Quantitative Easing (QE) program: the Fed Funds Rate was at 0.25% and QE was around $105 billion per month.
Again, inflation was over 7%, the Fed Funds rate was 0.25% and QE was still over $100 billion per month. So, what did the Fed, with its army of economics PhDs and analysts predict would happen once the Fed started tightening monetary conditions in 2022?
The Fed’s official forecast for 2022 was that rates would be somewhere between 0.5% and 1%.
That is correct. With inflation over 7% and rates at 0.25% in December 2021, Fed officials predicted that one year later rates would be somewhere around 0.5%-1%. In fact, even the most HAWKISH Fed officials only saw rates around 1.25% in December 2022.
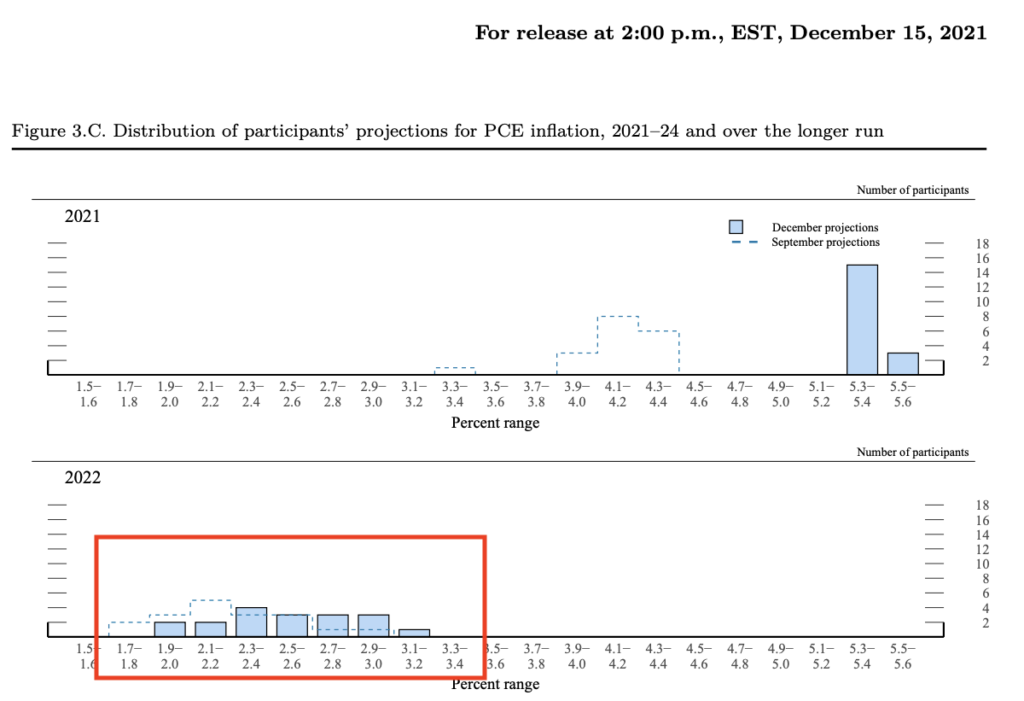
Don’t believe me? Here’s the dot plot from the December 2021 meeting.
Fast forward to today… and rates are at 4.5%. The Fed was not even in the ballpark.
But wait… it gets better.
Back in December 2021, the Fed also predicted where inflation, as measured by the Personal Consumption Expenditures (PCE) index would be a year later.
That prediction?
That PCE would be somewhere between 1.9% and 3% in 2022. In fact, the absolute worst case scenario Fed officials forecast for inflation in 2022 was 3.1%-3.2%.
See for yourself.
Fast forward to today and Personal Consumption Expenditures (PCE) inflation is 6%… or roughly DOUBLE the Fed’s WORST prediction.
I bring all of this up because the current consensus is that inflation has peaked, the Fed won’t need to be much more aggressive going forward, and that this time next year, inflation will have fallen back to the Fed’s target of 2%.
Good luck with that!
Unfortunately for anyone who is buying into this narrative today, the bear market is NOT over. With a recession just around the corner, stocks will soon collapse to new lows. And that’s even assuming that inflation DOES drop to 2% next year (it won’t).
If you’ve yet to take steps to prepare for this, we just published a new exclusive special report How to Invest During This Bear Market.Paragraph
It details the #1 investment to own during the bear market as well as how to invest to potentially generate life changing wealth when it ends.
The markets have reached a new level of stupidity.
Stocks are exploding higher based on inflation coming in at 7.1% Year over Year. This is apparently great news because Wall Street expected the number to be somewhere between 7.2% and 7.6%.
So, according to those buying stocks today, a 0.1% “beat” on an inflation number that is still north of 7% despite the Fed implementing its most aggressive rate hike cycle in 40 years in is a reason to panic bid stocks higher.
Looking through the numbers, almost the entire drop came courtesy of falling energy prices and used cars. I might add that the drop in energy is not surprising given that the Biden administration drained the Strategic Petroleum Reserve (SPR) by ~180 million barrels of oil. Practically everything outside of energy and used car prices is still rising.
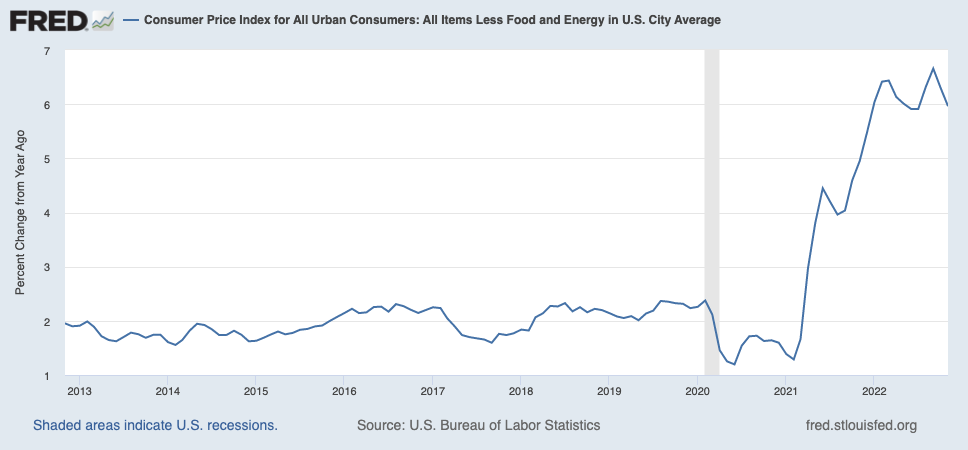
Elsewhere in the report, core inflation, which the Fed looks at closely is still at 6%. Sure, it’s not spiking any higher, but this it’s not coming down much either. Again, this is good in a way, but is it a reason to panic buy stocks like inflation is gone? I don’t think so.
Unfortunately for those who are panic buying stocks today, the bear market is NOT over. With a recession just around the corner, stocks will soon collapse to new lows.
If you’ve yet to take
steps to prepare for this, we just published a new exclusive special
report How to Invest During This Bear Market.
It details the #1
investment to own during the bear market as well as how to invest to potentially
generate life changing wealth when
it ends.
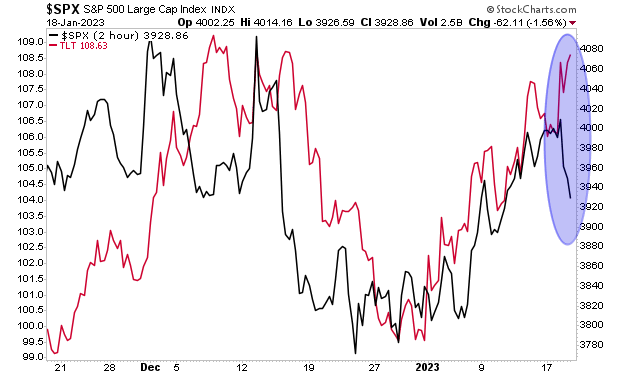
As I warned earlier this week, stocks have lost their 200-day moving average (DMA).
This is a MAJOR development. In terms of seasonality, things are usually quite bullish this time of year (the famed “Santa rally”). The fact the bulls failed to keep the S&P 500 above its 200-DMA despite this is VERY bearish.
Remember, the 200-DMA is like a “line in the sand” for long term trends in the market. During bull markets, stocks rarely break below it. And during bear markets, stocks rarely break above it. You can see this relationship clearly in the below chart. The 200-DMA is the red line.
Put simply, the failure to maintain the 200-DMA indicates that this recent market rally was nothing more than a Bear Market Rally, NOT the start of a new Bull Market.
Below is a chart of what happened to stocks when they failed to maintain their 200-DMA during the Bear Market of 2000-2003. I’ve highlighted this in red circles. Stocks dropped another 30%.
Here’s the same development during the bear market of 2007-2009. This time around stocks lost 50%.
So again, the bear market is not over. The trend remains down. And stocks could lose another 30%-50% in the next 12 months.
If you’ve yet to take
steps to prepare for this, we just published a new exclusive special
report How to Invest During This Bear Market.
It details the #1
investment to own during the bear market as well as how to invest to potentially
generate life changing wealth when
it ends.
The following is an excerpt from my weekly investment advisory Private Wealth Advisory. To learn more about Private Wealth Advisory and how it can help you and your investments, Click Here!
This week I have
good news and bad news.
The good news is
that bonds are finally starting to stabilize.
The bad news is
that they are doing this right as the economy collapses into a severe recession.
As I’ve outlined throughout this year, the
ENTIRE stock market collapse thus far has been due to bond yields rising.
When Treasuries were yielding 0.25%-0.4%
throughout most of 2020 and 2021, investors were willing to pay 20-22 times
forward earnings for stocks. However, once Treasury yields rose over 4% stocks
were repriced down to 16-18 times forward earnings. This makes sense. When the
“risk free” rate of return is close to zero, you’ll pay a premium for growth.
But once you can earn 4+% “risk free” suddenly stocks look a lot riskier!
Indeed, stocks were priced at 20-22 times forward earnings for most of 2020 and 2021. However, once Treasury yields began to rise in late 2021, stocks peaked in terms of multiples. They were eventually repriced down to 16-18 times earnings.
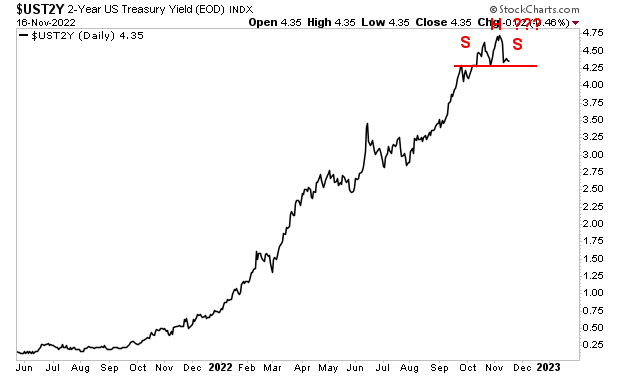
As I noted since this repricing began, the ONLY thing that would stop stocks from being repriced lower would be if bond yields stabilized. With that in mind, I want to point out that the yield on the 2-Year U.S. Treasury appears to have peaked. In fact, it now looks to be forming a kind of “Head and Shoulders” topping pattern. We only need the right shoulder to complete that pattern.
Regardless of
whether that Head and Shoulders pattern is actually confirmed, the key item
here is that Treasury yields finally appear to be
stabilizing. Obviously, stocks would LOVE for Treasury yields to fall,
as that would open the door to a higher forward multiple (assuming the economy
is strong). But for now, the price action in the Treasury market suggests that
stocks will remain priced at a forward multiple of 16-18 at least for now.
That is the good
news.
The bad news is
that earnings are now collapsing, as the economy collapses into a severe
recession. This means the denominator in the P/E ratio (Price/ Earnings) is now
shrinking. Earnings for the third quarter of 2022 are DOWN 8% Year over Year.
As Charlie Bilello notes, this is the second consecutive quarter of
negative earnings growth on a Year over Year basis.
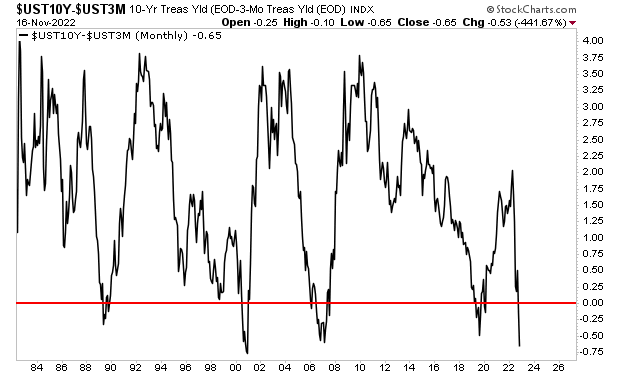
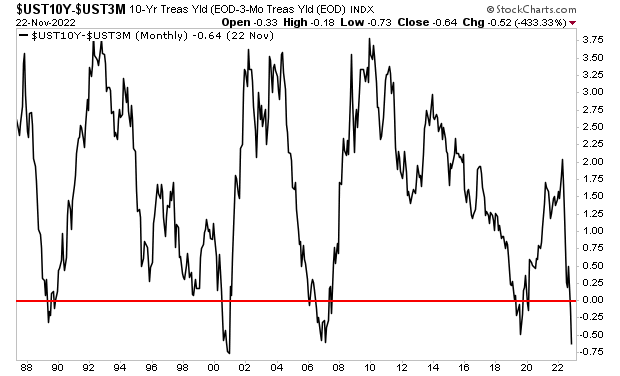
Unfortunately, earnings will be dropping even more going forward. To understand why, we need to first understand the Treasury market. The Treasury is comprised of numerous bonds with different maturation periods ranging from 4 weeks to 30 years.
When you plot the
yield on all of these bonds, you get the “yield curve.” And the
difference in yield between various bonds on this curve is one of the most
accurate predictors of recession.
Specifically, the
difference between the yield on the 10-Year U.S. Treasury and the yield on the
3-month U.S. Treasury. Anytime this difference becomes negative (meaning the
3-month yield is actually higher than the 10-year yield) this indicates a
recession is about to hit.
I’ve illustrated
this in the chart below. Anytime the
black line falls below the red line, the 10-year 3-month yield curve is
“inverted.” This was the case in 1989, 2001, 2007, and 2019: all of those
preceded recessions.
It is happening again now. And as you can see, this metric is MORE negative today than it was before the COVID-19 crash as well as the Great Financial Crisis.
Put simply, the
yield curve of the Treasury market is predicting a severe recession in
the near future, likely the start of 2023.
This is going to
force stocks to new lows.
During the typical recession, Earnings Per Share
(EPS) usually fall 25%. As I write this, Wall Street’s current consensus for
2023 EPS is $230. And Wall Street expects this to GROW by 5%!!!
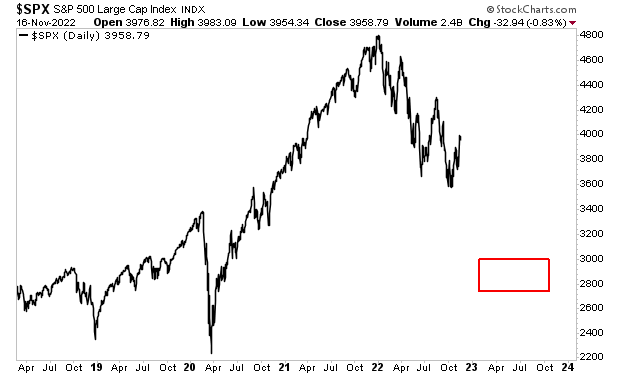
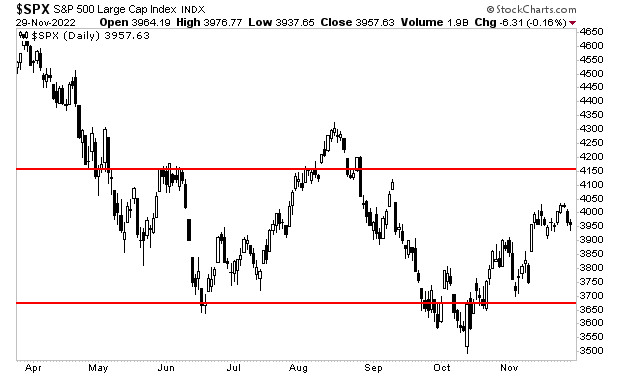
This means the anticipated fair value for the S&P 500 is somewhere between 3,680 and 4,140. Incidentally, that is the EXACT trading range the S&P 500 has been moving in for the last six months.
Put simply, the market is trading based on what Wall Street
expects is coming down the pike. But as I just noted, Wall Street expects
earnings growth of 5% next year. However, the reality is that bonds are telling
us a recession is coming… and a recession would mean a DECLINE in
earnings of at least 25% (remember, the yield curve is predicting a
SEVERE recession).
This would mean the actual 2023 EPS would be closer to $172.
Assuming Treasury yields no longer rise, this means the fair
value for the S&P 500 at 16 to 18 times this much lower EPS would be
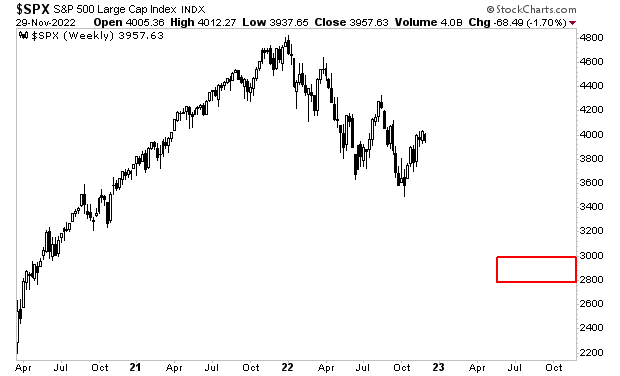
2,752-3,096. I’ve illustrated that range in the chart below. Suffice to say,
the stock market has a LONG ways to go to the downside.
“But wait a minute, Graham” some of you are probably
thinking… “the Fed is about to pivot sometime next year, and that would STOP
the bear market!”
I wish that was
the case…
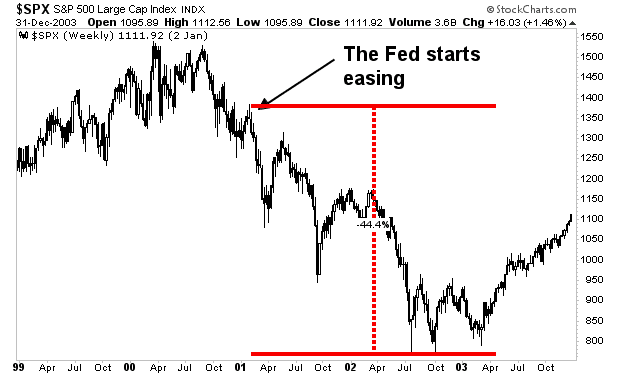
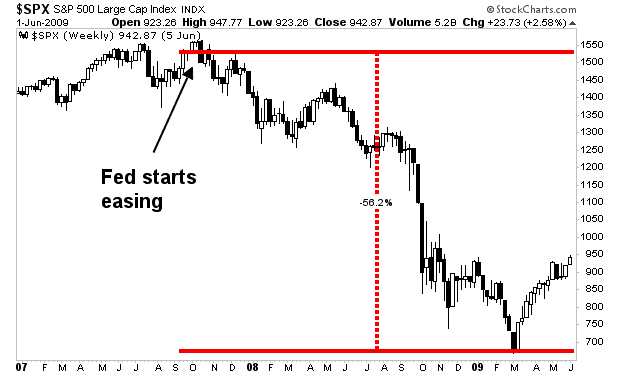
Historically, anytime the Fed stops
tightening and begins easing, the markets don’t actually bottom for
another 14 months.
During the Tech Crash, the Fed started cutting rates in January of 2001. However, by that point, a recession had hit and stocks lost another 44% eventually bottoming in October 2003.
Similarly, during the Housing Crash, the
Fed started easing in August of 2007. There again, a recession hit and stocks lost
another 56% before eventually bottoming in March 2009.
Simply put, even
if the Fed were to surprise everyone and start easing as soon as next month (December) the coming recession
would STILL result in EPS collapsing and stocks cratering another 30% or so.
With stocks at
4,000 or so on the S&P 500, a 30% decline would bring them right to… 2,800,
or around the lower end of the implied fair value for the market at a 16- times
my expected EPS for 2023: $172.
Low Multiple Recessionary EPS Fair Value in 2023
16 X $172 = 2,752
or ~2.800
So again, this
week we have both good news and bad news. The good news is that bonds are
stabilizing. The bad news is that a recession is coming, and earnings are about
to crater.
That will trigger
a stock market collapse to new lows… possibly down to the mid-2000s on the
S&P 500.
If you’ve yet to take steps
to prepare for this, we just published a new exclusive special report How to Invest During This Bear Market.
It details the #1 investment
to own during the bear market as well as how to invest to potentially
generate life changing wealth when
it ends.
Stocks lost their 200-day moving average (DMA) yesterday.
This is a major development, because it indicates that the bulls could not get the S&P 500 to break above its 200-DMA and stay there, despite numerous interventions, manipulations, and performance gaming.
Why does this matter?
The 200-DMA is like a “line in the sand” for long term trends in the market. During bull markets, stocks rarely break below it. And during bear markets, stocks rarely break above it. You can see this relationship clearly in the below chart. The 200-DMA is the red line.
With this latest failure, it’s a clear sign that the bear market is nowhere near over. Take a look at the bear market of 2000-2003 to see what I mean.
Here’s the bear market of 2007-2009.
So again, the bear market is not over. The trend remains down. And it likely won’t end anytime soon (think months, possibly years). Many investors will lose another 50% of their portfoios… if not more as it unfolds.
You don’t need to be one of them!
If you’ve yet to take steps to prepare for this, we just published a new exclusive special report How to Invest During This Bear Market.
It details the #1 investment to own during the bear market as well as how to invest to potentially generate life changing wealth when it ends.
Over the last few days, I’ve illustrated how several major indicators are flashing “RECESSION!”
By quick way of review:
The 10y-3m yield curve has predicted every recession in the last 50 years. It’s telling us that a new severe recession is just around the corner.
Oil has collapsed from $130 per barrel to ~$75 per barrel, indicating demand destruction is underway.
All of this is BAD news for stocks.
Why?
During the typical recession Earnings Per Share (EPS) decline by 25%.
Based on what bonds are doing, stocks are priced between 16 and 18 times forward EPS. Wall Street is currently forecasting EPS growth of 5% next year to $230.
$230 X 16 (or 18)= 3,680 to 4,410.
Incidentally, that is the trading range that stocks have been in for most of the last six months.
By Graham Summers, MBA
Over the last few days, I’ve illustrated how several major indicators are flashing “RECESSION!”
By quick way of review:
The 10y-3m yield curve has predicted every recession in the last 50 years. It’s telling us that a new, severe recession is just around the corner.
Oil has collapsed from $130 per barrel to ~$75 per barrel, indicating demand destruction is underway. This only happens during a recession.
All of these data points are BAD news for stocks.
Why?
During the typical recession Earnings Per Share (EPS) decline by 25%.
Based on what bonds are doing, stocks are priced between 16 and 18 times forward EPS. And Wall Street is currently forecasting EPS growth of 5% next year to $230.
$230 X 16 (or 18)= 3,680 to 4,410.
Incidentally, that is the trading range that stocks have been in for most of the last six months.
However, a recession would mean that EPS for 2023 is closer to $172.
$172 X 16 (or 18)= 2,752 to 3,096
That’s the red box in the chart below.
Put simply, a recession will erase trillions of dollars in wealth…and Wall Street is once again asleep at the wheel, driving its clients off a cliff.
You don’t need to be one of them!
If you’ve yet to take
steps to prepare for this, we just published a new exclusive special
report How to Invest During This Bear Market.
It details the #1
investment to own during the bear market as well as how to invest to potentially
generate life changing wealth when
it ends.
As I noted yesterday, the bond market is telling us that a recession is just around the corner.
By quick way of review, the U.S. treasury market is comprised of 12 bonds, with durations ranging from four weeks to 30 years.
When you plot the yield on all of these bonds, you get the “yield curve.” And the difference in yield between the 10-Year U.S. Treasury and the 3-month U.S. Treasury is one of the best predictors of recessions in the world.
Put simply, anytime this difference becomes negative (meaning the 3-month yield is actually higher than the 10-year yield) this indicates a recession is about to hit.
It happened in 1989, 2001, 2007, and 2019 and today.
This alone is bad news, but we get additional confirmation of a recession from oil.
As you know, oil is extremely closely linked to economic growth. And oil is collapsing, having fallen from $120+ per barrel to the mid-$70s per barrel.
There is only one reason for oil to fall like this during a period of high inflation: demand destruction.
Demand destruction is when the economy rolls over and there is less demand for oil. It only happens during recessions.
And what do you think a recession will do to stocks?
It’s called a crash.
This is going to
force stocks to new lows. I’ll explain why in Friday’s article. Until then…
know this: it is highly likely that a recession is going to trigger a major
crash in stocks. It’s not a question of “if,” it’s a question of “when.”
If you’ve yet to take
steps to prepare for this, we just published a new exclusive special
report How to Invest During This Bear Market.
It details the #1
investment to own during the bear market as well as how to invest to potentially
generate life changing wealth when
it ends.
The stock market is closed tomorrow for Thanksgiving. It will also close early on Friday November 25th at 1PM. As one can imagine, most of Wall Street has already left for the holidays.
This means that trading volume will be extremely light. And that means that those few traders/funds who are active will have an easier time moving the market.
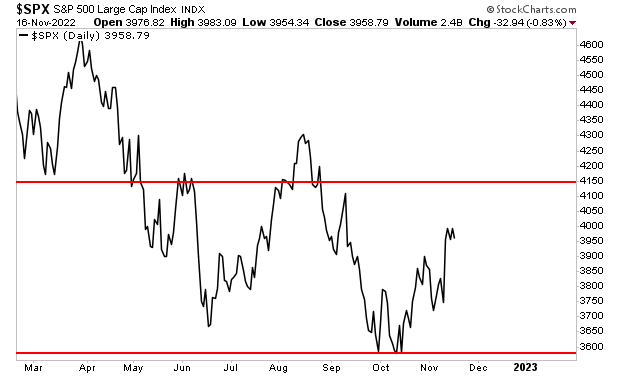
As I write this, the S&P 500 is within spitting distance of its 200-day moving average. There’s little doubt in my mind that stocks will make a run for that line sometime over the holiday.
However, that is a short-term issue. The longer-term issue is that the Treasury market is telling us a severe recession is coming.
The Treasury is comprised of numerous bonds with different maturation periods. They are:
Treasury Bill Maturation Periods:
4 Weeks
13 Weeks
26 Weeks
52 Weeks
Treasury Note Maturation Periods
2 Years
3 Years
5 Years
7 Years
10 Years
Treasury Bond Maturation Periods
20 Years
30 Years
When you plot the yield on all of these bonds, you get the “yield curve.” And the difference in yield between various bonds on this curve is one of the most accurate predictors of recession.
Specifically, the difference between the yield on the 10-Year U.S. Treasury and the yield on the 3-month U.S. Treasury. Anytime this difference becomes negative (meaning the 3-month yield is actually higher than the 10-year yield) this indicates a recession is about to hit.
I’ve illustrated this in the chart below. Anytime the black line falls below the red line, the 10-year 3-month yield curve is “inverted.” This was the case in 1989, 2001, 2007, and 2019: all of those preceded recessions.
It is happening again now. And as you can see, this metric is MORE negative today than it was before the COVID-19 crash as well as the Great Financial Crisis.
Put simply, the yield curve of the Treasury market is predicting a severe recession in the near future, likely the start of 2023.
This is going to force stocks to new lows. I’ll explain why in Friday’s article. Until then… know this: it is highly likely that a recession is going to trigger a major crash in stocks. It’s not a question of “if,” it’s a question of “when.”
If you’ve yet to take
steps to prepare for this, we just published a new exclusive special
report How to Invest During This Bear Market.
It details the #1
investment to own during the bear market as well as how to invest to potentially
generate life changing wealth when
it ends.
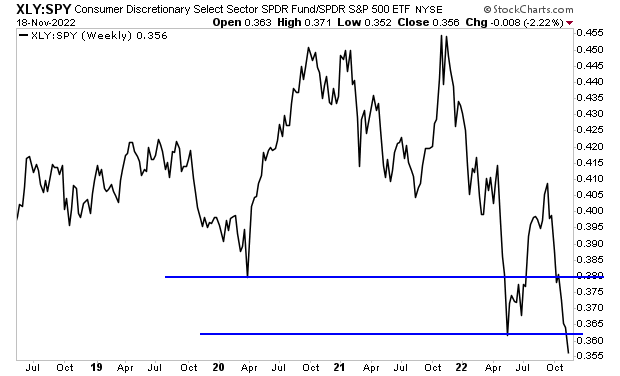
Ever since inflation entered the financial system is early 2021, there has been a debate as to when the higher cost of living would hit consumer spending to the point of inducing a recession.
Sure, consumers can rely on savings or credit to make ends meet in the near-term. However, if inflation remains elevated for a prolonged period, eventually it becomes too much to bear, and the consumer is forced to “tap out” and cut discretionary expenses. That’s when a recession hits.
I mention all of this because the stock market is telling us that the recession has arrived.
One of the best means of analyzing intra-market developments is ratio work. This consists of comparing the performance of one asset or stock relative to the performance of another.
For example, let’s look at the ratio between the Consumer Discretionary ETF (XLY) and the S&P 500 (SPY). During periods of consumer spending strength, this line rises. And during periods of consumer spending weakness this line falls.
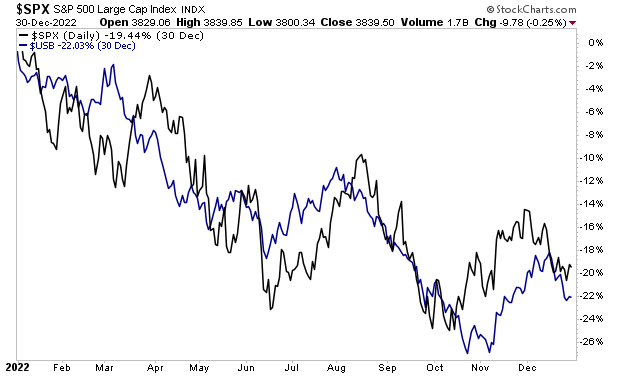
Below is a chart of the ratio over the last four years. As you can see, this ratio is dropping like a stone. It is actually lower today than it was at the lows of the March 2020 Crash!
This suggests the consumer is “tapping out” right here and now. The question now is if this is just a slight downturn or the start of a major recession. To answer that, let’s step back and look at a longer-term chart.
From an economics perspective, this is the most disturbing thing I’ve seen in years. It suggests the U.S. is entering its first major recession since the Great Financial Crisis of 2007-2009.
I think we all remember what happened to stocks during that time: an extraordinary crash in which stocks lost over 50% of their value.
A crash is coming. And it’s going to make 2008 look like a joke.
If you’ve yet to take steps to prepare for this, we just published a new exclusive special report How to Invest During This Bear Market.
It details the #1 investment to own during the bear market as well as how to invest to potentially generate life changing wealth when it ends.
Last week, I warned you not to trust the positive economic data being put out concerning the U.S. economy.
The reasons for my warning were simple: the data was bunk, made up, and of no real value.
By quick review, ALL of the jobs that were supposedly created in October 2022 were not real jobs; they were created in a government spreadsheet via various accounting gimmicks… not in the economy. And yes, I’m talking about all 261,000 of them.
The inflation data that everyone was so excited about last week was also NOT positive.
Month over Month inflation was 0% in July, 0.1% in August, and 0.4% in September. With that in mind, I ask… “how was a month over month reading of 0.4% in October a great thing? Technically the inflation data was BETTER during the summer!!!”
Moreover, the items that DECLINED in price… allowing the beancounters to make inflation look better than it is, were used cars and trucks, medical care, apparel, and airline fare.
By way of contrast, shelter, gas and food prices all increased.
Again… how is any of that good for the economy?
I realize it might be difficult to believe me here. After all, 99% of mainstream economists and financial media talking heads are saying the exact opposite: the economy is doing fine and inflation is coming down.
So, with that in mind, I ask you to take a look at the following data points. What do they tell you about the TRUE status of the U.S. economy?
· Juul lays off ~1/3rd of its workforce.
· Redfin lays off 13% of its staff.
· Meta to fire 13% of its workforce.
· Twitter lays off ~50% of its workforce.
· Snap lays off 20% of its employees.
· Wayfair: lays off 10% of its corporate team.
· Microsoft fires 1,000 workers.
· Disney to begin layoffs, targeted hiring freeze.
· Re/Max to fire 17% of its workforce.
· Compass to layoff 10% of its workforce.
Let’s be blunt here… corporations implement major layoffs like this during only one kind of economic environment: a recession.
And what impact do you think a recession is going to have on the stock market?
I’ll detail in tomorrow’s article. For now, the key item to note is that the Everything Bubble has burst.
On that note, we are putting together an Executive Summary outlining how to invest in this new bearish environment.
It will be available exclusively to our clients. If you’d like to have a copy delivered to your inbox when it’s completed, you can join the wait-list here.