It’s a Bull Market

This is How to Make Money From Today’s Market

By Graham Summers, MBA

Yesterday’s market action could not have illustrated the current market rotation any better.

As I recently outlined:

1) The S&P 500 is currently consolidating after one of its best monthly performances in 30 years.

2) This consolidation has consisted of large tech correcting while laggard sectors and indices (small caps/ the Russell 2000, industrials/ the Dow Jones Industrial Average) catch a bid.

Yesterday’s price action illustrated this perfectly: microcaps (the Russell 2000) caught a major bid relative to tech (the NASDAQ) as the Russell 2000 ROSE over 1% while the NASDAQ fell nearly 0.9%.

If you heeded yesterday’s missive you did quite well! Again, you CAN outperform the overall market, but it takes a lot of work and insight!

This trend is likely to play out over the next two weeks until the Russell 2000/ NASDAQ ratio reaches its 200-day moving average (DMA) sometime around the Fed’s next FOMC (December 12th-13th).

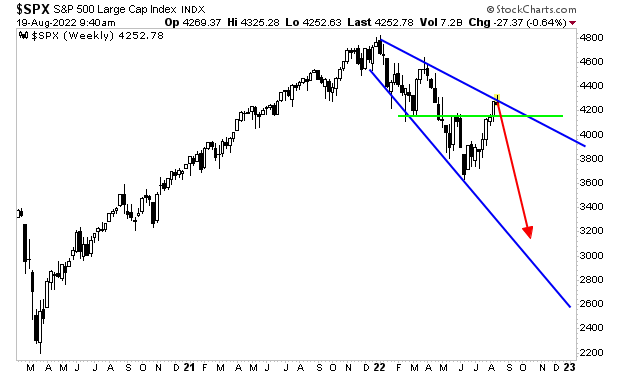
At that point the overall market should complete its consolidation/ correction and begin its next leg up. I’ve said previously that the S&P 500 will hit 5,000 sometime in the 1Q24. The setup is clear in the longer-term Cup and Handle formation.

For more market insights and analysis, join our free daily market commentary Gains Pains & Capital. You’ll immediately start receiving our Chief Market Strategist Graham Summers, MBA’s briefings to your inbox every morning before the market’s open.

And if you sign up today, you’ll also receive a special investment report How to Time a Market Bottom that the market set-up that has caught the bottoms after the Tech Crash, Housing Bust, and even the 2020 pandemic lows.Even more importantly, you’ll find out what this trigger says about the market today!This report usually costs $249, but if you join Gains Pains & Capital today, you’ll receive your copy for FREE.To do so…https://phoenixcapitalmarketing.com/TMB.html

Posted by Phoenix Capital Research in It's a Bull Market

Here’s the Rotation and Then Comes New Highs

By Graham Summers, MBA

What comes next for stocks?

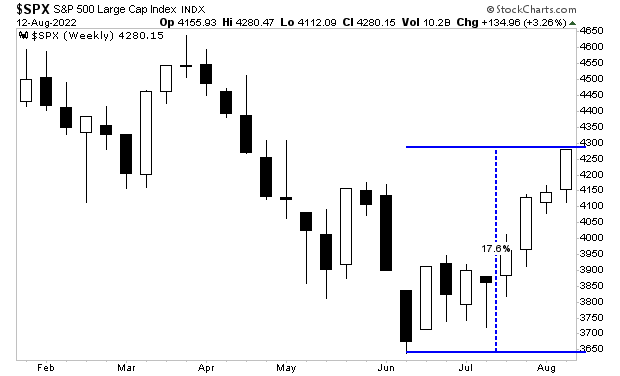
The S&P 500’s performance for the month of November 2023 was one of the best single month performances for stocks in the last 30 years. Stocks finished the month up 9.5%, a truly incredible return.

The big question is “what’s next for the markets?”

The answer is “rotation.”

Tech led the rally as Big Tech blasted higher throughout November while much of the rest of the market lagged behind. We are now seeing capital flowing into some of of the laggards, specifically small caps.

The ratio between the NASDAQ and the Russell 2000 has been in a downtrend for most of 2023 as Tech stocks outperform small caps. We are now seeing a break of this downtrend to the upside as small caps finally catch a bid and Tech consolidates

This rotation is allowing overall breadth to improve as non-Tech stocks catch up to Tech leaders. You can see this clearly in the chart below in which breadth (red line) is catching up to the Tech sector (XLK).

After this rotation/ catch up is finished, stocks go to new all time highs. The Cup and Handle formation in the long-term chart for the S&P 500 is clear.

For more market insights and analysis, join our free daily market commentary Gains Pains & Capital. You’ll immediately start receiving our Chief Market Strategist Graham Summers, MBA’s briefings to your inbox every morning before the market’s open.

And if you sign up today, you’ll also receive a special investment report How to Time a Market Bottom that the market set-up that has caught the bottoms after the Tech Crash, Housing Bust, and even the 2020 pandemic lows.Even more importantly, you’ll find out what this trigger says about the market today!This report usually costs $249, but if you join Gains Pains & Capital today, you’ll receive your copy for FREE. To do so…

https://phoenixcapitalmarketing.com/TMB.html

Posted by Phoenix Capital Research in It's a Bull Market

Stocks Will Hit New All Time Highs Before February 1, 2024

By Graham Summers, MBA

The S&P 500 is consolidating after one of its best monthly performances in the last 30 years.

Thus far in November, the S&P 500 is up 8.5%. If the month ended today, it would be one of the top 10 monthly returns for the S&P 500 in the last 30 years. We rode this rally the entire way up, having told our clients to buy stocks aggressively when the S&P 500 was down at 4,200. Suffice to say, they’re quite happy.

And their #1 question today is: so what’s next for stocks?

The S&P 500 is quite overextended, having rallied to a level that is 4% above its 50-day moving average (DMA). Throughout the last 12 months, an extension of this magnitude above the 50-DMA has marked a temporary top for stocks.

The big question now is if stocks correct… or if they simply consolidate here, thereby allowing the 50-DMA to catch up to price, before the market make its next push higher. 

Thus far the market is opting for #2: consolidating. 

The S&P 500 has traded within a 20 point range since November 22nd. The key issue here as far as I’m concerned is that the bears have failed to push stocks down in any significant way, even though there was very low trading volume due to the Thanksgiving holiday.

Think of it this way… stocks are finalizing one of their most aggressive single month rallies  in 30 years, and the bears can’t even generate enough selling pressure to push the S&P 500 down 1%. 

This suggests that the next move for stocks will be up once this consolidation is over. And given that the market is less than 5% from its all-time highs, I believe we’ll see the S&P 500 hit NEW all-time highs some time in the first quarter of 2025, likely before February 1st, 2024.

For more market insights and analysis, join our free daily market commentary Gains Pains & Capital. You’ll immediately start receiving our Chief Market Strategist Graham Summers, MBA’s briefings to your inbox every morning before the market’s open.

And if you sign up today, you’ll also receive a special investment report How to Time a Market Bottom that the market set-up that has caught the bottoms after the Tech Crash, Housing Bust, and even the 2020 pandemic lows.

Even more importantly, you’ll find out what this trigger says about the market today!

This report usually costs $249, but if you join Gains Pains & Capital today, you’ll receive your copy for FREE.

To do so…

https://phoenixcapitalmarketing.com/TMB.html

Posted by Phoenix Capital Research in It's a Bull Market

Yes, You CAN Time the Market… And I’ll Show You How!

By Graham Summers, MBA

Yesterday’s article caused quite a stir.

It is widely believed that you cannot time the market. This is a myth. You can time the market, but it takes a lot of work and knowledge.

Case in point, as I outlined in yesterday’s article, I accurately called for the S&P 500 to run to 4,600 back on November 2, 2023 when the market was still just at 4,200.

The S&P 500 hit a high an intraday high of 4,557 yesterday. Modesty aside, this was an incredible call, made within a few days of the market hitting its absolute lows before the rally.

This wasn’t luck either. 

Prior to this call, I had been warning clients for weeks that stocks would break down to the 4,100s on the S&P 500 and that this would be a MAJOR buying opportunity. Heck, the literal title to a research note to private clients on October 5th was “Bonds Stabilize… But I Expect a Final Flush for Stocks.”

What happened next is illustrated in the chart chart. Again, I called for the S&P 500 to drop to the 4,100s weeks in advance, then predicted the S&P 500 would run to 4,600 weeks within days of the market bottom in late October.

So my point remains the same: you CAN time the market, but it takes a lot of work and knowledge.

For more market insights and analysis, join our free daily market commentary Gains Pains & Capital. You’ll immediately start receiving our Chief Market Strategist Graham Summers, MBA’s briefings to your inbox every morning before the market’s open.

And if you sign up today, you’ll also receive a special investment report How to Time a Market Bottom that the market set-up that has caught the bottoms after the Tech Crash, Housing Bust, and even the 2020 pandemic lows.

Even more importantly, you’ll find out what this trigger says about the market today!

This report usually costs $249, but if you join Gains Pains & Capital today, you’ll receive your copy for FREE.

To do so…

https://phoenixcapitalmarketing.com/TMB.html

Posted by Phoenix Capital Research in It's a Bull Market

How We Called the Santa Rally Week’s Before Anyone Else

By Graham Summers, MBA

The following are excerpts from my Private Wealth Advisory market update to private clients written on 11-2-23. At that time the S&P 500 was trading in the 4,200s. It’s at 4,531 today.

The door is open to a Santa Rally to 4,600 or even higher on the S&P 500.

Why?

The Treasury just removed the single largest concern for stocks for the remainder of the year.

As I’ve noted previously, one of the most difficult aspects of stock market investing is that the market is a discounting mechanism for millions, if not billions, of pieces of information. The stock market represents the collective decisions of millions of individuals all of whom are thinking about a myriad of data points/ issues… and all of whom have literal money on the line.

However, out of all the millions or billions of pieces of information that the market is discounting at any given time, it typically only really cares about two or three issues at a time. 

Sometimes it’s inflation. Other times it’s what the President is doing (or tweeting). Other times it’s China. Other times it’s what the Fed is doing or about to do. Other times it’s the economy. And so on and so forth.

What makes things even more difficult is the fact that the market changes its focus all the time. It might be really focused on inflation for a few weeks only to then ignore inflation for months on end. Similarly, the market might go weeks without acknowledging anything Fed officials say, only to then care a great deal about a single statement made by a single Fed official during an hour-long Q&A session.

I bring all of this up, because since late-July/ early-August 2023, the #1 thing the market has cared about has been the size of the Treasury’s long-duration debt issuance…

On July 31st 2023, the Treasury announced its financing needs for the third quarter (July through September). The Treasury announced it would:

1)    Need to borrow $274 billion more than previously expected.

2)    Increase its issuance of longer duration Treasury bonds for the first time since 2021.

Regarding #2, the actual increase in dollar terms of long duration bonds that the Treasury needed to issue was relatively small ($102 billion vs. $96 billion). However, the fact that there was increase in long duration issuance, combined with the increase in total debt issuance ($274 billion) was a surprise.

And the bond markets HATE surprises.

Since that time, bond investors have been dumping ALL long duration bonds. This has resulted in long-term Treasury yields rising (bond yields rise when bond prices fall). And because the stock market is priced based on long-duration Treasury yields, this has meant a sell-off in stocks.

The chart bel shows the yield on the 10-Year U.S. Treasury and the S&P 500 from the last QRA announcement on July 31st 2023 until last week. As you can see, the two items have been moving in lockstep.

Which brings us to this week (week of 10-30-23).

On Monday the 30th of October, the Treasury issued its QRA for the fourth quarter of 2023. It surprised the markets (in a good way) by stating that it would borrow only $776 billion (this was $76 billion less than previously expected).

Then, on Wednesday (11-1-3), the Treasury released its Report to the Secretary of the Treasury from the Treasury Borrowing Advisory Committee.

In it, the Treasury Borrowing Advisory Committee wrote the following (emphasis added)

The Committee supported meaningful deviation from the historical recommendation for 15-20% T-Bill share. While most members supported a return to within the recommended band over time, the Committee noted that the work Treasury has done to meaningfully increase WAM over the past 15 years affords them increased flexibility with T-Bill share in the medium term.

Source: Treasury.gov

As I explained to clients in the remainder of this market update, the decision of the Treasury to rely extensively on short-term T-bills to finance the deficit would ignite a “risk on” rally that will likely last into year-end.

Since that time, the S&P 500 has done this:

For more market insights and analysis, join our free daily market commentary Gains Pains & Capital. You’ll immediately start receiving our Chief Market Strategist Graham Summers, MBA’s briefings to your inbox every morning before the market’s open.

And if you sign up today, you’ll also receive a special investment report How to Time a Market Bottom that the market set-up that has caught the bottoms after the Tech Crash, Housing Bust, and even the 2020 pandemic lows.

Even more importantly, you’ll find out what this trigger says about the market today!

This report usually costs $249, but if you join Gains Pains & Capital today, you’ll receive your copy for FREE.

To do so…

https://phoenixcapitalmarketing.com/TMB.html

Posted by Phoenix Capital Research in It's a Bull Market
The Bears Failed, Again… So What’s Next For the Markets?

The Bears Failed, Again… So What’s Next For the Markets?

By Graham Summers, MBA

Try as they might, the bears simply couldn’t get it done last week. 

The S&P 500 spent a few days chopping around its 200-day moving average (DMA) before spiking higher on Friday. Much of this late week rally was short covering, but the fact remains that sellers simply didn’t have what it took to push stocks any lower.

Indeed, the biggest news as far as stocks were concerned was the fact that the tech-heavy NASDAQ simply refused to take out support at 13,000. 

Tech is a long-duration sector of the market… meaning it is heavily influenced by long duration bonds. The reason for this is that your typical tech start-up will take years before it brings a product or service to market and starts generating cash flow. So when you’re modeling a tech company’s future cash flows, you need to be thinking five years out or more. This means comparing a tech company’s future earnings against what you’d earn from owning a risk-free U.S. Treasury over the same time period.

Simply put, the tech sector is heavily influenced by what long-duration bonds do… which is why it’s truly astonishing that the NASDAQ has refused to break down despite the fact the yield on the 10-year U.S. Treasury spiked to new highs. The fact that stock market bears failed to crush tech is really quite bullish and a significant “tell” for the markets.

With all of this in mind, it’s quite possible stocks bottomed last week or will bottom this one. I remain concerned about a number of risks to the markets, but we have to respect price action. And price action tells us that stocks are strong in spite of many issues. 

For more market insights and analysis, join our free daily market commentary Gains Pains & Capital. You’ll immediately start receiving our Chief Market Strategist Graham Summers, MBA’s briefings to your inbox every morning before the market’s open. Since 2015, Graham has shown investors a win rate of 75% meaning they made money on three out of every four positions closed.

And if you sign up today, you’ll also receive a special investment report How to Time a Market Bottom that the market set-up that has caught the bottoms after the Tech Crash, Housing Bust, and even the 2020 pandemic lows.

This report usually costs $249, but if you join Gains Pains & Capital today, you’ll receive your copy for FREE.

To do so…

https://phoenixcapitalmarketing.com/TMB.html

Posted by Phoenix Capital Research in It's a Bull Market

Stocks Bounce…But Is the Bottom In?

By Graham Summers, MBA

Bonds finally bounced yesterday. However, the bounce was relatively weak and didn’t signal the “all clear.”

Simply put, things stabilized. But they didn’t actually improve much. And market leading indicators suggest this correction isn’t over yet.

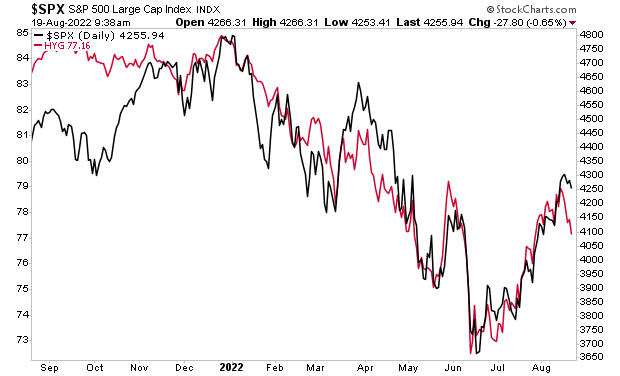
High yield credit typically leads stocks both the upside and the downside. It bottomed weeks before stocks did in October 2022. And right now, it’s telling us the S&P 500 could easily go to 4,100.

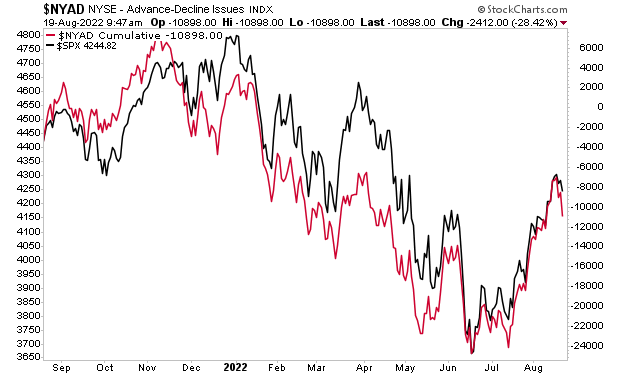
Breadth is another market leading indicator I watch. And it is also telling us stocks are not finished falling just yet. Again, I don’t trust this bounce in stocks at all.

Again, the long-end of the Treasury market has completely collapsed. Banks and financial entities are sitting on hundreds of billions of dollars worth of losses. As I keep warning, the Great Debt Crisis of our lifetimes is fast approaching. The time to prepare is NOW, before it hits.

As I keep warning, the Great Debt Crisis of our lifetimes is fast approaching. The time to prepare is NOW, before it hits.

I’ve identified a series of market events that unfold before every crash.

I detail them, along with what they’re currently saying about the market today in a Special Investment Report How to Predict a Crash.

Normally this report would be sold for $249. But we are making it FREE to anyone who joins our Daily Market Commentary Gains Pains & Capital.

https://phoenixcapitalmarketing.com/predictcrash.html

Graham Summers, MBA

Chief Market Strategist

Phoenix Capital Research

Posted by Phoenix Capital Research in It's a Bull Market

The Selling Might Be Done For Now

By Graham Summers, MBA

Tech looks due for a bounce.

The Tech ETF (XLK) is at major support at $166. Even if this is not THE low, it’s a decent spot for a bounce as XLK rallies to $175 or so as it carves out a potential right shoulder in a Head and Shoulders pattern.

Moreover, the yield on the 10-Year U.S. Treasury is at major resistance. 

Tech is a long-duration play, meaning it is heavily affected by the yield on longer-term Treasuries. The odds of the yield on the 10-Year U.S. Treasury breaking above its current levels right here and now are not high. This suggests the next move for this yield would be down, which would alleviate some of the pressure on tech stocks.

Given that the S&P 500 is heavily weighted towards tech (the sector accounts for 28% of the index’s weight) all of the above items suggest a bounce in tech and the broader market here. Again, this is just a short-term idea.

In the big picture however, my proprietary Bull Market Trigger is about to register its first “buy” in over a decade.

This signal has only registered TWO times in the last 25 years: in 2003 and 2010. And it’s close to registering a new signal today,

If you’ve yet to take steps to prepare for invest accordingly, we have published an exclusive special report How to Time a Market Bottom.

It details the my proprietary bull market trigger, how stocks have performed following prior signals, and what it is stating right now.

Normally this report would be sold for $249. But we are making it FREE to anyone who joins our Daily Market Commentary Gains Pains & Capital.

To pick up your copy, swing by:

https://phoenixcapitalmarketing.com/TMB.html

This image has an empty alt attribute; its file name is signature.jpg
Posted by Phoenix Capital Research in It's a Bull Market

Ignore the Noise, This is the Framework For the Markets Today

By Graham Summers, MBA

Nothing has changed in the U.S. in the last month.

The primary framework for investing in the U.S. is as follows:

1)    The stock market is bubbling up due to:

a.     There being too much liquidity in the financial system.

b.    Inflation, particularly core inflation remains elevated (4.8%).

c.     Stocks are a better inflation hedge that bonds or cash.

2)    The U.S. economy isn’t growing rapidly, but it’s not contracting either.

a.     The Atlanta Fed’s GDP Now metric shows economic growth of 2.4%. 

b.    The Federal government is running its largest deficit as a percentage of GDP in history outside of wartime/ a recession. Much of this deficit is going towards social programs and stimulus measures. 

c.     Social spending and economic stimulus measures will continue if not increase as we head into the 2024 Presidential election. 

d.    The recent debt ceiling deal removes all spending caps through the 2024 election.

Put simply we are in a situation in which nothing is going great, but pretty much everything is going OK. Inflation remains high, but it has come down from its peak. The economy is still growing, albeit at a sub-3% pace. And there is ample liquidity in the financial system.

All of this is generally “risk on” for the markets… which means this situation will continue until something significant breaks. This doesn’t mean that stocks won’t correct or ever fall in price again. But it does mean that we are likely in a new bull market and that things will continue to be in “risk on” mode until something major breaks. 

Regarding the potential for a recession, the yield curve, particularly the all-important 2s10s (what you get when you subtract the yield of the 2-Year U.S. Treasury from the yield of the 10-Year U.S. Treasury) remains extremely inverted.

This has predicted every recession since 1955. However, the actual recession doesn’t hit until this dis-inverts, meaning it moves back into positive territory. And as the below chart shows, it can take months if not years for the yield curve to dis-invert once it becomes inverted.

Put simply, until this chart moves back into positive territory, this is just a warning that a recession is coming eventually. Nothing more.

So again, there are red flags in the financial system today, but these are warnings not signals that it’s time to get REALLY bearish. The purpose of investing is to make money, not miss out on gains because of a warning. So we ride this bull run for as long as we can until it ends.

Indeed, my proprietary Bull Market Trigger is about to register its first “buy” in over a decade.

This signal has only registered TWO times in the last 25 years: in 2003 and 2010. And it’s close to registering a new signal today,

If you’ve yet to take steps to prepare for invest accordingly, we have published an exclusive special report How to Time a Market Bottom.

It details the my proprietary bull market trigger, how stocks have performed following prior signals, and what it is stating right now.

Normally this report would be sold for $249. But we are making it FREE to anyone who joins our Daily Market Commentary Gains Pains & Capital.

To pick up your copy, swing by:

https://phoenixcapitalmarketing.com/TMB.html

This image has an empty alt attribute; its file name is signature.jpg
Posted by Phoenix Capital Research in It's a Bull Market
Buckle Up, What You’re About to See Isn’t Pretty

Buckle Up, What You’re About to See Isn’t Pretty

By Graham Summers, MBA

Last week I noted that the U.S. is becoming an emerging market.

By quick way of review:

1) Many of the most important institutions in the U.S. now exhibit a level of corruption that is normal for banana republics. We now see these institutions doing everything from interfering in elections to arresting political opponents and more. The individuals who do this are not punished, if anything they given book deals and TV slots.

2) The U.S. no longer has a clear rule of law. Those with the correct political leanings and connections can avoid jail time for serious crimes, even treason. Meanwhile, those on the other side of the political spectrum are given lengthy sentences for minor transgressions. 

3) The U.S. economy is no longer a manufacturing/ industrial leader. Decades of outsourcing have gutted the middle class resulting in the kind of wealth disparities you usually see in emerging markets. American children dream of becoming influencers or social media personalities instead of business owners or innovators.

It’s enough to make you sick. 

Indeed, the “U.S. is an emerging market” theme was on full display last week when our Secretary of the Treasury, Janet Yellen, arguably the most important financial figure in our country, and the person in charge of managing the U.S. dollar/ financial system, groveled in front of China’s Vice Premiere He Lifeng during her visit to China

Ms. Yellen bowed repeatedly to the Vice Premiere, groveling much as an emerging market financial official would kowtow to his or her counterpart from a more developed, superior nation upon which the former’s nation relied for aid/ support/ assistance.

See for yourself. And mind you, this is one of NUMEROUS bows.

Again, this is the thing of emerging markets. And the fact that the person who manages our finances and currency is this incompetent/ embarrassing illustrates clearly just how far the U.S. has sunk.

The only good thing that will come from this is that if you know how to invest in emerging market regimes, you can stand to make a fortune in the coming years.

Indeed, this kind of tectonic shift represents a “once in a lifetime” opportunity. Some investments are going to produce fortunes. Others will lose money for years… if not decades. And those investors who are positioned correctly for this will thrive while others struggle.

We recently outlined a unique “of the radar” investment that will outperform in this new economic landscape in an investment report called Billionaire’s “Green Gold.”

It details the actions of a family of billionaires who literally made their fortunes investing in emerging markets. And they just became involved in a mid-cap company that has the potential to TRIPLE in value in the coming months.

Normally this report would be sold for $249. But we are making it FREE to anyone who joins our Daily Market Commentary Gains Pains & Capital.

To pick up your copy, swing by:

https://phoenixcapitalmarketing.com/GreenGold.html

Posted by Phoenix Capital Research in It's a Bull Market

Please, Whatever You Do, Don’t Fall For This!

By Graham Summers, MBA

In the last two days, I’ve addressed two major piles of economic BS… the jobs data from January… and the inflation data.

By quick way of review…

1) The reason the U.S. economy supposedly “added” 500,000+ jobs in January was due to an accounting gimmick, NOT because those jobs were actually created.

2) The Bureau of Labor Statistics (BLS) openly admits this, citing that without its “population control effect” the economy added… 84,000 jobs.

3) The only part of the inflation data that has dropped has been in Energy prices. 

4) The reason Energy prices dropped was because the Biden administration dumped over 250 MILLION barrels of oil in the last two years.

Today we’re addressing a new pile of BS… the January retail sales.

In case you missed it, January’s retail sales were fantastic, up 3% month over month.

Even more incredibly all 13 retail categories rose month over month. This is the first time this happened since the economy emerged from the depths of the pandemic shutdowns.

The economy must be roaring right!

WRONG.

The retail sales were NOT adjusted for inflation.

Inflation is somewhere between 6.4% and 9% depending on the data you track.

So the retail sales were actually NEGATIVE when you account for inflation. Or put simply, this supposed retail “growth” was all due to the prices of things rising.

Think of it this way.

Let’s say your boss gives you a 10% raise. Now let’s say that inflation is also 10%. 

Did you really get a raise?

No… your income is precisely where it was before relative to your cost of living.

THAT’s what is happening in retail. Everythings costs more… so the sales look stronger.

If you don’t believe me, consider the below chart of credit card debt. Americans are maxing out their credit cards…

While eating into their savings…

Put simply, the retail numbers were total BS. Americans are spending more just to get by because of inflation… not because the economy is booming.

And yet… investors are buying stocks based on this BS!

Oh… and by the way… our proprietary Bear Market Trigger… the one that predicted the Tech Crash as well as the Great Financial Crisis… is on a confirmed SELL signal for the first time since 2008.

If you’ve yet to take steps to prepare for what’s coming, we just published a new exclusive special report How to Invest During This Bear Market.

It details the #1 investment to own during the bear market as well as how to invest to potentially generate life changing wealth when it ends.

To pick up your FREE copy, swing by:

https://phoenixcapitalmarketing.com/BM.html

Posted by Phoenix Capital Research in It's a Bull Market

Has Inflation Finally Peaked? Let’s Take a Look…

By Graham Summers, MBA

The markets have reached a new level of stupidity.

Stocks are exploding higher based on inflation coming in at 7.1% Year over Year. This is apparently great news because Wall Street expected the number to be somewhere between 7.2% and 7.6%.

So, according to those buying stocks today,  a 0.1% “beat” on an inflation number that is still north of 7% despite the Fed implementing its most aggressive rate hike cycle in 40 years in is a reason to panic bid stocks higher.

Looking through the numbers, almost the entire drop came courtesy of falling energy prices and used cars. I might add that the drop in energy is not surprising given that the Biden administration drained the Strategic Petroleum Reserve (SPR) by ~180 million barrels of oil. Practically everything outside of energy and used car prices is still rising.
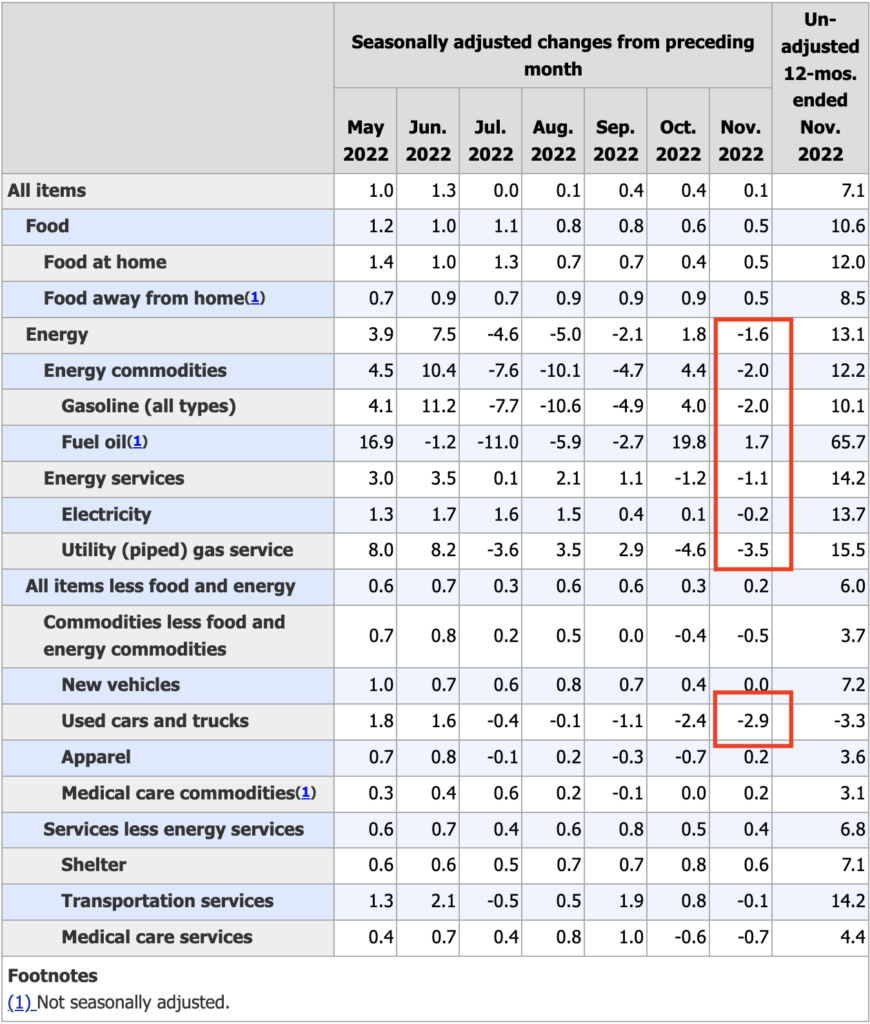
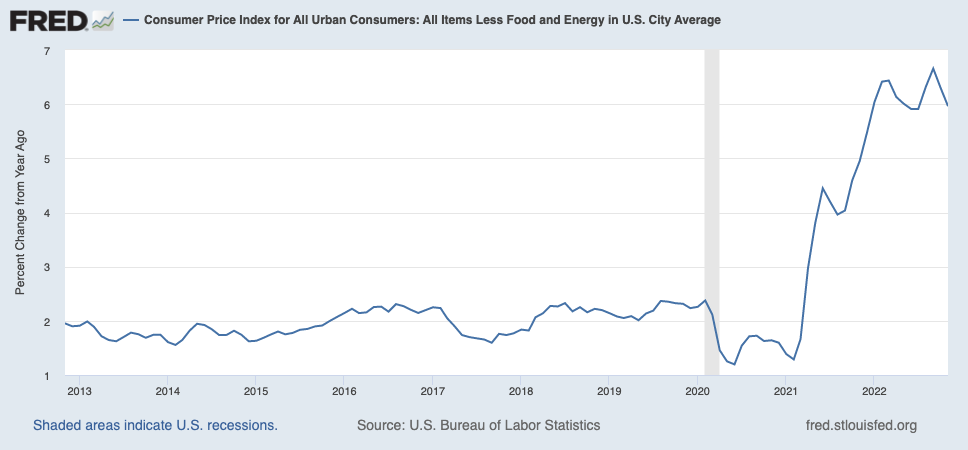
Elsewhere in the report, core inflation, which the Fed looks at closely is still at 6%. Sure, it’s not spiking any higher, but this it’s not coming down much either. Again, this is good in a way, but is it a reason to panic buy stocks like inflation is gone? I don’t think so.
Unfortunately for those who are panic buying stocks today, the bear market is NOT over. With a recession just around the corner, stocks will soon collapse to new lows.

If you’ve yet to take steps to prepare for this, we just published a new exclusive special report How to Invest During This Bear Market.

It details the #1 investment to own during the bear market as well as how to invest to potentially generate life changing wealth when it ends.

To pick up your FREE copy, swing by:

https://phoenixcapitalmarketing.com/BM.html

Posted by Phoenix Capital Research in It's a Bull Market

Something MAJOR Happened In the Markets Yesterday…

By Graham Summers, MBA

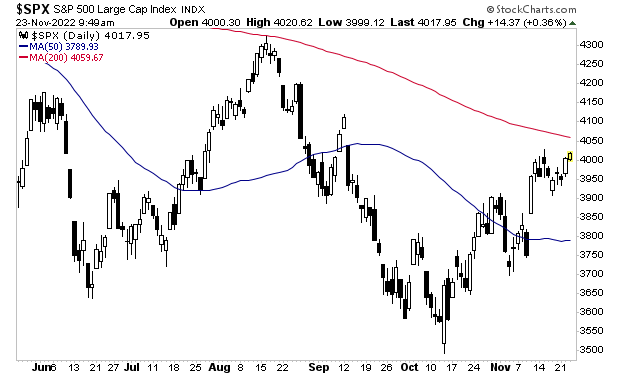
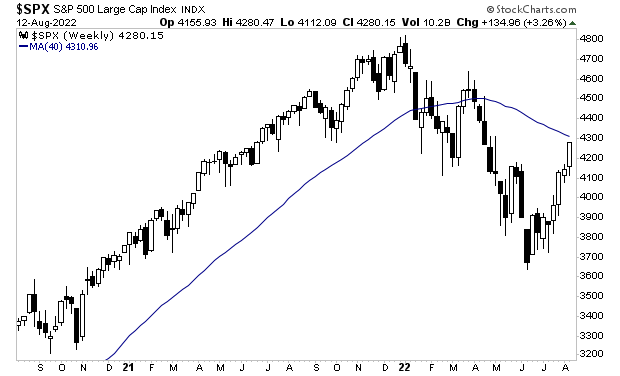
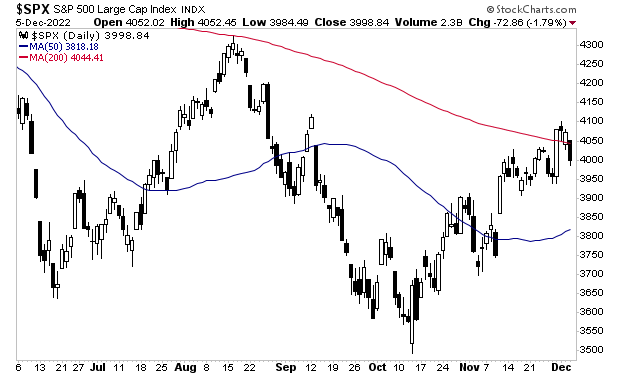
Stocks lost their 200-day moving average (DMA) yesterday.

This is a major development, because it indicates that the bulls could not get the S&P 500 to break above its 200-DMA and stay there, despite numerous interventions, manipulations, and performance gaming.

Why does this matter?

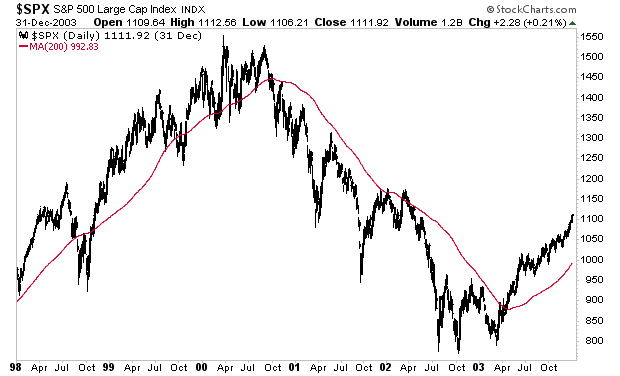
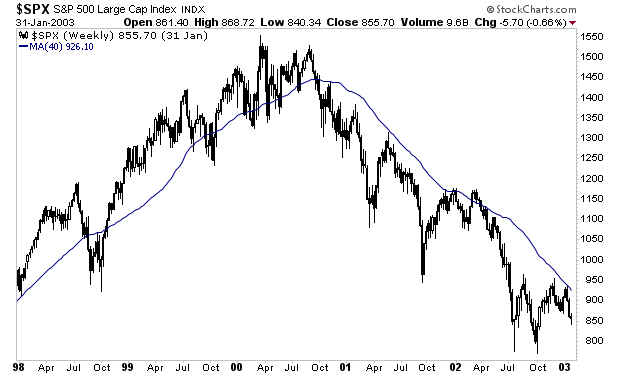
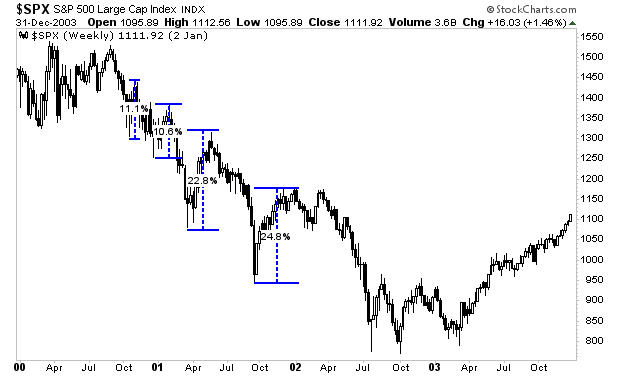
The 200-DMA is like a “line in the sand” for long term trends in the market. During bull markets, stocks rarely break below it. And during bear markets, stocks rarely break above it. You can see this relationship clearly in the below chart. The 200-DMA is the red line.

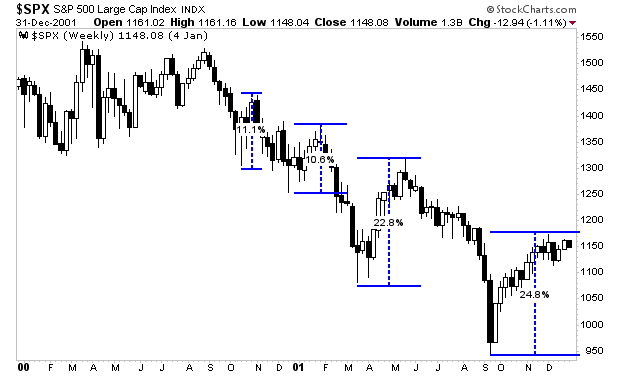
With this latest failure, it’s a clear sign that the bear market is nowhere near over. Take a look at the bear market of 2000-2003 to see what I mean.

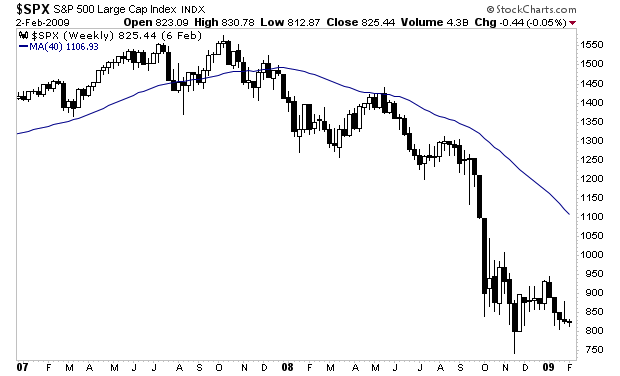
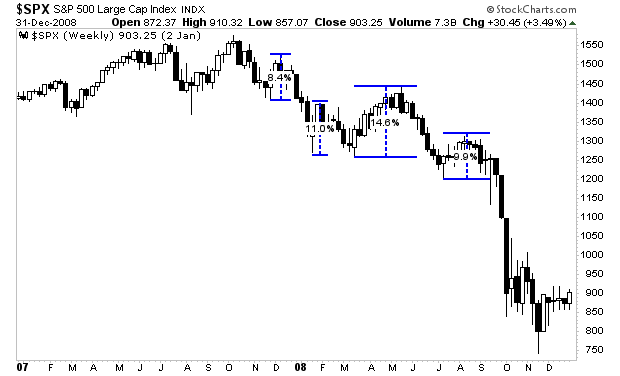
Here’s the bear market of 2007-2009.

So again, the bear market is not over. The trend remains down. And it likely won’t end anytime soon (think months, possibly years). Many investors will lose another 50% of their portfoios… if not more as it unfolds.

You don’t need to be one of them!

If you’ve yet to take steps to prepare for this, we just published a new exclusive special report How to Invest During This Bear Market.

It details the #1 investment to own during the bear market as well as how to invest to potentially generate life changing wealth when it ends.

To pick up your FREE copy, swing by:

https://phoenixcapitalmarketing.com/BM.html

Posted by Phoenix Capital Research in It's a Bull Market

This is Why We Opened Our Crash Trades

By Graham Summers, MBA

As I noted yesterday, the bond market is telling us that a recession is just around the corner.

By quick way of review, the U.S. treasury market is comprised of 12 bonds, with durations ranging from four weeks to 30 years.

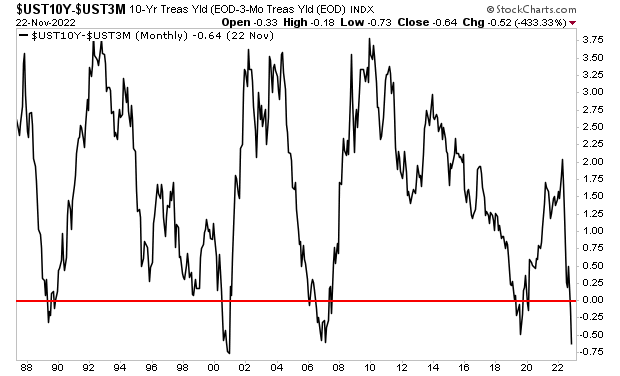
When you plot the yield on all of these bonds, you get the “yield curve.” And the difference in yield between the 10-Year U.S. Treasury and the 3-month U.S. Treasury is one of the best predictors of recessions in the world.

Put simply, anytime this difference becomes negative (meaning the 3-month yield is actually higher than the 10-year yield) this indicates a recession is about to hit.

It happened in 1989, 2001, 2007, and 2019 and today.

This alone is bad news, but we get additional confirmation of a recession from oil.

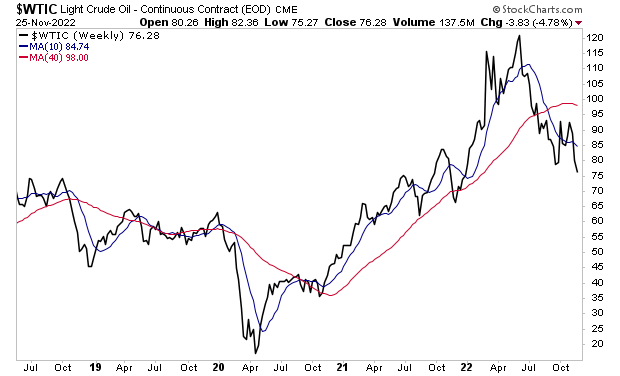
As you know, oil is extremely closely linked to economic growth. And oil is collapsing, having fallen from $120+ per barrel to the mid-$70s per barrel.

There is only one reason for oil to fall like this during a period of high inflation: demand destruction.

Demand destruction is when the economy rolls over and there is less demand for oil. It only happens during recessions.

And what do you think a recession will do to stocks?

It’s called a crash.

This is going to force stocks to new lows. I’ll explain why in Friday’s article. Until then… know this: it is highly likely that a recession is going to trigger a major crash in stocks. It’s not a question of “if,” it’s a question of “when.”

If you’ve yet to take steps to prepare for this, we just published a new exclusive special report How to Invest During This Bear Market.

It details the #1 investment to own during the bear market as well as how to invest to potentially generate life changing wealth when it ends.

To pick up your FREE copy, swing by:

https://phoenixcapitalmarketing.com/BM.html

Posted by Phoenix Capital Research in It's a Bull Market

Forget Stocks, the Bond Market is Signaling Something MAJOR!

By Graham Summers, MBA

It’s all trader games today.

The stock market is closed tomorrow for Thanksgiving. It will also close early on Friday November 25th at 1PM. As one can imagine, most of Wall Street has already left for the holidays.

This means that trading volume will be extremely light. And that means that those few traders/funds who are active will have an easier time moving the market.

As I write this, the S&P 500 is within spitting distance of its 200-day moving average. There’s little doubt in my mind that stocks will make a run for that line sometime over the holiday. 

However, that is a short-term issue. The longer-term issue is that the Treasury market is telling us a severe recession is coming. 

The Treasury is comprised of numerous bonds with different maturation periods. They are:

Treasury Bill Maturation Periods:

4 Weeks

13 Weeks

26 Weeks

52 Weeks

Treasury Note Maturation Periods

2 Years

3 Years

5 Years

7 Years

10 Years

Treasury Bond Maturation Periods

20 Years

30 Years 

When you plot the yield on all of these bonds, you get the “yield curve.” And the difference in yield between various bonds on this curve is one of the most accurate predictors of recession.

Specifically, the difference between the yield on the 10-Year U.S. Treasury and the yield on the 3-month U.S. Treasury. Anytime this difference becomes negative (meaning the 3-month yield is actually higher than the 10-year yield) this indicates a recession is about to hit.

I’ve illustrated this in the chart below.  Anytime the black line falls below the red line, the 10-year 3-month yield curve is “inverted.” This was the case in 1989, 2001, 2007, and 2019: all of those preceded recessions.

It is happening again now. And as you can see, this metric is MORE negative today than it was before the COVID-19 crash as well as the Great Financial Crisis.

Put simply, the yield curve of the Treasury market is predicting a severe recession in the near future, likely the start of 2023.

This is going to force stocks to new lows. I’ll explain why in Friday’s article. Until then… know this: it is highly likely that a recession is going to trigger a major crash in stocks. It’s not a question of “if,” it’s a question of “when.”

If you’ve yet to take steps to prepare for this, we just published a new exclusive special report How to Invest During This Bear Market.

It details the #1 investment to own during the bear market as well as how to invest to potentially generate life changing wealth when it ends.

To pick up your FREE copy, swing by:

https://phoenixcapitalmarketing.com/BM.html
Posted by Phoenix Capital Research in It's a Bull Market

Warning: This is the Most Disturbing Thing I’ve Seen In Years

By Graham Summers, MBA

The consumer is tapping “out.”

Ever since inflation entered the financial system is early 2021, there has been a debate as to when the higher cost of living would hit consumer spending to the point of inducing a recession. 

Sure, consumers can rely on savings or credit to make ends meet in the near-term. However, if inflation remains elevated for a prolonged period, eventually it becomes too much to bear, and the consumer is forced to “tap out” and cut discretionary expenses. That’s when a recession hits.

I mention all of this because the stock market is telling us that the recession has arrived. 

One of the best means of analyzing intra-market developments is ratio work. This consists of comparing the performance of one asset or stock relative to the performance of another.

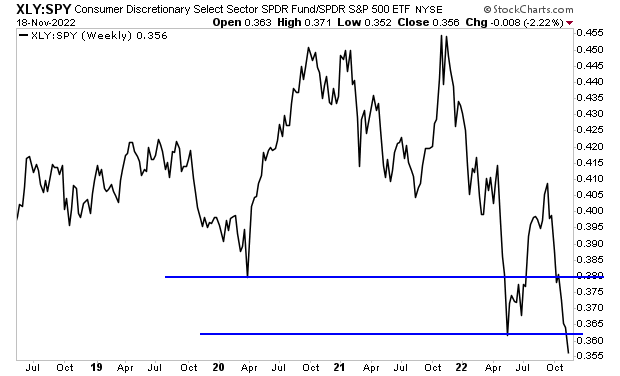
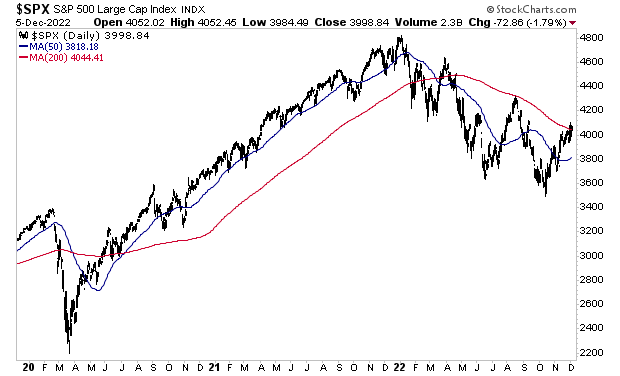
For example, let’s look at the ratio between the Consumer Discretionary ETF (XLY) and the S&P 500 (SPY). During periods of consumer spending strength, this line rises. And during periods of consumer spending weakness this line falls.

Below is a chart of the ratio over the last four years. As you can see, this ratio is dropping like a stone. It is actually lower today than it was at the lows of the March 2020 Crash! 

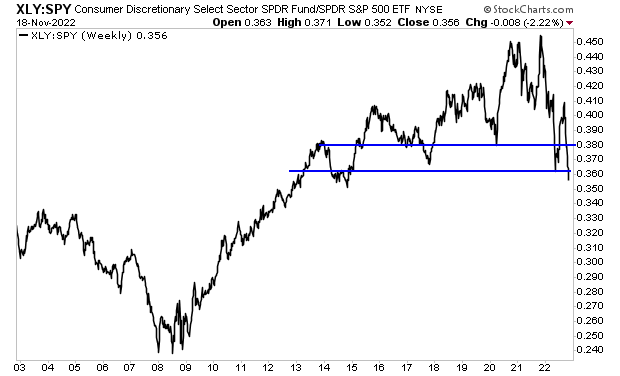
This suggests the consumer is “tapping out” right here and now. The question now is if this is just a slight downturn or the start of a major recession. To answer that, let’s step back and look at a longer-term chart.

From an economics perspective, this is the most disturbing thing I’ve seen in years. It suggests the U.S. is entering its first major recession since the Great Financial Crisis of 2007-2009. 

I think we all remember what happened to stocks during that time: an extraordinary crash in which stocks lost over 50% of their value. 

A crash is coming. And it’s going to make 2008 look like a joke.

If you’ve yet to take steps to prepare for this, we just published a new exclusive special report How to Invest During This Bear Market.

It details the #1 investment to own during the bear market as well as how to invest to potentially generate life changing wealth when it ends.

To pick up your FREE copy, swing by:

https://phoenixcapitalmarketing.com/BM.html
Posted by Phoenix Capital Research in It's a Bull Market
Let’s Cut Through the BS About the Economy Right Here and Now!

Let’s Cut Through the BS About the Economy Right Here and Now!

By Graham Summers, MBA

Last week, I warned you not to trust the positive economic data being put out concerning the U.S. economy.

The reasons for my warning were simple: the data was bunk, made up, and of no real value.

By quick review, ALL of the jobs that were supposedly created in October 2022 were not real jobs; they were created in a government spreadsheet via various accounting gimmicks… not in the economy. And yes, I’m talking about all 261,000 of them.

The inflation data that everyone was so excited about last week was also NOT positive.

Month over Month inflation was 0% in July, 0.1% in August, and 0.4% in September. With that in mind, I ask… “how was a month over month reading of 0.4% in October a great thing? Technically the inflation data was BETTER during the summer!!!”

Moreover, the items that DECLINED in price… allowing the beancounters to make inflation look better than it is, were used cars and trucks, medical care, apparel, and airline fare.

By way of contrast, shelter, gas and food prices all increased.

Again… how is any of that good for the economy?

I realize it might be difficult to believe me here. After all, 99% of mainstream economists and financial media talking heads are saying the exact opposite: the economy is doing fine and inflation is coming down.

So, with that in mind, I ask you to take a look at the following data points. What do they tell you about the TRUE status of the U.S. economy?

· Juul lays off ~1/3rd of its workforce.

· Redfin lays off 13% of its staff.

· Meta to fire 13% of its workforce.

· Twitter lays off ~50% of its workforce.

· Snap lays off 20% of its employees.

· Wayfair: lays off 10% of its corporate team.

· Microsoft fires 1,000 workers.

· Disney to begin layoffs, targeted hiring freeze.

· Re/Max to fire 17% of its workforce.

· Compass to layoff 10% of its workforce.

Let’s be blunt here… corporations implement major layoffs like this during only one kind of economic environment: a recession.

And what impact do you think a recession is going to have on the stock market?

I’ll detail in tomorrow’s article. For now, the key item to note is that the Everything Bubble has burst.

On that note, we are putting together an Executive Summary outlining how to invest in this new bearish environment.

It will be available exclusively to our clients. If you’d like to have a copy delivered to your inbox when it’s completed, you can join the wait-list here.

https://phoenixcapitalmarketing.com/TEB.html

Posted by Phoenix Capital Research in It's a Bull Market

Warning: the Fed Didn’t Pivot Yesterday… If Anything It Doesn’t Need to Anymore

By Graham Summers, MBA

Yesterday I asked, “is the Fed about to hit the PANIC! button like the Bank of England?” 

The markets certainly acted like it: stocks, Treasuries, oil, and gold erupted higher yesterday, fueled by the announcement that the Fed had scheduled an emergency meeting for 11:30AM EST.

It was only a matter of time before Fed Chair Powell would appear and tell the markets that the Fed was reintroducing Quantitative Easing (QE), just as the Bank of England (BoE) had done last week.

Except… Chair Powell didn’t appear. The Fed didn’t make any announcements of any kind except that it was updating its rule regarding debit card transactions.

Debit. Card. Transactions.

Not the reintroduction of QE. Not a slowing or potential end to rate hikes. And certainly not a Fed pivot of any kind.

This is not to say that Fed officials didn’t refrain from making any public appearances yesterday. John Williams, the President of the New York Fed (the branch in charge of market operations) gave a speech in Phoenix Arizona in which he stated:

1)    Inflation is far too high.

2)    Our job [cooling demand and reducing inflationary pressures] is not yet done.

3)    The drop in commodities prices is “not enough” to “bring down” the “broad-based inflation” caused by goods demand as well as labor and services demand.

So… no sign of a pivot there.

If anything, the market’s action yesterday makes a Fed pivot less likely any time soon. With both Treasuries yields AND the $USD falling yesterday, rate and liquidity pressures are much lower than they were last week.

The $USD reversal in particular is a welcome relief as it allowed the British Pound and other currency that were under pressure to rally hard… But this again erases any need for the Fed to pivot.

Bottomline: the Fed will no doubt pivot at some point… but it’s not doing so now. And the market’s action has made the likelihood of a pivot MUCH lower.

So enjoy the relief rally… but don’t plan on it lasting for long. Because the Great Crisis… the one to which 2008 was a warm-up, has finally arrived. 

In 2008 entire banks went bust. In 2022, entire countries will do so.

And it is inflation that triggered it!

On that note, we published a Special Investment Report concerning FIVE secret investments you can use to make inflation pay you as it rips through the financial system in the months ahead.

The report is titled Survive the Inflationary Storm. And it explains in very simply terms how to make inflation PAY YOU.

We made 100 copies available to the public.

Today is the last day this report is available to the general public.

To pick up yours, swing by:

https://phoenixcapitalmarketing.com/inflationstorm.html
Best Regards,

Posted by Phoenix Capital Research in It's a Bull Market

Warning: the Fed Didn’t Pivot Yesterday… If Anything It Doesn’t Need to Anymore

By Graham Summers, MBA

Yesterday I asked, “is the Fed about to hit the PANIC! button like the Bank of England?” 

The markets certainly acted like it: stocks, Treasuries, oil, and gold erupted higher yesterday, fueled by the announcement that the Fed had scheduled an emergency meeting for 11:30AM EST.

It was only a matter of time before Fed Chair Powell would appear and tell the markets that the Fed was reintroducing Quantitative Easing (QE), just as the Bank of England (BoE) had done last week.

Except… Chair Powell didn’t appear. The Fed didn’t make any announcements of any kind except that it was updating its rule regarding debit card transactions.

Debit. Card. Transactions.

Not the reintroduction of QE. Not a slowing or potential end to rate hikes. And certainly not a Fed pivot of any kind.

This is not to say that Fed officials didn’t refrain from making any public appearances yesterday. John Williams, the President of the New York Fed (the branch in charge of market operations) gave a speech in Phoenix Arizona in which he stated:

1)    Inflation is far too high.

2)    Our job [cooling demand and reducing inflationary pressures] is not yet done.

3)    The drop in commodities prices is “not enough” to “bring down” the “broad-based inflation” caused by goods demand as well as labor and services demand.

So… no sign of a pivot there.

If anything, the market’s action yesterday makes a Fed pivot less likely any time soon. With both Treasuries yields AND the $USD falling yesterday, rate and liquidity pressures are much lower than they were last week.

The $USD reversal in particular is a welcome relief as it allowed the British Pound and other currency that were under pressure to rally hard… But this again erases any need for the Fed to pivot.

Bottomline: the Fed will no doubt pivot at some point… but it’s not doing so now. And the market’s action has made the likelihood of a pivot MUCH lower.

So enjoy the relief rally… but don’t plan on it lasting for long. Because the Great Crisis… the one to which 2008 was a warm-up, has finally arrived. 

In 2008 entire banks went bust. In 2022, entire countries will do so.

And it is inflation that triggered it!

On that note, we published a Special Investment Report concerning FIVE secret investments you can use to make inflation pay you as it rips through the financial system in the months ahead.

The report is titled Survive the Inflationary Storm. And it explains in very simply terms how to make inflation PAY YOU.

We made 100 copies available to the public.

Today is the last day this report is available to the general public.

To pick up yours, swing by:

https://phoenixcapitalmarketing.com/inflationstorm.html
Best Regards,

Posted by Phoenix Capital Research in It's a Bull Market

Did the U.K. Just Lose All Credibility With the Markets?

Two weeks ago, the new government in the U.K. introduced a series of major tax cuts aimed at stimulating the economy.

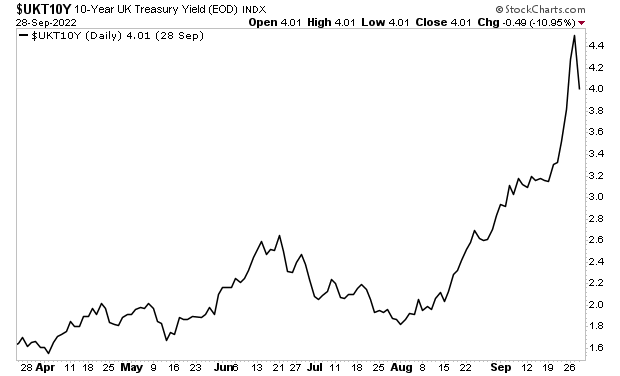
Tax cuts mean less tax revenues, which in turn means less money available to pay the interest on the country’s debt. Bond yields in the U.K. were already rising due to inflation and monetary tightening from the BoE. The announcement of tax cuts triggered a panic.

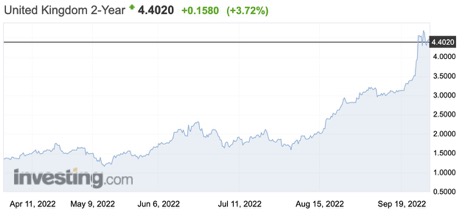
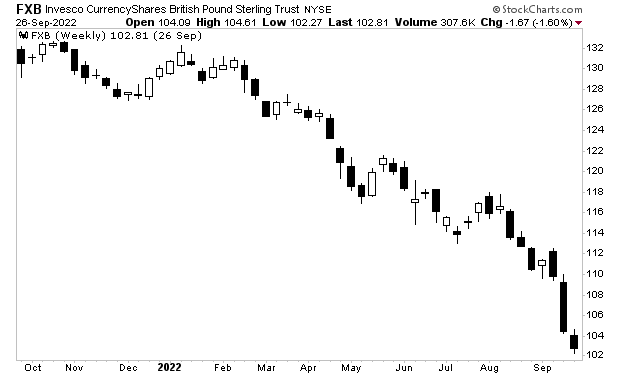
The yield on the 2-Year U.K. government bond exploded higher from 3.5% to 4.4% in a matter of days.

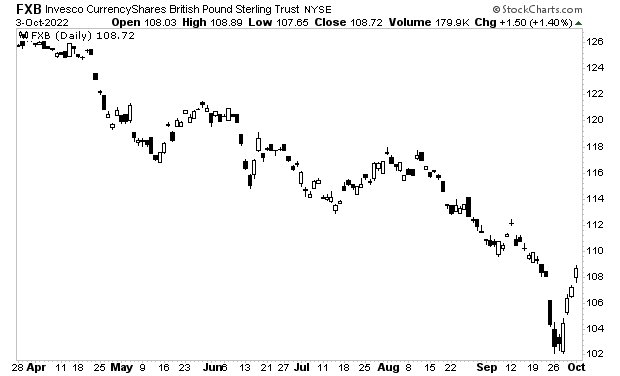
And the British Pound nosedived.

Chart, waterfall chart

Description automatically generated

Remember, we’re not talking about volatility in a stock here… we’re talking about the GOVERNMENT BOND and CURRENCY of the FIFTH LARGEST ECONOMY IN THE WORLD!

Pension funds, which invest trillions of pounds’ worth of capital in the U.K. and which were heavily invested in U.K. government bonds, were on the verge of going belly up. So, the Bank of England panicked and announced it would introduce UNLIMITED QE again.

That is not a typo. The Bank of England is the first major central bank to be broken by the markets. And it won’t be the last.

The BoE announced that it will begin “unlimited QE” to support U.K. bonds from September 28th until October 14th.

U.K. sovereign bond yields dropped on the news.

Chart

Description automatically generated

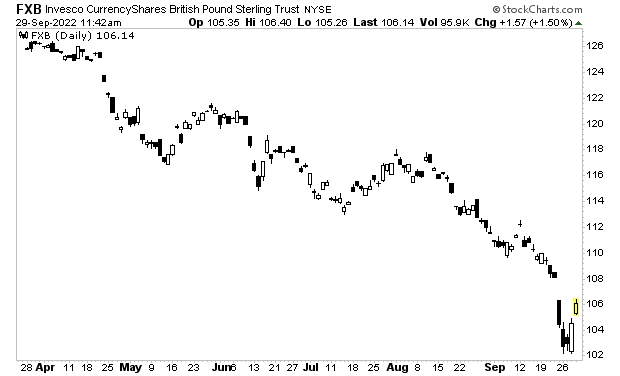
And the British pound rallied.

Chart, scatter chart

Description automatically generated

What happens here is critical. If yields on U.K, bonds begin to rally ,and the British Pound begins to collapse again… it means the BoE has LOST CREDIBILITY.

Yes, we’re talking about a MAJOR central bank for a developed nation losing credibility with the markets.

As I write this, it is too early to tell. But this is THE most important situation in the world right now. If things go south here, the U.K. will go bust.

The British Pound has managed to “close the gap” from the Monday decline, but it’s not out of the woods by any stretch. You would think that a major central bank saying it will do “whatever it takes” to defend its currency would have a bigger impact. But the pound remains in a downtrend.

Chart, scatter chart

Description automatically generated

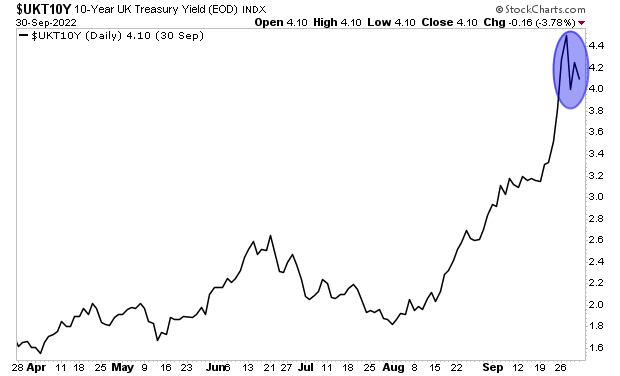
Moreover, the yields on British Gilts have come down from their panic highs but remain at EXTREMELY elevated levels. The crisis here is not over by any stretch.

Chart

Description automatically generated

What happens here is critical. If the Pound begins to fall again, and yields on Gilts rise, then the great Crisis of our lifetimes, the crisis in which entire countries go bust, is here.

And it is inflation that triggered it!

On that note, we published a Special Investment Report concerning FIVE secret investments you can use to make inflation pay you as it rips through the financial system in the months ahead.

The report is titled Survive the Inflationary Storm. And it explains in very simply terms how to make inflation PAY YOU.

We made 100 copies available to the public.

Today is the last day this report is available to the general public.

To pick up yours, swing by:

https://phoenixcapitalmarketing.com/inflationstorm.html
Best Regards,

Posted by Phoenix Capital Research in It's a Bull Market