Inflation

Why the Fed Has Failed to End Inflation… and What It Means For Your Portfolio

By Graham Summers, MBA

The Fed has raised interest rates from 0.25% to 5.25% in the span of 16 months.

And yet…inflation has yet to disappear in any significant fashion.

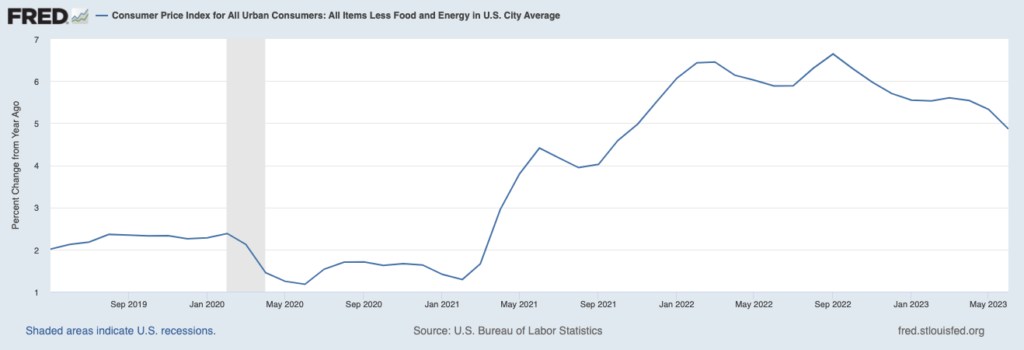
As I noted earlier this week, the ONLY data points in the CPI that are DOWN year over year are energy prices. When you strip out energy and food prices you find that core CPI is only slightly down. As I write this, it’s still clocking in at 4.8%… after fluctuating around 5% for most of 2023.
Moreover, asset inflation is out of control.

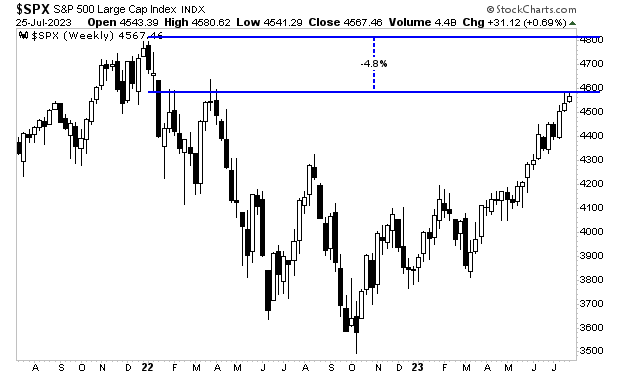
Stocks are less than 5% off their all time highs, despite one of the most aggressive rate hike cycles in history!
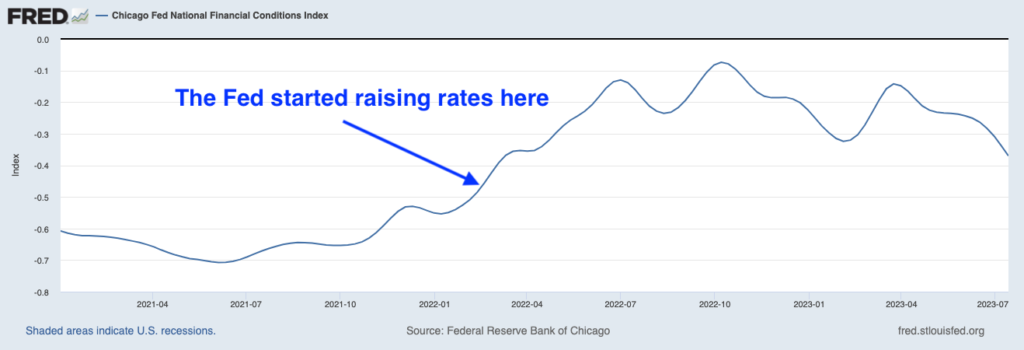
While financial conditions are roughly as loose as they were BEFORE the Fed started raising rates!
What’s going on here?

What’s going on is that the Fed is repeating the same mistake it initially made during the last major inflationary bout in the U.S. in the 1970s: focusing on rate hikes as opposed to draining excess reserves/ liquidity from the financial system.

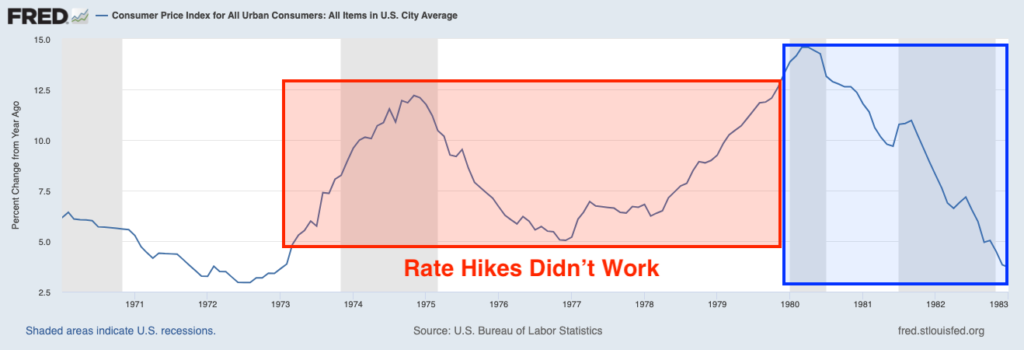
During the first round of inflation from 1972-1975, the official inflation measure, the Consumer Price Index or CPI, rose from 3.3% to 11.1%. During this period, the Fed, chaired by Arthur Burns, attempted to rein in inflation using rate hikes. This succeeded in triggering a recession, but failed to end inflation: CPI only fell to 5.7% in 1976 before rebounding and eventually peaking at 13% in 1980.

Burns was replaced William Miller as Fed Chair in 1978, but Miller only lasted a year, as his efforts to end inflation proved similarly futile: the Fed raised rates from 6.75% to 10.5% during Miller’s tenure, but inflation continued to rise from 7.6% to 11.3% 

It was only when Paul Volcker took the reins as Fed Chair in August 1979 that things changed. Volcker shifted the Fed’s focus from rate hikes to draining excess reserves/ liquidity from the financial system. The goal was to remove the froth from the financial system, while letting rates move in a wider range in order to tighten policy to the point that inflation finally disappeared.

The effect was a severe recession (July 1981-November 1982), but CPI also came down, eventually falling to ~3% in 1983. 

The below chart of CPI in the 1970s is clear: rate hikes didn’t end inflation… but draining excess reserves did.
Unfortunately for us today, the Fed is repeating the EXACT same mistake it made from 1972-1979. And those investors who are properly positioned to profit from this mistake will do extremely well as I’ll outline in tomorrow’s article.

In the meantime, if you’re in the market for someone who can help you profit from the Fed’s blunders, I can help you not only thrive but achieve tremendous financial success.

This opens the door to some VERY inflationary surprises in the near future. And those who are positioned to profit from this could see some absolutely stunning returns.

We recently outlined a unique “of the radar” investment that will could EXPLODE higher as inflation turns back up. We detail this investment in an investment report called  Billionaire’s “Green Gold.”

It details the actions of a family of billionaires who literally made their fortunes investing in inflationary assets. And they just became involved in a mid-cap company that has the potential to TRIPLE in value in the coming months.

Normally this report would be sold for $249. But we are making it FREE to anyone who joins our Daily Market Commentary Gains Pains & Capital.

To pick up your copy, swing by:

https://phoenixcapitalmarketing.com/GreenGold.html
Posted by Phoenix Capital Research in Central Bank Insanity, Inflation

Warning: Inflation May Have Just Bottomed in 2023

By Graham Summers, MBA

Yesterday, I noted that inflation has very likely bottomed for 2023.

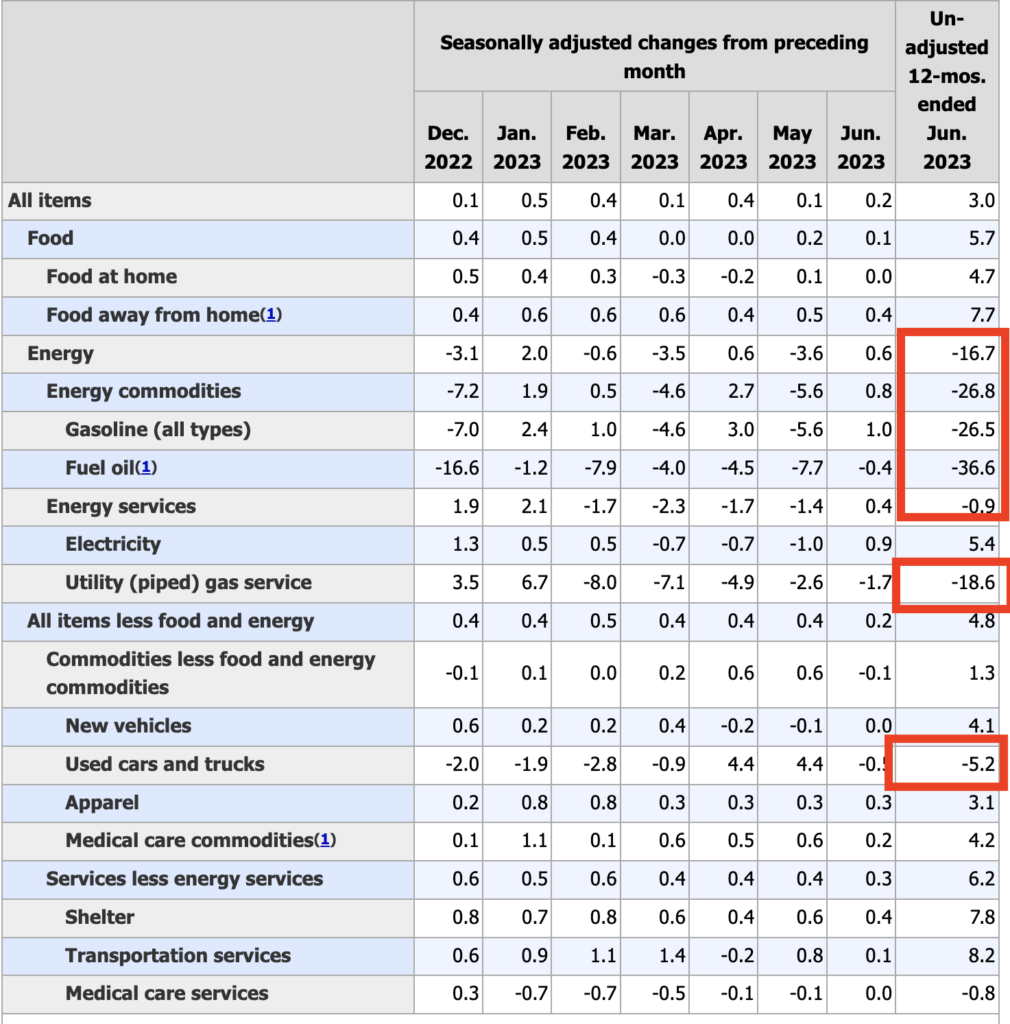
No one in the media is discussing this, but the only parts of the inflation data that is actually falling are energy prices.

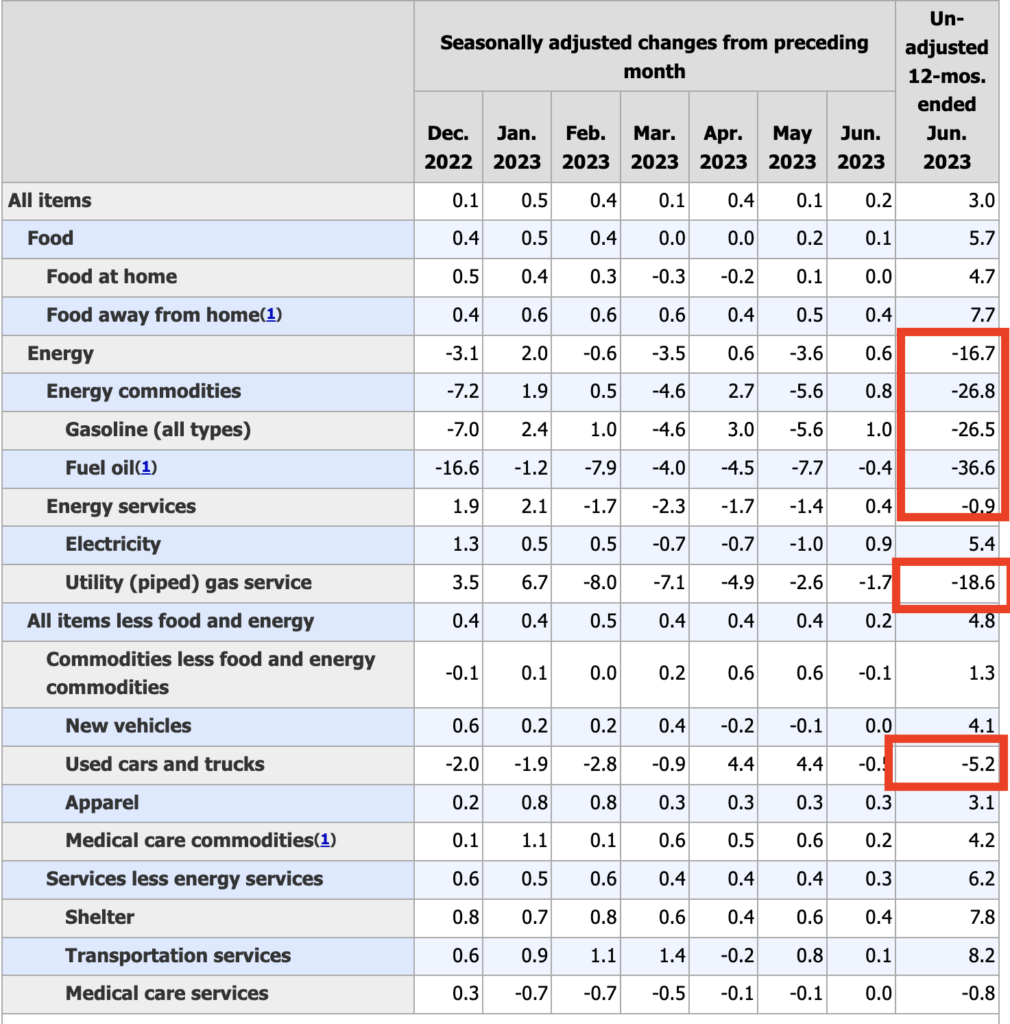
See for yourself.

Everything else is still going UP in price, though the pace is slower (this doesn’t stop the media from claiming inflation is falling though).

However, by the look of things, energy prices are bottoming here, particularly in Year over Year comparables.

You see, the inflation data published in the U.S. is based on year over year comparisons. When the Consumer Price Index (CPI) comes out at 5%, what it’s really stating is that a basket of goods and services costs ~5% more currently than it did a year ago.

This is called the base effect: a comparison between two data points in which the current one is expressed as a ratio of the older one. And it can result in some pretty strange circumstances if you’re not careful.

Situations like the one we’re in today.

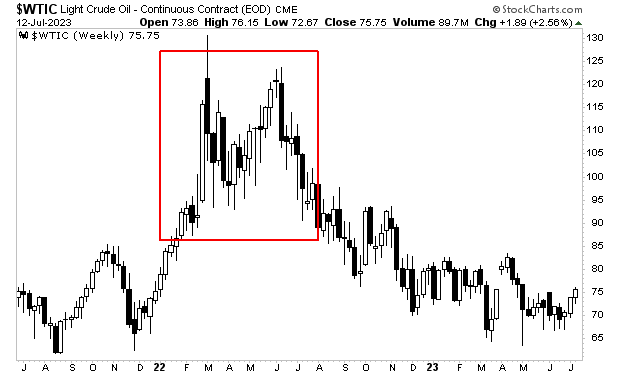
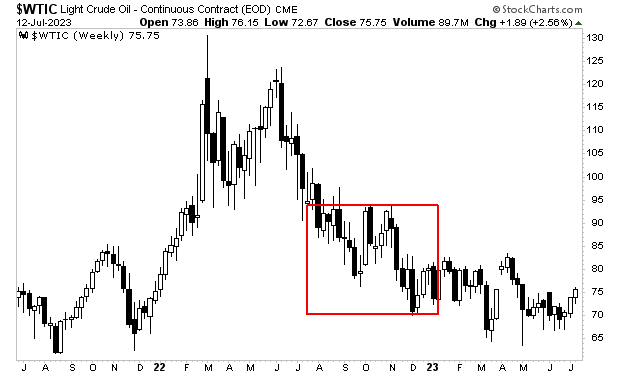
Let’s wind the clocks back to the first quarter of 2022. Oil prices were rising rapidly due to inflation as the Fed had yet to end its Quantitative Easing (QE) program, let alone raise interest rates. Then Russia invaded Ukraine, and oil spiked even higher to $130 a barrel as the financial world grew terrified of large-scale oil production disruptions.

I’ve illustrated this time period on the below chart of oil prices with a red rectangle.

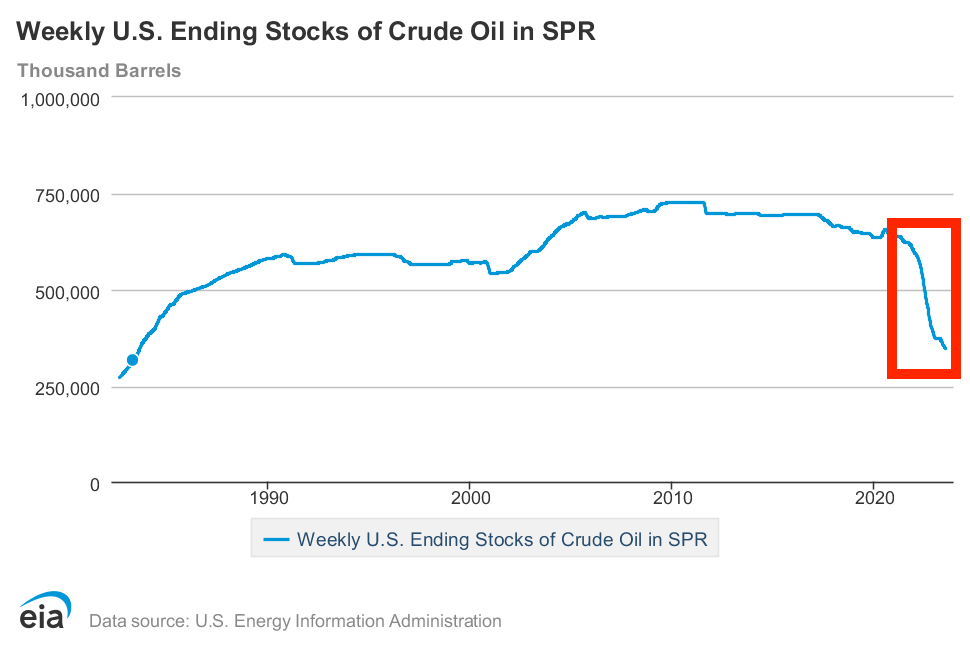
The rise in oil prices then halted as it became clear that Russia’s war with Ukraine wouldn’t disrupt global oil production by much if at all (Russia would continue selling oil via back-channels to India and other countries). Another factor that stopped oil prices from rising was the fact the Biden administration dumped 292 million barrels of oil on the market by draining the Strategic Petroleum Reserve (SPR).

I’ve been accused of playing politics with this data point, but the chart is clear. President Biden took office in January 2021. At that time the SPR had 638 million barrels of oil. What followed was the largest drop in the SPR’s history, with the SPR declining to 346 million barrels of oil where it sits today. That is a decline of 292 MILLION barrels of oil.

Add it all up, and the end result is that since June 2022, oil prices have declined from $130 a barrel down to the upper $60s/ lower $70s per barrel. The result of this, as far as the CPI is concerned, is that on a year over year basis, for the entirety of 1H23, we have been comparing oil prices in the blue rectangle to oil prices in the red rectangle. As a result of this, energy inflation is down sharply.

This trend is now ending as we work our way into the second half of 2023. Going forward, oil prices on a year over year basis will be compared to the prices in the red rectangle in the chart below.

Put simply, on a year over year basis, the massive drop in energy prices that has lowered overall CPI considerably will be ending. And since energy prices are the ONLY part of the CPI data that has been declining… it is highly likely that the inflation data is bottoming here… or at the very least, won’t be declining much more.

This opens the door to some VERY inflationary surprises in the near future. And those who are positioned to profit from this could see some absolutely stunning returns.

We recently outlined a unique “of the radar” investment that will could EXPLODE higher as inflation turns back up. We detail this investment in an investment report called  Billionaire’s “Green Gold.”

It details the actions of a family of billionaires who literally made their fortunes investing in inflationary assets. And they just became involved in a mid-cap company that has the potential to TRIPLE in value in the coming months.

Normally this report would be sold for $249. But we are making it FREE to anyone who joins our Daily Market Commentary Gains Pains & Capital.

To pick up your copy, swing by:

https://phoenixcapitalmarketing.com/GreenGold.html

Posted by Phoenix Capital Research in Central Bank Insanity, Inflation

If You’re Worried About Inflation, You Need to Read This

By Graham Summers, MBA

Inflation has very likely bottomed for 2023. 

The inflation data published in the U.S. is based on year over year comparisons. When the Consumer Price Index (CPI) comes out at 5%, what it’s really stating is that a basket of goods and services costs ~5% more currently than it did a year ago. 

This is called the base effect: a comparison between two data points in which the current one is expressed as a ratio of the older one. And it can result in some pretty strange circumstances if you’re not careful.

Situations like the one we’re in today.

For most of the first half of 2023, inflation, as measured by the year over year comparison for the CPI has been trending down. However, as I’ve noted repeatedly, the only part of the inflationary data that is declining is energy prices (well that and used car prices).

See for yourself.

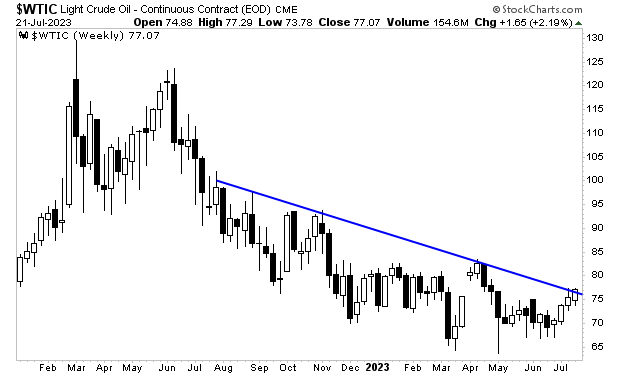
I mention this, because it is increasingly looking as though oil prices have bottomed.

Oil has spent much of the last 18 months in a downtrend. But that downtrend is about to be broke. 

If oil prices rip higher from here, then the inflationary data will begin to turn back upwards. Remember, energy prices are the ONLY part of the CPI that are DOWN. The price of everything else continues to RISE, albeit a slower rate.

Many investors will be caught offsides here. Don’t be one of them!

We recently outlined a unique “of the radar” investment that will could EXPLODE higher as inflation turns back up. We detail this investment in an investment report called  Billionaire’s “Green Gold.”

It details the actions of a family of billionaires who literally made their fortunes investing in inflationary assets. And they just became involved in a mid-cap company that has the potential to TRIPLE in value in the coming months.

Normally this report would be sold for $249. But we are making it FREE to anyone who joins our Daily Market Commentary Gains Pains & Capital.

To pick up your copy, swing by:

https://phoenixcapitalmarketing.com/GreenGold.html

Posted by Phoenix Capital Research in Inflation

This Might Be the Most Important Chart in the World Right Now

By Graham Summers, MBA

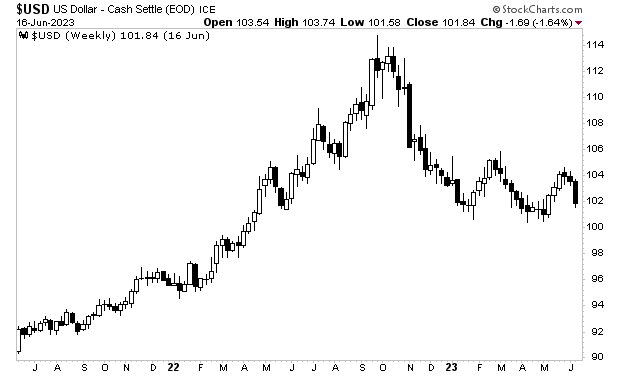
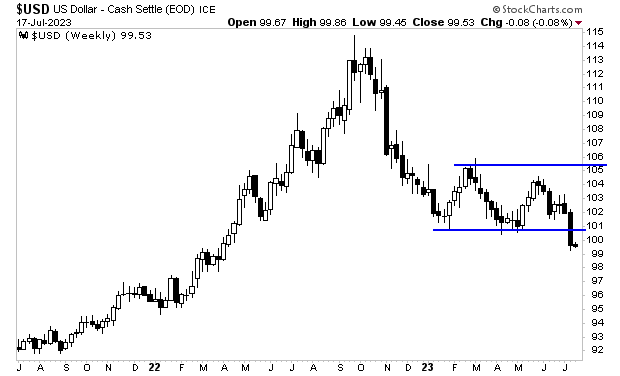
The $USD is breaking down… in a big way.

The greenback peaked in October 2022. After plunging some 11% from October 2022 to January 2023, the $USD has since been moving in a range or what trader’s would call a “consolidation phase.”

There are a couple key issues to consider when you look at a consolidation phase. They are:

1) How long it lasts.

2) Whether the eventual breakout is a continuation or a reversal of the prior trend.

Regarding #1, the length of a consolidation phase is closely correlated with the significance of the eventual breakout: the longer the consolidation phase, the more significant the breakout.

In the case of the $USD, it’s been in a consolidation phase for SIX MONTHS. That is a significant length of time. And it tells us that the eventual breakout is of major importance.

Regarding #2, it’s critical to note whether an eventual breakout continues the trend the asset was in prior to consolidating or whether it reverses said trend. If the breakout is a continuation, then the asset is in a MAJOR trend, and the consolidation was simply a kind of “breather” between major moves.

That appears to be the case with the $USD today. The trend was down before it began consolidating. And now it is breaking down in a big way. This suggests that the $USD is in a MAJOR downtrend that will last for some time.

Finally, remember we are talking about the $USD here… arguably the most important asset in the world. This breakdown will have a MAJOR impact on the markets, particularly those that benefit from higher inflation/ a weaker $USD.

We recently outlined one such investment that should benefit GREATLY from a weaker $USD in an investment report called Billionaire’s “Green Gold.”

It details the actions of a family of billionaires who literally made their fortunes investing in assets that outperform during this kind of environment. And they just became involved in a mid-cap company that has the potential to TRIPLE in value in the coming months.

Normally this report would be sold for $249. But we are making it FREE to anyone who joins our Daily Market Commentary Gains Pains & Capital.

To pick up your copy, swing by:

https://phoenixcapitalmarketing.com/GreenGold.html
Posted by Phoenix Capital Research in Inflation, The Dollar

What Is Happening In the U.S. Today

By Graham Summers, MBA

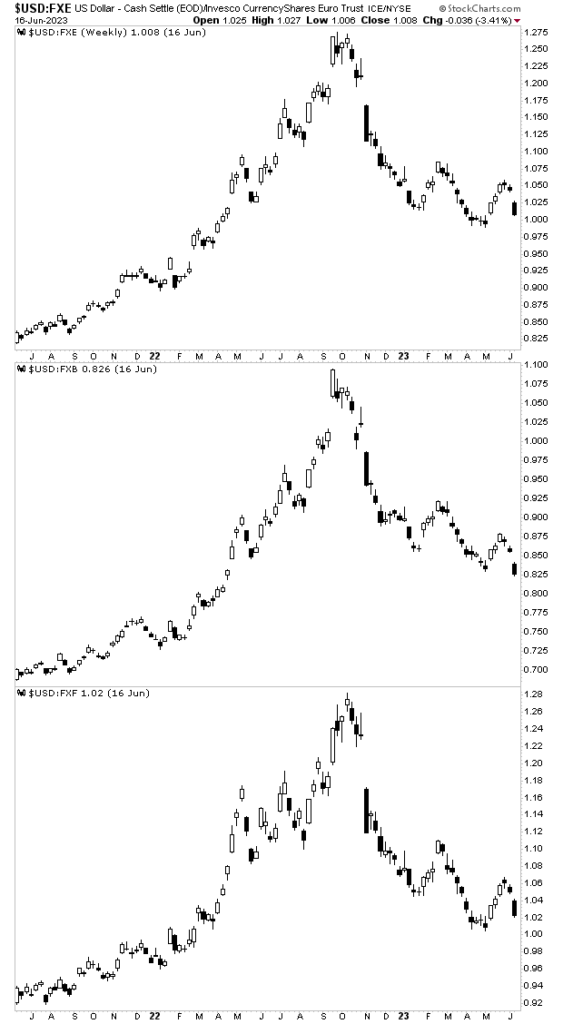
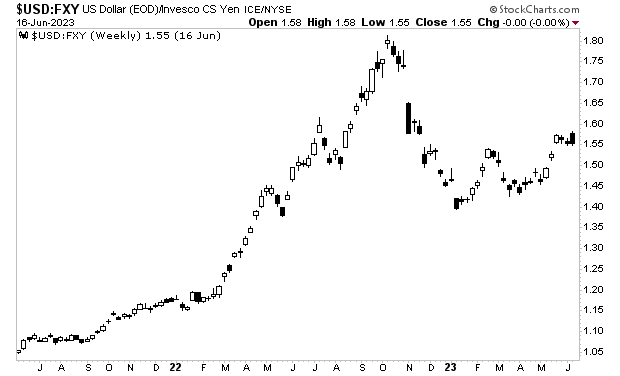
As I’ve noted in our last two articles, the $USD has begun a significant decline against most major currencies (the Euro, the Pound and the Franc). And the only reason it is showing relative strength against the Yen is because Japan’s central bank continues to ease monetary conditions.

What’s happening here? The $USD should be performing well based on interest rates as well as how far along the U.S.’s central bank is in its fight against inflation.

I believe what is happening is that the world is increasingly aware that the U.S. has become an emerging market.

Historically, the U.S. was held up as the eminent developed nation with strong and stable institutions, the Rule of Law, and a dynamic economy.

No longer.

It is now clear that many of our most significant institutions in the U.S. are corrupt. And I’m not talking about the typical corruption one can assume from any organization involving people and power. I’m talking about 3rd world, banana republic levels of corruption, e.g. interfering with elections, jailing political adversaries, censoring free speech, etc.

Similarly, the Rule of Law in the U.S. is now more of a catch phrase than a reality. There are clear double standards applied on a local, state and federal level when it comes to the law. The politically connected/ chosen can commit everything from felonies to outright treason with little if any jail time. And in many cases, those involved in undermining their political adversaries even when it was illegal/ treasonous received book deals and prime time TV slots as opposed to going to prison.

Again, this the domain of 3rd world banana republics. 

The U.S. economy has similarly entered a state of secular decline. The U.S. once was the manufacturing/ industrial capital of the world. It’s now a hollowed out, socialist economy that relies on other regimes (many of them hostile to the U.S.) for its resources and economic needs.

More and more Americans are paid simply to not work. Of those that do work, many take no pride in their efforts. It has become a running joke to post videos of goofing off at the office/ pretending to work/ faking productivity. Anyone who runs a business knows how hard it is to find committed, hard working people.

Perhaps nowhere are the above issues as obvious as in the U.S.’s financial status.

The U.S. now has a Debt to GDP ratio of over 120%. The government is running the largest peacetime deficit relative to GDP in history. Is the government trying to rein this in? Not in the slightest. The new Debt Deal removes all spending cuts through 2024.

Meanwhile, basic services (roads, bridges, etc) are crumbling. Go to any major U.S. airport or drive down any major U.S. highway and you’re looking at something that was a high quality/ top of the line project back in the 1950s.

Abject corruption, a lack of the Rule of Law, massive debt, massive deficits, crumbling infrastructure. These are the hallmarks of an emerging market. So is it any surprise that the U.S. dollar is behaving like an emerging market currency?

I’m not saying that other currencies/ economies are much better (if better at all)… I’m simply noting that the U.S. is far worse than ever before. On a relative basis, all of the things that made the U.S. an exceptional place are now of questionable quality/ credibility.

So why wouldn’t the U.S. currency be the same? Why wouldn’t the $USD become weaker, lose more and more purchasing power, and ultimately no longer serve as a storehouse of value?

For those of you who are upset by all of this, it’s time to take your financial future into your own hands

Indeed, this kind of tectonic shift represents a “once in a lifetime” opportunity. Some investments are going to produce fortunes. Others will lose money for years… if not decades. And those investors who are positioned correctly for this will thrive while others struggle.

We recently outlined a unique “of the radar” investment that will outperform in this new economic landscape in an investment report called Billionaire’s “Green Gold.”

It details the actions of a family of billionaires who literally made their fortunes investing in emerging markets. And they just became involved in a mid-cap company that has the potential to TRIPLE in value in the coming months.

Normally this report would be sold for $249. But we are making it FREE to anyone who joins our Daily Market Commentary Gains Pains & Capital.

To pick up your copy, swing by:

https://phoenixcapitalmarketing.com/GreenGold.html
Posted by Phoenix Capital Research in Inflation

The U.S. is Now an Emerging Market

By Graham Summers, MBA

As I’ve noted in our last two articles, the $USD has begun a significant decline against most major currencies (the Euro, the Pound and the Franc). And the only reason it is showing relative strength against the Yen is because Japan’s central bank continues to ease monetary conditions.

What’s happening here? The $USD should be performing well based on interest rates as well as how far along the U.S.’s central bank is in its fight against inflation.

I believe what is happening is that the world is increasingly aware that the U.S. has become an emerging market.

Historically, the U.S. was held up as the eminent developed nation with strong and stable institutions, the Rule of Law, and a dynamic economy.

No longer.

It is now clear that many of our most significant institutions in the U.S. are corrupt. And I’m not talking about the typical corruption one can assume from any organization involving people and power. I’m talking about 3rd world, banana republic levels of corruption, e.g. interfering with elections, jailing political adversaries, censoring free speech, etc.

Similarly, the Rule of Law in the U.S. is now more of a catch phrase than a reality. There are clear double standards applied on a local, state and federal level when it comes to the law. The politically connected/ chosen can commit everything from felonies to outright treason with little if any jail time. And in many cases, those involved in undermining their political adversaries even when it was illegal/ treasonous received book deals and prime time TV slots as opposed to going to prison.

Again, this the domain of 3rd world banana republics. 

The U.S. economy has similarly entered a state of secular decline. The U.S. once was the manufacturing/ industrial capital of the world. It’s now a hollowed out, socialist economy that relies on other regimes (many of them hostile to the U.S.) for its resources and economic needs.

More and more Americans are paid simply to not work. Of those that do work, many take no pride in their efforts. It has become a running joke to post videos of goofing off at the office/ pretending to work/ faking productivity. Anyone who runs a business knows how hard it is to find committed, hard working people.

Perhaps nowhere are the above issues as obvious as in the U.S.’s financial status.

The U.S. now has a Debt to GDP ratio of over 120%. The government is running the largest peacetime deficit relative to GDP in history. Is the government trying to rein this in? Not in the slightest. The new Debt Deal removes all spending cuts through 2024.

Meanwhile, basic services (roads, bridges, etc) are crumbling. Go to any major U.S. airport or drive down any major U.S. highway and you’re looking at something that was a high quality/ top of the line project back in the 1950s.

Abject corruption, a lack of the Rule of Law, massive debt, massive deficits, crumbling infrastructure. These are the hallmarks of an emerging market. So is it any surprise that the U.S. dollar is behaving like an emerging market currency?

I’m not saying that other currencies/ economies are much better (if better at all)… I’m simply noting that the U.S. is far worse than ever before. On a relative basis, all of the things that made the U.S. an exceptional place are now of questionable quality/ credibility.

So why wouldn’t the U.S. currency be the same? Why wouldn’t the $USD become weaker, lose more and more purchasing power, and ultimately no longer serve as a storehouse of value?

For those of you who are upset by all of this, it’s time to take your financial future into your own hands

Indeed, this kind of tectonic shift represents a “once in a lifetime” opportunity. Some investments are going to produce fortunes. Others will lose money for years… if not decades. And those investors who are positioned correctly for this will thrive while others struggle.

We recently outlined a unique “of the radar” investment that will outperform in this new economic landscape in an investment report called Billionaire’s “Green Gold.”

It details the actions of a family of billionaires who literally made their fortunes investing in emerging markets. And they just became involved in a mid-cap company that has the potential to TRIPLE in value in the coming months.

Normally this report would be sold for $249. But we are making it FREE to anyone who joins our Daily Market Commentary Gains Pains & Capital.

To pick up your copy, swing by:

https://phoenixcapitalmarketing.com/GreenGold.html
Posted by Phoenix Capital Research in Inflation

Is the US Dollar Losing Its Reserve Currency Status Right Before Our Eyes? Pt. 2

By Graham Summers, MBA

Last week I outlined a major development in the currency markets.

That development?

That the U.S. dollar has begun to decline against nearly every major currency (the Euro, Pound, and the Franc). The U.S. dollar peaked in October 2022 against ALL of these currencies. It has since entered a steep decline, losing ~20% of its value against each of these currencies.

Indeed, the only currency against which the $USD has demonstrated any strength is the Yen… and that’s only in the last few months as it became clear that the Bank of Japan would continue to printing money/ maintaining its easy monetary policies. But even then, the U.S. dollar is still significantly lower in value from its prior peak.

What is happening here?

From a fundamental perspective, the $USD should be stronger than these other currencies. For one thing, interest rates are higher on the $USD (5.25% vs. 3.% for the Euro, 5% for the Pound and 1.75% for the Franc).

Moreover, the U.S. central bank, the Federal Reserve or Fed, is supposedly farther along in its quest to end inflation than the other central banks that issue those other currencies: the Fed has just announced a skip or pause in rate hikes, while the European Central Bank, Bank of England and Swiss National Bank are still hiking rates.

So what is happening here?

Is the U.S. dollar losing its reserve currency status before our very eyes? Why is the greenback so weak when it should be quite strong?

I think I know what it happening here. And I’ll detail what in tomorrow’s commentary. In the meantime, there are many different ways to profit from this situation. We recently outlined a unique “of the radar” one favored by a family of billionaires in an investment report called Billionaire’s “Green Gold.”

Normally this report would be sold for $249. But we are making it FREE to anyone who joins our Daily Market Commentary Gains Pains & Capital.

To pick up your copy, swing by:

https://phoenixcapitalmarketing.com/GreenGold.html
Posted by Phoenix Capital Research in Inflation

Is the $USD Losing Its Reserve Currency Status Right Before Our Eyes? Pt. 1

By Graham Summers, MBA

Something major is brewing in the currency markets.

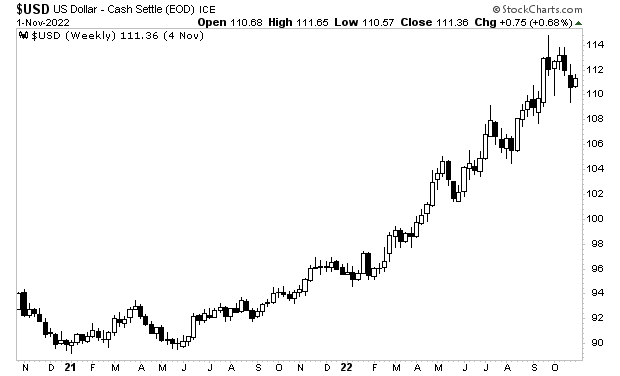
Throughout much of 2021 and 2022, the $USD rallied aggressively, rising from 90 to 112. The driving force behind this move was the Fed’s tightening of monetary policy: the $USD was becoming increasingly attractive relative to other currencies based on higher rates.

However, something changed in October of 2022. The $USD began to break down. And not just a little. The greenback dropped violently from 112 to 100 in the span of a few months.

Since that time, the $USD has struggled to catch a bid against every major currency.

The $USD has been dropping relative to the Euro, the British Pound, and the Swiss Franc. And it is doing this despite the fact that rates are higher in the U.S. than in any of the countries that issue these other currencies.

Indeed, the only currency against which the $USD has demonstrated any strength is the Yen… and that’s only in the last few months as it became clear that the Bank of Japan would continue to printing money/ maintaining its easy monetary policies.

As I mentioned earlier in this commentary, something MAJOR is brewing in the currency markets. Currencies go up and down all the time… but when you see a currency dropping like a stone against every major currency, you know something BIG is happening.

I think I know what it is. And I’ll detail what in tomorrow’s commentary. In the meantime, there are many different ways to profit from this situation. We recently outlined a unique “of the radar” one favored by a family of billionaires in an investment report called Billionaire’s “Green Gold.”

Normally this report would be sold for $249. But we are making it FREE to anyone who joins our Daily Market Commentary Gains Pains & Capital.

To pick up your copy, swing by:

https://phoenixcapitalmarketing.com/GreenGold.html
Posted by Phoenix Capital Research in Inflation

Guess Who is Driving Inflation Now (and Minting Profits For Smart Investors)

By Graham Summers, MBA

There are two primary reasons why inflation has remained so persistent despite the Fed raising rates from 0.25% to 5.25% in the span of 14 months.

1)     The Fed is using the wrong tools to end inflation.

2)    The Federal Government continues COVID-19 emergency levels of spending. 

Yesterday we discussed #1. Today we’re going to dissect #2. 

Between 2020 and 2022, the Fed printed roughly $5 trillion. The Federal Government spent/ printed another $6 trillion.

Over the last 14 months, Fed has raised rated from 0.25% to 5.25% while draining $500 billion in liquidity from the financial system. In simple terms, the Fed has stopped printing money and is tightening monetary policy.

The Federal Government has not altered its money printing/ spending. In fact, courtesy of the Debt Deal that was just signed into law, the Federal Government has NORMALIZED the emergency levels of stimulus/ spending it introduced during the pandemic.

The government is financed via tax revenues. If spending is greater than tax revenues, then the government issues debt to finance its spending. Despite pulling in record taxes in 2021 (and 2022’s tax haul is looking to be ever greater), the U.S. continues to run $1+ trillion deficits.

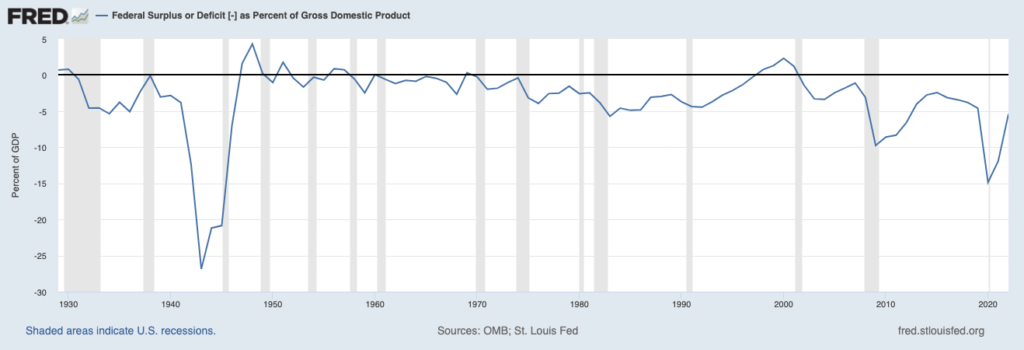
Relative to GDP, the deficit is greater than that the government ran during the depths of the 2008 crisis. Indeed, you have to go back to World War II to find a period in which the deficit relative to GDP was greater! And bear in mind, the government is currently running this kind of deficit TWO YEARS after the recession associated with the shutdowns ended!

This image has an empty alt attribute; its file name is GPC613231-1024x350.png

And thanks to the Debt Deal, this level of stimulus/ spending will become normalized.

Section 265 of the bill notes that the OMB (Office of Management and Budget) director has sole waiver authority to spend whatever money the government wishes if said spending is deemed “necessary for program delivery.” (H/T. Rep Nance Mace for catching this).

The OMB is the part of the Executive Branch in charge of “overseeing the implementation” of the President’s “vision” for the economy. The OMB director is appointed by the President. And according to the current version of the debt dealing congress is voting on, this person has “sole waiver” authority on spending caps.

Put simply, she (the current OMB director is Shalanda Young), is permitted to spend as much money as President Biden wants, provided the spending is deemed “necessary” to deliver on programs that meet his vision for the economy.

That single line negates any and all cuts or spending caps laid out elsewhere in the debt deal. It’s akin to someone writing “everything else in this 99-page bill is non-binding.”

In the very simplest of terms, this deal, if it passes, would normalize the government’s COVID-19 level of spending. This would be highly inflationary. And it would make the Fed’s job of tackling inflation that much more difficult. 

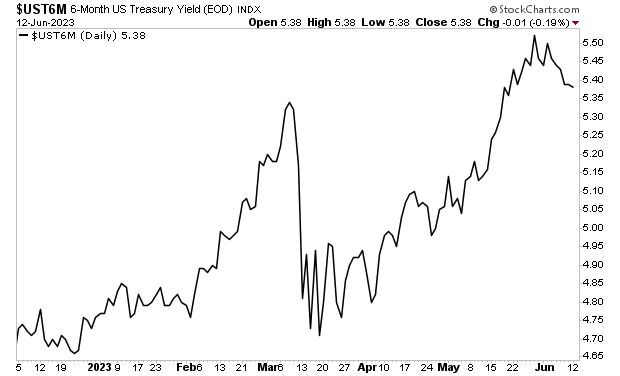
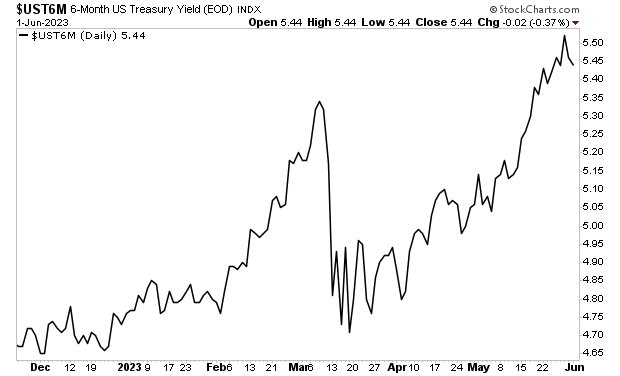
This is why the yield on the 6-month U.S. Treasury bill has soared to new highs…

This image has an empty alt attribute; its file name is GPC613232.png

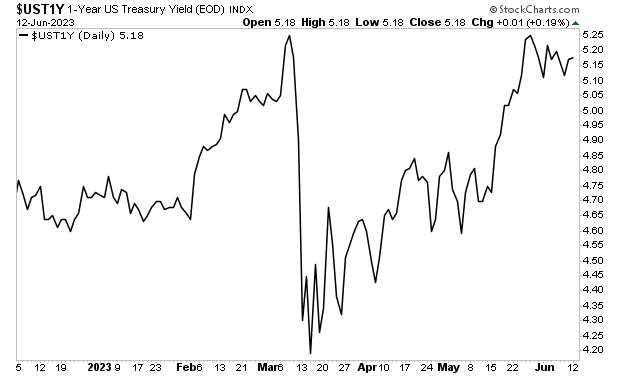
While the yield on the 1-Year U.S. Treasury is back at its former highs.

This image has an empty alt attribute; its file name is GPC613233.png

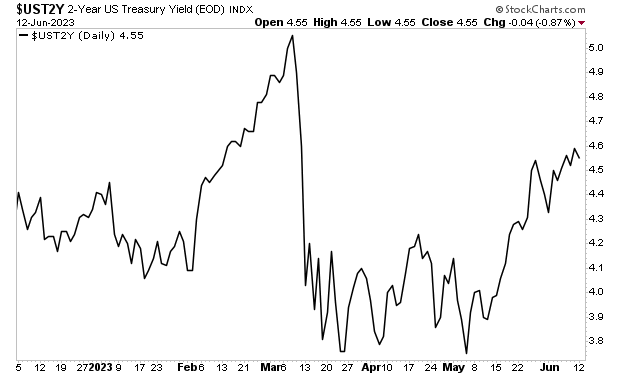
The above charts tell us the bond market is figuring out the Fed will need to raise rates higher and hold them there for much, MUCH longer. Three months ago, the Treasury market thought rates would be at 3.75% in two years. It is now suggesting rates will be 4.50% two years from now.

This image has an empty alt attribute; its file name is GPC613234.png

Anyone who believes the Fed will be easing monetary policy soon is mistaken. Between the Fed’s refusal to drain excess liquidity from the financial system and the Debt Deal normalizing the federal government’s pandemic levels of spending, inflation is going to become quite sticky, if not permanently embedded in the financial system.

There are many different ways to profit from this situation. We recently outlined a unique “of the radar” one favored by a family of billionaires in an investment report called Billionaire’s “Green Gold.”

Normally this report would be sold for $249. But we are making it FREE to anyone who joins our Daily Market Commentary Gains Pains & Capital.

To pick up your copy, swing by:

https://phoenixcapitalmarketing.com/GreenGold.html
This image has an empty alt attribute; its file name is SIG.jpg
Posted by Phoenix Capital Research in Inflation

Guess Who is Driving Inflation Now (and Minting Profits For Smart Investors)

By Graham Summers, MBA

There are two primary reasons why inflation has remained so persistent despite the Fed raising rates from 0.25% to 5.25% in the span of 14 months.

1)     The Fed is using the wrong tools to end inflation.

2)    The Federal Government continues COVID-19 emergency levels of spending. 

Yesterday we discussed #1. Today we’re going to dissect #2. 

Between 2020 and 2022, the Fed printed roughly $5 trillion. The Federal Government spent/ printed another $6 trillion.

Over the last 14 months, Fed has raised rated from 0.25% to 5.25% while draining $500 billion in liquidity from the financial system. In simple terms, the Fed has stopped printing money and is tightening monetary policy.

The Federal Government has not altered its money printing/ spending. In fact, courtesy of the Debt Deal that was just signed into law, the Federal Government has NORMALIZED the emergency levels of stimulus/ spending it introduced during the pandemic.

The government is financed via tax revenues. If spending is greater than tax revenues, then the government issues debt to finance its spending. Despite pulling in record taxes in 2021 (and 2022’s tax haul is looking to be ever greater), the U.S. continues to run $1+ trillion deficits.

Relative to GDP, the deficit is greater than that the government ran during the depths of the 2008 crisis. Indeed, you have to go back to World War II to find a period in which the deficit relative to GDP was greater! And bear in mind, the government is currently running this kind of deficit TWO YEARS after the recession associated with the shutdowns ended!

And thanks to the Debt Deal, this level of stimulus/ spending will become normalized.

Section 265 of the bill notes that the OMB (Office of Management and Budget) director has sole waiver authority to spend whatever money the government wishes if said spending is deemed “necessary for program delivery.” (H/T. Rep Nance Mace for catching this).

The OMB is the part of the Executive Branch in charge of “overseeing the implementation” of the President’s “vision” for the economy. The OMB director is appointed by the President. And according to the current version of the debt dealing congress is voting on, this person has “sole waiver” authority on spending caps.

Put simply, she (the current OMB director is Shalanda Young), is permitted to spend as much money as President Biden wants, provided the spending is deemed “necessary” to deliver on programs that meet his vision for the economy.

That single line negates any and all cuts or spending caps laid out elsewhere in the debt deal. It’s akin to someone writing “everything else in this 99-page bill is non-binding.”

In the very simplest of terms, this deal, if it passes, would normalize the government’s COVID-19 level of spending. This would be highly inflationary. And it would make the Fed’s job of tackling inflation that much more difficult. 

This is why the yield on the 6-month U.S. Treasury bill has soared to new highs…

While the yield on the 1-Year U.S. Treasury is back at its former highs.

The above charts tell us the bond market is figuring out the Fed will need to raise rates higher and hold them there for much, MUCH longer. Three months ago, the Treasury market thought rates would be at 3.75% in two years. It is now suggesting rates will be 4.50% two years from now.

Anyone who believes the Fed will be easing monetary policy soon is mistaken. Between the Fed’s refusal to drain excess liquidity from the financial system and the Debt Deal normalizing the federal government’s pandemic levels of spending, inflation is going to become quite sticky, if not permanently embedded in the financial system.

There are many different ways to profit from this situation. We recently outlined a unique “of the radar” one favored by a family of billionaires in an investment report called Billionaire’s “Green Gold.”

Normally this report would be sold for $249. But we are making it FREE to anyone who joins our Daily Market Commentary Gains Pains & Capital.

To pick up your copy, swing by:

https://phoenixcapitalmarketing.com/GreenGold.html
Posted by Phoenix Capital Research in Inflation

How to Profit From the Fed’s MASSIVE Mistake

By Graham Summers, MBA

There are two primary reasons why inflation has remained so persistent despite the Fed raising rates from 0.25% to 5.25% in the span of 14 months.

1) The Fed is using the wrong tools to end inflation.

2) The Federal Government continues COVID-19 emergency levels of spending.

Today we’re going to dissect #1.

The Fed is repeating the same mistake it initially made during the last major inflationary bout in the U.S. in the 1970s: focusing on rate hikes as opposed to draining excess reserves/ liquidity from the financial system.

During the first round of inflation from 1972-1975, the official inflation measure, the Consumer Price Index or CPI, rose from 3.3% to 11.1%. During this period, the Fed, chaired by Arthur Burns, attempted to rein in inflation using rate hikes. This succeeded in triggering a recession, but failed to end inflation: CPI only fell to 5.7% in 1976 before rebounding and eventually peaking at 13% in 1980.

Burns was replaced William Miller as Fed Chair in 1978, but Miller only lasted a year, as his efforts to end inflation proved similarly futile: the Fed raised rates from 6.75% to 10.5% during Miller’s tenure, but inflation continued to rise from 7.6% to 11.3%

It was only when Paul Volcker took the reins as Fed Chair in 1979 that things changed. Volcker shifted the Fed’s focus from rate hikes to draining excess reserves/ liquidity from the financial system. The goal was to remove the froth from the financial system, while letting rates move in a wider range in order to tighten policy to the point that inflation finally disappeared.

The effect was a severe recession (July 1981-November 1972), but CPI also came down, eventually falling to ~3% in 1983.

Fast forward to today, and the Fed repeating the same mistakes it made from 1972-1979. Thus far in its quest to end inflation, the Fed has raised rates from 0.25% to 5.25% in 14 months. It has also attempted to drain ~$500 billion liquidity from the financial system via its Quantitative Tightening (QT) program. CPI has dropped from 8.9% to ~5% where it stands today.

Meanwhile, the evidence is clear that there is still far too much liquidity/ froth in the financial system.

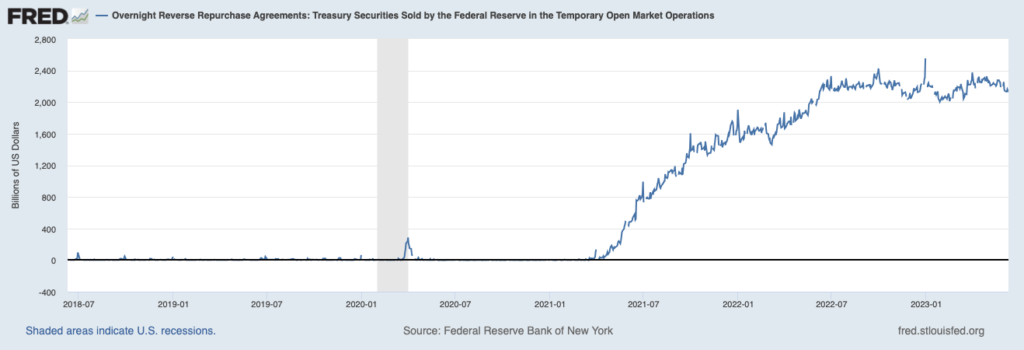
Banks continue to park over $2 TRILLION at the Fed every night via the overnight Reverse Repo Agreements. This is a very technical arrangement that isn’t worth delving into right now, but the primary point is that there is a LOT of excess money in the system.

Other signs of excess froth concern the fact that several of the large tech companies are back at their all-time highs, despite the fact their underlying businesses have either gone ex-growth or growing at much slower rates.

And of course, there is the Artificial Intelligence (AI) bubble.

Nvidia (NVDA), which is seen by the market as the primary beneficiary of A.I., has seen its market cap go from sub-$300 billion to over $1 trillion in six months… on annual revenues of $44 billion (annualized based on the company’s increase 2Q23 outlook). By way of comparison, Cisco (CSCO) which operates in a similar business as NVDA, already has annual revenues of $50+ billion, but trades at a market cap of $200 billion.

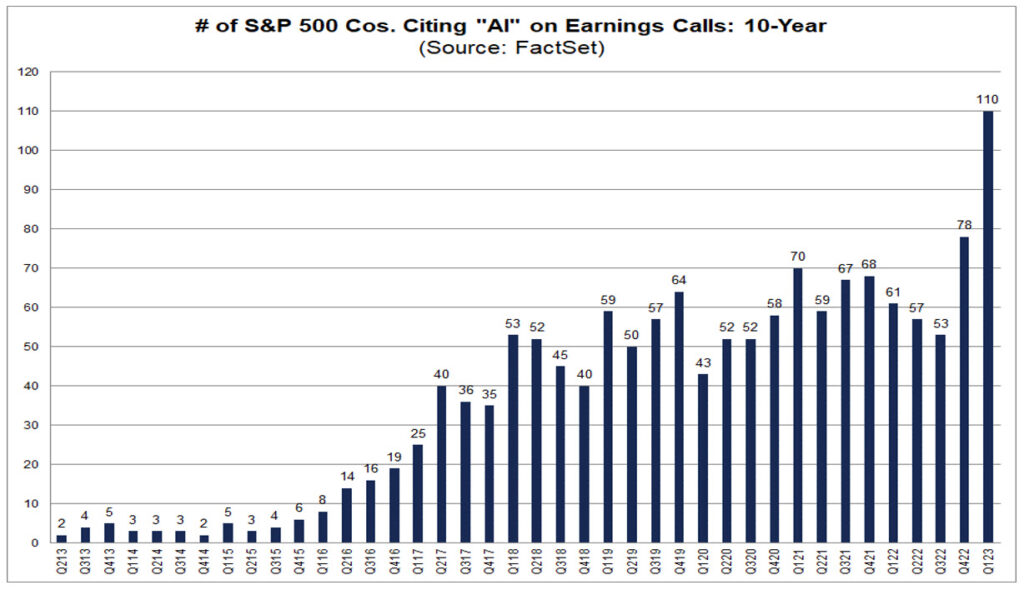
Companies are doing everything they can to align themselves with this mania, to the point of mentioning the term “AI” on earnings conference calls even if their businesses has little if any real exposure to the technology.

Source: Factset

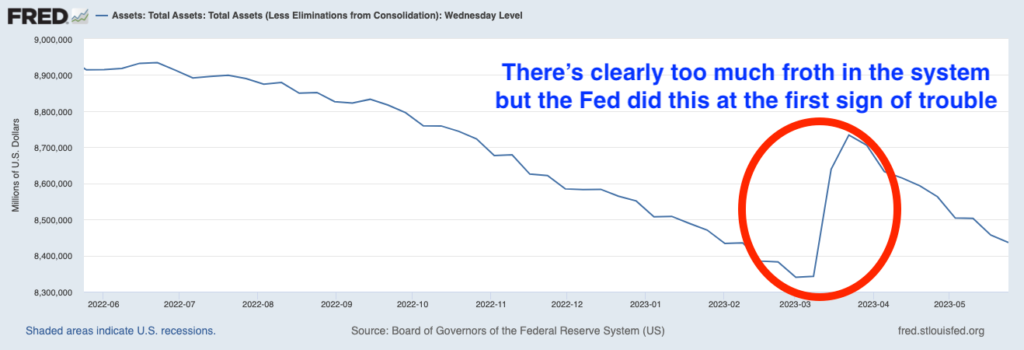
To summate the above examples, there are clear signs that there is much too much froth/ excess liquidity in the financial system today. And the Fed seems unaware of how to fix this. Case in point, during the regional banking issues of March 2023, the Fed pumped $400 billion into the financial system in the span of three weeks, thereby reversing roughly two thirds of its entire nine-month Quantitative Tightening (QT) efforts!

All of the above items indicate to me that the Fed is unlikely to succeed in its attempt to end inflation unless it dramatically increases QT and implements other measures to drain excess reserves/ liquidity.

To summate, the Fed is making the very same mistake it made in the 1970s: focusing on fighting inflation with rate hikes when there is clear evidence that the REAL issue is that there is too much money/ reserves in the financial system.

For more inflationary insights as well as a Special Investment Report that details how to profit from sticky inflation swing by:

https://gainspainscapital.com/

Posted by Phoenix Capital Research in Inflation

This is the Single Most Important Factor in the Markets Today

By Graham Summers, MBA

One of the biggest questions we hear from clients is “why aren’t stocks breaking down?”

The answer is simple: the government.

The Fed is fighting inflation. The government is NOT. The Fed is raising interest rates and engaging in Quantitative Tightening (QT). The government is running a $1+ trillion deficit. And this is in spite of a record tax haul.

In our current socialist version of America, this money is being funneled into the economy. And as a result of this, the economy continues to plod along despite inflation hanging around 5%.

It’s likely going to get worse from here.

Estimated federal outlays for 2023 are slated to be $6.3 TRILLION. That’s 23% of GDP. and the Debt Deal only increases this as it will remove ALL SPENDING CAPS for the Federal Government through 2025.

Uncle Sam isn’t the only one spending like there’s no tomorrow.

State, county and local governments are all spending loads of money. The 50 U.S. states have budgets of $1.2 trillion for FY 2023. That’s a 6.7% increase over that of 2022 which was an 18% increase over 2021. And by the way, that 18% increase in 2021 was the largest in history.

So… if you’re looking for a reason why the economy refuses to roll over… and why stocks continue to hold up… here’s your answer: because the U.S. government from the federal down to the local level is spending trillions and trillions of dollars.

All of this is HIGHLY inflationary. And the bond market knows it.

The yield on the 6-month U.S. Treasury recently hit new highs for this cycle. The impact this is going to have on every asset class will be profound.

On that note, we published a Special Investment Report concerning FIVE secret investments you can use to make inflation pay you as it rips through the financial system in the months ahead.Paragraph

The report is titled Survive the Inflationary Storm. And it explains in very simply terms how to make inflation PAY YOU.

To pick up yours, swing by:

https://phoenixcapitalmarketing.com/inflationstorm2.html

Best Regards,

Posted by Phoenix Capital Research in Inflation

Warning: the Debt “Deal” Opens the Door to Unlimited Spending

It’s worse than I imagined.

I had initially thought that the current debt ceiling deal would feature a small amount of spending cuts in 2024.  In reality, it will feature NO CUTS and will in fact open the door to as much spending as the Biden Whitehouse desires.

How is this possible?

A single line in the fine print from Section 265: The OMB director has sole waiver authority to spend if it’s “necessary for program delivery.” (H/T. Rep Nance Mace for catching this).

What does this mean?

OMB stands for Office of Management and Budget. This is the part of the Executive Branch in charge of “overseeing the implementation” of the President’s “vision” for the economy.

The OMB director is appointed by the President. And according to the current version of the debt dealing congress is voting on, this person has “sole waiver” authority on spending caps.

Put simply, she (the current OMB director is Shalanda Young), is permitted to spend as much money as President Biden wants, provided the spending is deemed “necessary” to deliver on programs that meet his vision for the economy.

So much for spending caps! This is the equivalent of handing a credit card to your 10-year-old child and saying, “you can only spend $100… unless it’s for something you think you need.”

We both know how that would turn out.

The reality is that this debt deal opens the door to a LOT more spending by the government, a mere 17-18 months before the next Presidential election. I’m sure the government will become fiscally conservative between now and then. After all, they’ve only grown the debt by $8 trillion since early 2020.

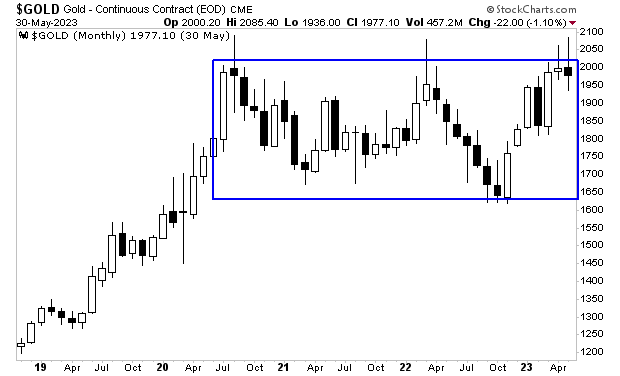
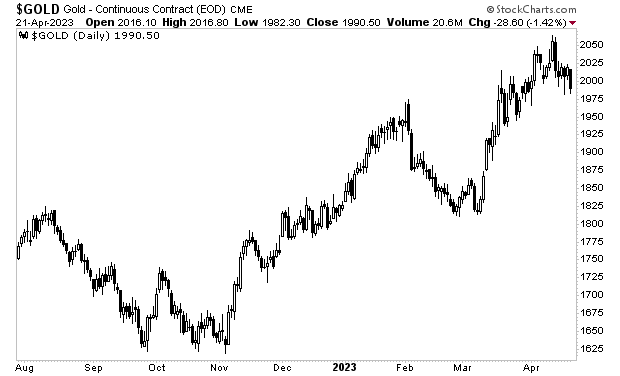
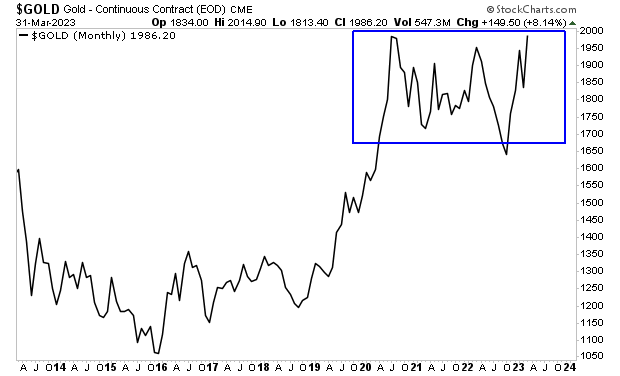
More and more the U.S. is beginning to look like an emerging market economy. Rampant spending, rampant corruption, and rampant inflation. Gold’s figured out what’s coming which is why it’s hanging around $2000 per ounce despite the Fed raising rates aggressively in the last 12 months.

Some investments will make fortunes from all this government spending/ inflation, others will absolutely implode.

On that note, we published a Special Investment Report concerning FIVE secret investments you can use to make inflation pay you as it rips through the financial system in the months ahead.Paragraph

The report is titled Survive the Inflationary Storm. And it explains in very simply terms how to make inflation PAY YOU.

We made just 100 copies available to the public.

To pick up yours, swing by:

https://phoenixcapitalmarketing.com/inflationstorm2.html

Best Regards,

Posted by Phoenix Capital Research in Inflation

This is a Make or Break Market… Here’s How to Play It

By Graham Summers, MBA

As I first noted in my best-selling book The Everything Bubble: The Endgame For Central Bank Policy, “politicians make promises, but bond markets deliver.”

What I meant by this is that our entire political system is now consists of government overspending which is ultimately financed by the bond markets. As long as the bond markets remain stable, politicians will continue to spend and spend and spend. 

And that is precisely what happened with the debt ceiling “resolution.”

We now live in a “one party” system that consists of Democrats, who like to spend trillions and trillions of dollars, and Republicans who like to sign off on 98% of Democrat spending, while arguing that doing so is a “win” for conservatives because the Democrats didn’t get 100% of what they proposed. 

The latest Debt Ceiling “deal” is the latest example of this dynamic.

The Debt Ceiling deal features little if any spending cuts. Total federal spending will be reduced by about 0.2% of GDP in 2024. However, total spending then jumps 1% the next year (2025). And the debt ceiling is now suspended until 2025, which means we’ll likely tack on another $4 TRILLION in debt by then. 

Inflation was already proving extremely sticky in some areas of the economy. We’re 15 months into one of the most aggressive monetary tightening cycles in history and CPI remains at 4.9% while Core PCE (the Fed’s favorite inflation measure) is at 4.7% and has been stuck there for FOUR MONTHS. 

The fact the government will be permitted to continue running $1+ trillion deficits for the next 18 months will only make inflation even more embedded in the economy. The bond market knows this which is why bond yields are rising again.

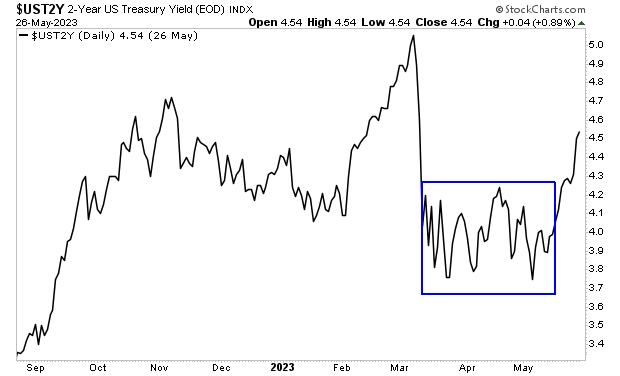
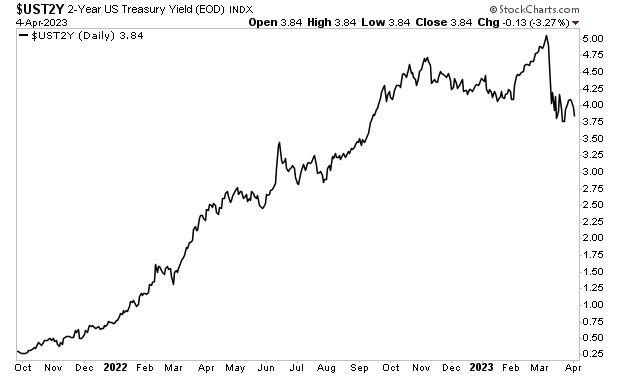
The yield on the 2-Year U.S Treasury has broken out to the upside after a three-month consolidation period. As I write this, it’s rapidly approaching its former highs.

Some investments will make fortunes from this, others will absolutely implode. This is an extremely volatile market and one that could make or break your portfolio.

On that note, we published a Special Investment Report concerning FIVE secret investments you can use to make inflation pay you as it rips through the financial system in the months ahead.Paragraph

The report is titled Survive the Inflationary Storm. And it explains in very simply terms how to make inflation PAY YOU.

We made just 100 copies available to the public.

To pick up yours, swing by:

https://phoenixcapitalmarketing.com/inflationstorm2.html
Best Regards,

Posted by Phoenix Capital Research in Inflation

I Sincerely Hope You Aren’t Ignoring This

By Graham Summers, MBA

You can forget about what the media is telling you…because REAL inflation has come down much at all.

The media likes to trumpet that headline inflation has dropped in the U.S. from a peak of ~9% down to ~6%. However, as I’ve noted time and again, the ONLY reason headline inflation has dropped this much is due to energy prices falling. And the primary reason energy prices have fallen is because the Biden Administration has dumped over 150 MILLION barrels of oil in the last 12 months pushing oil down from $130 a barrel to $70 a barrel.

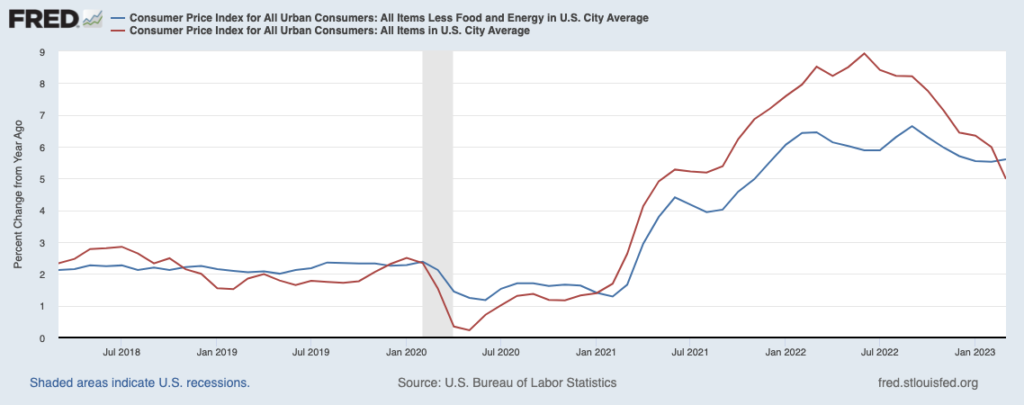
Core inflation, which removes the effect of energy and food, presents a much clearer picture of underlying inflation without the impact of these political shenanigans. And the situation for core inflation (blue line) doesn’t look NEARLY as promising as headline inflation (red line) as the below chart illustrates.  

As you can see, core inflation has barely dropped much if at all. And it’s now in the process of turning back up!

And bear in mind, this is after the Fed performed its most aggressive 12 month monetary tightening in history, raising rates from 0.25% to 5%!

So what do you think will happen to inflation now that the Fed is beginning to talk about pausing its rate hikes?

Gold has figured it out. The rest of the market will soon as well!

On that note, we published a Special Investment Report concerning FIVE secret investments you can use to make inflation pay you as it rips through the financial system in the months ahead.

The report is titled Survive the Inflationary Storm. And it explains in very simply terms how to make inflation PAY YOU.

We are making just 100 copies available to the public.

As I write this, there are only 29 left.

To pick up yours, swing by:

https://phoenixcapitalmarketing.com/inflationstorm2.html
Best Regards,

Posted by Phoenix Capital Research in Inflation
If You Missed the First Round, You Won’t Want to Miss This One

By Graham Summers, MBA

The next round of the inflation trade has begun.

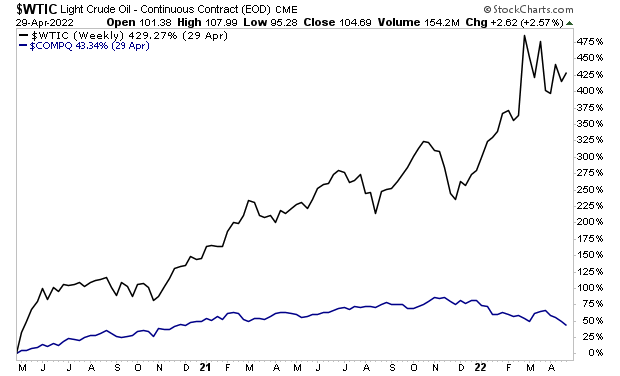
The first round focused on energy prices. Oil rose from $10 a barrel at the 2020 lows to $130 per barrel at the 2022 highs. You may find this hard to believe, but oil (black line) actually outperformed tech stocks by such a wide margin that the NASDAQ ‘s (blue line) performance looks pathetic in comparison!

During major bull markets in commodities, the sector that leads during the first leg up rarely leads during subsequent moves higher. Which is why this leg up for the inflation trade looks to be lead by precious metals.

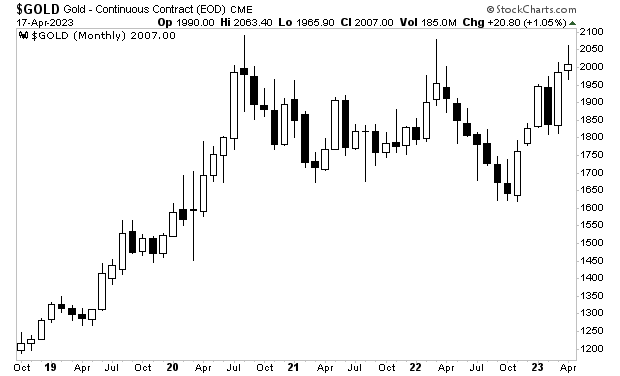
As I write this, gold is closing in on its ALL TIME highs. Yes, ALL TIME highs. And practically no one has noticed or cares.

In the simplest of terms, we are getting multiple signals that the inflation trade is about to hit again. Smart investors are already taking steps to profit from it.

On that note, we published a Special Investment Report concerning FIVE secret investments you can use to make inflation pay you as it rips through the financial system in the months ahead.

The report is titled Survive the Inflationary Storm. And it explains in very simply terms how to make inflation PAY YOU.

We are making just 100 copies available to the public.

As I write this, there are only 37 left.

To pick up yours, swing by:

https://phoenixcapitalmarketing.com/inflationstorm2.html

Best Regards,

Posted by Phoenix Capital Research in Inflation

The Bond Market Fears Something Worse Than Inflation is Coming

By Graham Summers, MBA

The bond market is signaling some thing “BAD” is coming.

Bond yields rose throughout late 2021-early 2023 on fears of inflation. But once Silicon Valley Bank imploded, yields dropped rapidly: historically investors pile into Treasuries as a “safety trade” whenever things get hairy in the financial system. The regional banking crisis in mid-March was no exception with yields collapsing at their fastest rate since the 1987 crash.

When this happened, I began to wonder… would yields begin to rise again as things normalized following the regional banking bailouts… or would the economy roll over and yields finally start to plunge as a recession took hold?

We now have our answer…

The yield on the 2-Year U.S. Treasury is NOT rising anymore. If anything it’s rolling over and approaching the “Silicon Valley Bank” lows.

This is a signal that something “BAD” is brewing in the economy/ financial system. If everything was fine, yields would be rising again based on hopes of growth and fears of inflation.

Put simply, the fact yields are falling like this tells us that the bond market fears something far worse than inflation is coming…

Indeed, the 2s10s are now beginning to invert. Historically, this has been the signal that a recession is about to hit.

What happens to stocks when a recession hits while inflation is still at 6%?

The 70s showed us…

If you’ve yet to take steps to prepare for what’s coming, we just published a new exclusive special report How to Invest During This Bear Market.

It details the #1 investment to own during the bear market as well as how to invest to potentially generate life changing wealth when it ends.

To pick up your FREE copy, swing by:

https://phoenixcapitalmarketing.com/BM2.html

This image has an empty alt attribute; its file name is signature.jpg

Posted by Phoenix Capital Research in Inflation, stock collapse?

Warning: Inflation is About to Explode Higher Again… Are You Prepared?

By Graham Summers, MBA

OPEC shocked the world by announcing oil production cuts of 1.6 million barrels per day starting in May.

This is a big deal for inflation.

Why?

Because as I have noted previously, the ONLY inflation data that had come down in the last 12 months was in energy prices. And that was due to the Biden administration dumping 250 million barrels of oil in the open market while OPEC was maintaining its regular production rates.

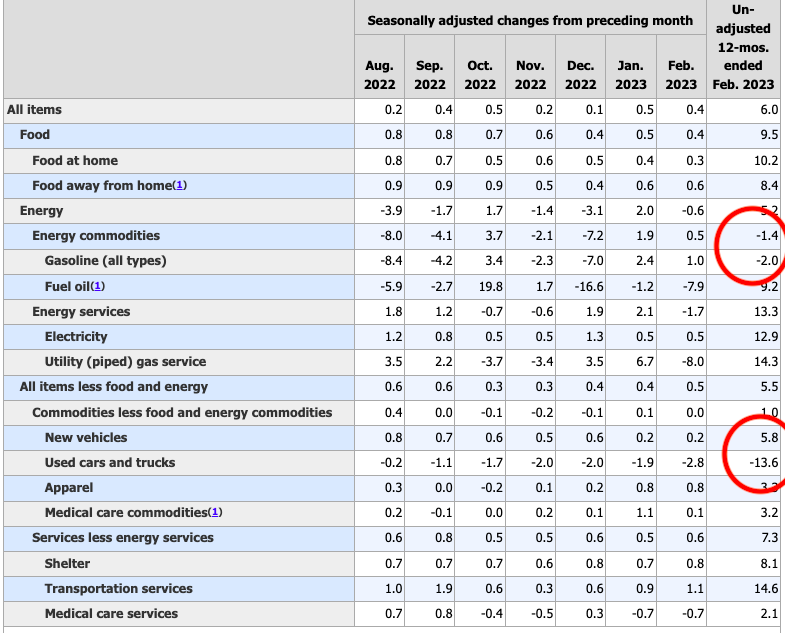
See the data for yourself… literally everything but energy prices and used car prices continues to rise…

But now OPEC is cutting production at the same time that the Biden administration is set to STOP dumping oil on the market.

What does this mean?

Energy prices are about to erupt higher, pushing inflation to new highs.

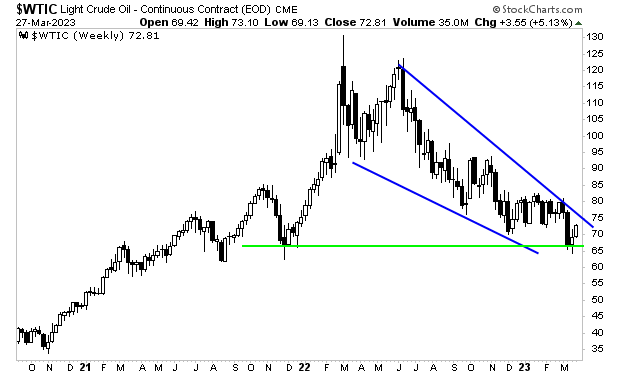
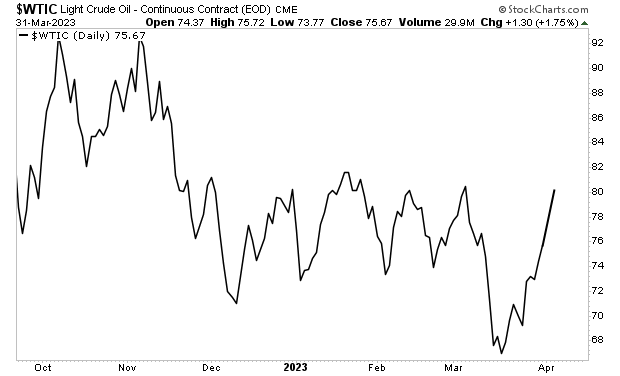
Oil is already back at $80 a barrel, up from $66 per barrel a few weeks ago.

Gold has figured out what’s coming already. It’s rocketed from $1,600 an ounce to $2,000 an ounce and is about to break out to new all-time highs.

On that note, we published a Special Investment Report concerning FIVE secret investments you can use to make inflation pay you as it rips through the financial system in the months ahead.

The report is titled Survive the Inflationary Storm. And it explains in very simply terms how to make inflation PAY YOU.

We are making just 100 copies available to the public.

To pick up yours, swing by:

https://phoenixcapitalmarketing.com/inflationstorm2.html

Best Regards,

Posted by Phoenix Capital Research in Inflation

I Promise You Won’t Want to Miss This

By Graham Summers, MBA

I have a question… and it’s one we need to consider as investors.

What happens to inflation if oil begins to rally aggressively?

Black gold has been in a downtrend for the last 12 months. This, combined with the Biden administration dumping 250 million barrels of oil, has resulted in energy inflation dropping considerably.

Indeed, according to the Consumer Price Index (CPI), which is the official inflation measure in the U.S., energy inflation is the ONLY form of inflation that has come down in any meaningful way in the last year (aside from car prices).

See for yourself in the table below.

I bring all of this up because oil is once again showing signs of life. Despite the threat of recession, the commodity has refused to drop below $65 be barrel. And after yesterday’s 5% rally, it’s within spitting distance of an upside breakout from its year long downtrend.

This could very well be the next MAJOR money maker for investors who take heed.

On that note, we published a Special Investment Report concerning FIVE secret investments you can use to make inflation pay you as it rips through the financial system in the months ahead.

The report is titled Survive the Inflationary Storm. And it explains in very simply terms how to make inflation PAY YOU.

We are making just 100 copies available to the public.

To pick up yours, swing by:

https://phoenixcapitalmarketing.com/inflationstorm2.html

Best Regards,


Posted by Phoenix Capital Research in Inflation

The Fed is Back to Printing Money… With Inflation at 6%

By Graham Summers, MBA

The Fed just gave out over $300 BILLION in single week.

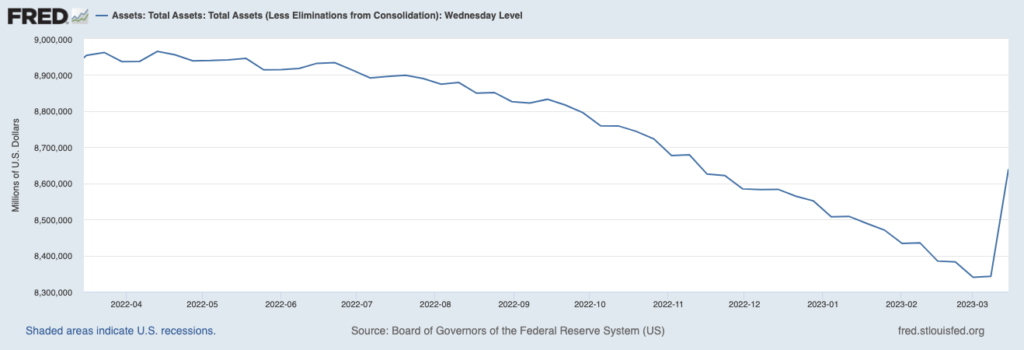
See for yourself: the Fed’s balance sheet has erupted higher, erasing over HALF of its Quantitative Tightening (QT) efforts. Again, we are talking about $300+ BILLION in a single week.

Now, technically much of this ($164 billion to be exact) came in the form of loans to banks. The banks will have to pay this back, so it’s not quite the same as Quantitative Easing (QE). Regardless, the key point is that the Fed is NO LONGER shrinking its balance sheet… instead it is printing money. And not a little bit, but $300+ billion in a single week.

To put that into perspective, it’s the equivalent of more than TWO MONTHS’ worth the Fed’s emergency QE program that it ran in response to the pandemic. And again, the Fed did this in just FIVE DAYS.

What does this mean?

First and foremost, that something VERY BAD is going on behind the scenes in the U.S. banking system. But more importantly for us as investors, that the next round of bailouts/ easing/ reflating the financial system is here. 

This won’t end well.

The Silicon Valley Bank bailout is the Bear Stearns moment for this bubble. Lehman is coming… as is AIG… and this entire mess won’t end until the stock market hits levels most cannot even imagine today… to the downside

Indeed, from a BIG PICTURE perspective my proprietary Crash Trigger is now on the first confirmed “Sell” signal since 2008.

This signal has only registered THREE times in the last 25 years: in 2000, 2008 and today.

If you’ve yet to take steps to prepare for what’s coming, we just published a new exclusive special report How to Invest During This Bear Market.

It details the #1 investment to own during the bear market as well as how to invest to potentially generate life changing wealth when it ends.

To pick up your FREE copy, swing by:

https://phoenixcapitalmarketing.com/BM.html

This image has an empty alt attribute; its file name is signature.jpg
Posted by Phoenix Capital Research in Inflation, stock collapse?