stock collapse?

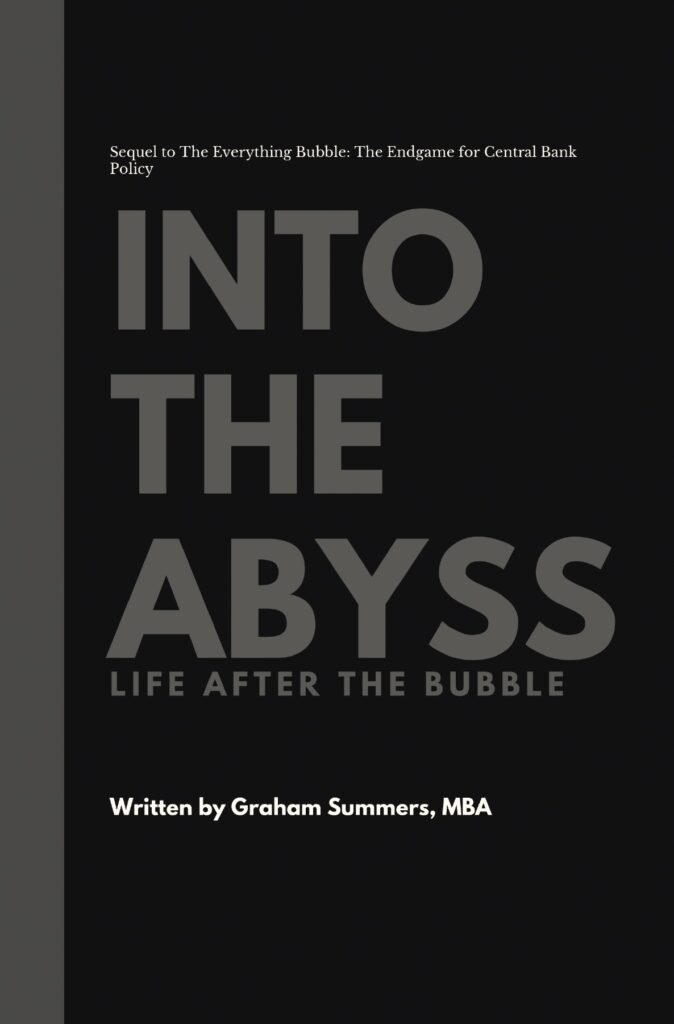
The Everything Bubble Will Burst in 2026

By Graham Summers, MBA | Chief Market Strategist

We are officially going on record with a startling prediction.

That prediction?

The Everything Bubble will burst in 2026.

The Trump administration came into office proclaiming that it was a champion of Main Street, not Wall Street and that it would be balancing the budget and cutting spending via Department of Government Efficiency (DOGE) and other efforts.

The results have been lackluster. While DOGE has made headlines for cutting truly egregious contracts that no sane person approves of, the reality is that ALL the DOGE cuts add up to very little in the grand scheme of government spending.

To date, DOGE has cut approximately $50 billion in government spending. But the government spends $ 6+ TRILLION per year. And there are NO SIGNS that the political class want to address this.

Case in point, the spending bill currently making its way through congress will INCREASE the deficit (and the debt). Not by a little: by trillions of dollars. Deficit as a percentage of GDP is INCREASING not decreasing. True it’s down from the pandemic levels, but the pandemic levels were a once in a lifetime event due to the government attempting to “paper over” an economic shutdown.

By the look of things, the bond market is finally beginning to wake up to these realities. The recent 20-Year Treasury auction in the U.S. was a disaster. And yields on long-end of the Treasury curve are in danger of a nasty shock.

Is this the Trump administration’s fault? No, they inherited this mess. But the key development is that they are NOT doing anything to alter it. When that yield breaks above 5% the door is open to a move to 7%. And that is when The Everything Bubble will burst.

Smart investors are already taking steps to make sure they’re ready for when it hits. One such strategy is to use quantitative tools that have accurately predicted crashes in the past.

We’re developed precisely such a tool: a highly accurate “crash trigger” that went off before the 1987 Crash, the Tech Crash, and the 2008 Great Financial Crisis.

We detail this trigger, how it works, and what it’s saying about the market today in a Special Investment Report titled How to Predict a Crash.

Normally this report is only available to our paying clients, but in light of what’s happening in the economy today, we are making just 99 copies available to the broader public.

To pick up one of the remaining copies…

CLICK HERE!

Graham Summers, MBA

Chief Market Strategist

Phoenix Capital Research

Posted by Phoenix Capital Research in Debt Bomb, stock collapse?, The Everything Bubble

A Debt Crisis is Coming… The Time to Prepare is NOW!

By Graham Summers, MBA | Chief Market Strategist

On Friday after the market’s close, Moody’s downgraded the U.S.’s credit rating from AAA to Aa1. While the timing of this announcement is suspect (where was Moody’s during the last four years when the U.S. added nearly $10 trillion in debt?) it’s still a BIG deal for investors.

Why did Moody’s do this?

The credit rating agency notes the U.S. is on an unsustainable trajectory as far as spending and debt is concerned. Moody’s expects the U.S.’s deficits to hit 9% by 2035 while its Debt to GDP ratio will hit 134%. At that point the country’s debt levels would be more akin to an emerging market than the global leader of the world.

The markets are a sea of red this morning as this downgrade has systemic significance. It might be quite early, but Moody’s is noting the same thing that gold and other assets have begun to predict.

The reality is the U.S. is heading towards a debt crisis.

As exciting as the Department of Government Efficiency’s (DOGE) various announcements about cutting waste are, the reality is that all of its cuts amount to very little in the grand scheme of things. And for all the Trump administration’s talk of balanced budgets, the current spending bill it is proposing will ADD to the debt, not shrink it.

The U.S. has $36 trillion in debt and is currently running a deficit of $1.5 trillion per fiscal year. Moreover, the deficit is UP, not down for the first five months of fiscal year 2025. And not by a little: deficit spending rose by $318 billion or 38% during the first five months of 2025.

Regardless of who was/ is President while this is happening, and regardless of his agenda, the math simply no longer adds up. Unless the U.S. makes MASSIVE cuts to its largest spending items (entitlements, social spending), there is no way on earth the budget gets balanced.

The issue with this is that even suggesting any cuts to entitlements/ spending is political suicide. For decades the U.S. political class has “bought” votes by promising to spend money on various social issues. Roughly one third of American households receive some kind of government assistance/ entitlement spending.

Good luck cutting that while staying in office.

So, what does this mean for investors?

A debt crisis is coming. It won’t be in the next week or month, but it’s coming. And when it hits, the only way out of the mess is for the Fed and Federal government to “inflate” away the debt: a default would trigger a systemic collapse of the financial system.

This is as close to a “sure thing” as you can get in investing: the $USD will be devalued aggressively as the Fed is forced to print money and use it to buy U.S. debt. The dollar has lost a third of its purchasing power since the Fed began large-scale Quantitative Easing (QE) programs in 2007. It’s only going to get worse from here.

This is why gold is erupting higher, breaking out against every major world currency. It’s why BTC is fast approaching all-time highs. It’s even why stocks have exploded upwards from the April lows (don’t forget, stocks are an inflation hedge).

There is a limited amount of time to prepare for this. And smart investors are already taking steps to make sure they’re ready for when it hits.

If you’re worried about a crash happening, you need to ignore sentiment and “feelings” and rely on quantitative tools that have accurately predicted them in the past.

We’re developed precisely such a tool: a highly accurate “crash trigger” that went off before the 1987 Crash, the Tech Crash, and the 2008 Great Financial Crisis.

We detail this trigger, how it works, and what it’s saying about the market today in a Special Investment Report titled How to Predict a Crash.

Normally this report is only available to our paying clients, but in light of what’s happening in the economy today, we are making just 99 copies available to the broader public.

To pick up one of the remaining copies…

CLICK HERE!

Graham Summers, MBA

Chief Market Strategist

Phoenix Capital Research

Posted by Phoenix Capital Research in stock collapse?

Urgent Market Update: The U.S. Was Just Downgraded… a Bloodbath is Coming!

By Graham Summers, MBA | Chief Market Strategist

Moody’s just downgraded the U.S.’s credit rating from AAA to Aa1.

The markets will be opening sharply down on Monday. Anyone who chased the rally into the close on Friday last week will get taken to the cleaners.

Not Private Wealth Advisory subscribers.

Last week when everyone was chasing the markets into the highs, I warned Private Wealth Advisory subscribers that a pullback was imminent and not to go “all in” on stocks at their current levels. I also told them that once the pullback hit, we’d open FOUR new trades designed to profit from the next major market move.

I’d love to help you navigate the markets. While most traders have been whipsawed back and forth by the markets, Private Wealth Advisory subscribers have locked in 13 DOUBLE DIGIT winners in the last month.

To join us in profiting from the markets… and to start receiving my best stock and ETF trades every week, all you need to do it take out a 30-day, $7.99 trial subscription to Private Wealth Advisory.

During those 30 days, you’ll receive…

  • FOUR weekly market updates
  • At least SIX new trades
  • A FREE copy of my best-selling book The Everything Bubble (a $9.99 value).
  • Four episodes of my podcast Bulls Bears & BS.
  • And SIX special investment reports detailing the most extraordinary long-term investing opportunities in the markets today.

To take out a 30-day, $7.99 trial subscription to Private Wealth Advisory… and have your subscription all set up to receive my trade alert early next week…

CLICK HERE NOW!!!

Best Regards

Graham Summers, MBA

Chief Market Strategist

Phoenix Capital Research

Posted by Phoenix Capital Research in stock collapse?

Is the Stock Market About to Crash?

“Are the markets about to reverse course and crash?”

This is the #1 question on investors’ minds today. The stock market has just staged one of its most spectacular “V-shaped” recoveries in history. And many investors are wondering if the worst is over.

Let’s break down the move in detail.

The initial decline following April 2nd’s “Liberation Day” press conference in the Rose Garden was the 5th fastest 10% decline in the last 75 years. Stocks don’t like uncertainty and the Trump administration’s “shock and awe” announcement of global tariffs against every major trade partner created tremendous uncertainty.

Remember, 28% of S&P 500 revenues come from international markets. All those revenues would be impacted by tariffs. Moreover, few if any companies produce their goods from start to finish. In that context, the trade war had the potential to badly disrupt supply chains, resulting in higher costs, longer production times, and lower profit margins.

Peak to trough, the S&P 500 declined 20% triggering what Wall Street believes to signal a “bear market” was underway. At their nadir, stocks were trading THREE standard deviations away from their long-term trend, as denoted by the 200-day simple moving average (DSMA).

This was an extreme reading and one that suggested a “snapback” rally would occur. And that is precisely what has happened. Stocks have closed higher nine straight days since the lows, with the S&P 500 now back at “the scene of the crime” trading at the same levels at which it was priced when the Liberation Day tariffs were announced.

Historically, this kind of rebound/ price action has been quite bullish in the intermediate term: six to 12 months out stocks are usually higher after a bounce like this. However, in the near-term things are not so clear.

While many stocks are up quite a lot from the lows, Big Tech, which comprises 30% of the S&P 500’s overall weight and nearly 20% of S&P 500 total profits, has lagged. It will be VERY difficult for the overall market to storm higher without these companies participating in the rally.

Consider Apple (AAPL), the 2nd largest company in the S&P 500 (and the world) with a $3+ trillion market cap. While the S&P 500 has reclaimed its 50-DSMA and is moving to challenge its 200-DSMA, AAPL remains well below both lines. In fact, AAPL was recently rejected at its 50-DSMA and has since turned back down after announcing disappointing 1Q25 results.

None of this is good. If AAPL and Big Tech stocks like it cannot catch a bid, the overall market will struggle. These are the stocks you need to keep an eye on in terms of determining what the next major market move will be.

And if you’re worried about a crash happening, you need to ignore sentiment and “feelings” and rely on quantitative tools that have accurately predicted them in the past.

We’re developed precisely such a tool: a highly accurate “crash trigger” that went off before the 1987 Crash, the Tech Crash, and the 2008 Great Financial Crisis.

We detail this trigger, how it works, and what it’s saying about the market today in a Special Investment Report titled How to Predict a Crash.

Normally this report is only available to our paying clients, but in light of what’s happening in the economy today, we are making just 99 copies available to the broader public.

To pick up one of the remaining copies…

CLICK HERE!

Graham Summers, MBA

Chief Market Strategist

Phoenix Capital Research

Posted by Phoenix Capital Research in Bank Crisis, Central Bank Insanity, stock collapse?, The Markets

Is Dr. Paul’s Dark Prophecy About to Finally Unfold?

By Graham Summers, MBA | Chief Market Strategist

I’m a big fan of Dr Ron Paul.

For years, Dr Paul has proclaimed that the U.S. government should NOT be engaged in reckless spending, that U.S. debt levels were reaching the levels at which we could expect a crisis, and that the U.S. currency, the $USD was in danger of collapse.

I’ve been thinking a lot about Dr. Paul lately as the financial system lurches towards another crisis. Specifically, I vividly remember Dr. Paul telling me about a private lunch he once had with former Fed Chair Paul Volcker in which Volcker told him that the Fed is OK with orderly selling, but that it’s only when things get DISORDERLY that the Fed panics.

Well, buckle up, because things are about to get disorderly.

The $USD is collapsing. It just took out critical support in the overnight session. This is a huge deal as the last time the $USD was at the these levels, it had $13 TRILLION less in debt and the economy was about to erupt higher as the Fed and federal government pumped $11 trillion in stimulus/ interventions into it.

Today, the $USD is collapsing while the economy is rolling over and the Fed has explicitly stated it is NOT coming to the rescue. When asked if the Fed would intervene if the stock market collapsed, Fed Chair Jerome Powell explicitly stated, No, with an exclamation.” 

Meanwhile, the bond market is on edge. The U.S. now has over $36 trillion in debt outstanding. Uncle Sam needs to roll over a quarter of this ($9 TRILLION) in the next 12 months.

This is enough for concern even during ideal circumstances. But today, it’s happening at a time when Treasury yields are on the verge of breaking out to the upside! The debt crisis Dr. Paul has been warning about for years could very well be finally happening. What happens to the debt markets if the U.S. tries to roll over its debt while bonds are collapsing/ yields are soaring?!

And finally, stocks are rolling over again, after being rejected at resistance. This is a BAD sign as it indicates that the market can’t even get enough momentum to put in a significant bounce after one of the worst corrections in the last 75 years.

Stocks have already erased $11 trillion in wealth in the two months. By the look of things, we’re nowhere near the wealth destruction being over.

This is the kind of environment in which things become “disorderly” AKA crashes happen. It is clear the financial system is on edge. And this is all happening in the context of both a trade war and a war between the White House and the Fed.

This is an extremely dangerous situation. The odds of a stock market crash are now higher than at any point since the pandemic.

Indeed, our proprietary Crash Trigger is now on red alert. This trigger went off before the 1987 Crash, the Tech Crash, and the 2008 Great Financial Crisis.

We detail this trigger, how it works, and what it’s saying about the market today in a Special Investment Report titled How to Predict a Crash.

Normally this report is only available to our paying clients, but in light of what’s happening in the markets today, we are making just 99 copies available to the general public.

To pick up one of the remaining copies…

CLICK HERE!

Graham Summers, MBA

Chief Market Strategist

Phoenix Capital Research

Posted by Phoenix Capital Research in Central Bank Insanity, Debt Bomb, stock collapse?

Is the Fed Trying to Crash Stocks?

By Graham Summers, MBA | Chief Market Strategist

The #1 mandate for the Fed is to maintain financial stability. That is literally the Fed’s job. It’s supposedly why the Fed was created in 1913.

The stock market just experienced one of its worst collapses in history. It was literally the 5th fastest 10% decline in the last 75 years. All told some $11 TRILLION in wealth has been erased. And it’s not as if the markets have stopped breaking down. The chart of the S&P 500 is UGLY.

At the same time, the U.S. dollar is breaking multi-year support.

And the long end of the Treasury bond market is in danger of breaking down to the point that yields are on the verge of erupting higher. This is what debt spirals are made of!

Put simply, the ENTIRE financial system is on edge.

So, what do our current Fed Chair Jerome Powell do? He trashes the economy and the stock market in a speech.

Yesterday, Chair Powell spoke at the Economic Club of Chicago. Rather than soothing the markets by stating the Fed stands to act, he went DARK with his speech, stating that tariffs will have a negative impact on the economy, trigger an uptick in inflation, and potentially have a “larger than expected” impact. When asked if the Fed would intervene in stocks if they continued to collapse, he said, “No, with an exclamation.”

This is simply jaw dropping.

Again, the Fed’s job is to maintain financial stability. The entire financial system is on edge, and the Fed Chair is warning about an economic downturn, higher inflation, and saying that he doesn’t care if the stock market collapses.

I cannot remember ANY Fed official EVER being this bearish/ negative on things when the financial markets are on edge. And it begs the question, “is the Fed TRYING to crash the markets?”

We know the Fed hates Trump. You can literally feel the disdain in their public statements. But at this point it appears that senior Fed officials have taken things to the point of negligence.

A CENTRAL BANKER’S JOB IS TO PROMOTE STABILITY, NOT KICK THE MARKETS WHEN THEY’RE DOWN.

This is an extremely dangerous situation. The Fed basically just told investors, “you’re on your own with this mess.”

The odds of a stock market crash are now higher than at any point since the pandemic.

If you’ve not prepared for this, the time to do so is NOW before this unfolds.

Indeed, our proprietary Crash Trigger is now on red alert. This trigger went off before the 1987 Crash, the Tech Crash, and the 2008 Great Financial Crisis.

We detail this trigger, how it works, and what it’s saying about the market today in a Special Investment Report titled How to Predict a Crash.

Normally this report is only available to our paying clients, but in light of what’s happening in the markets today, we are making just 99 copies available to the general public.

To pick up one of the remaining copies…

CLICK HERE!

Graham Summers, MBA

Chief Market Strategist

Phoenix Capital Research

Posted by Phoenix Capital Research in It IS different this time., stock collapse?, The Dollar, The Economy, The Everything Bubble, The Markets

The Trade Wars Just Claimed Their First Major Victim

By Graham Summers, MBA | Chief Market Strategist

The trade wars just claimed their first victim: Nvidia (NVDA).

NVDA is one of the most important companies in the stock market. The reason for this is that NVDA produces the chips/ Graphics Processing Units (GPUs) that the entire world is using to build out Artificial Intelligence (AI) platforms.

Because of this, NVDA has been a true market leader for most of the bull market begun in 2023. NVDA shares more than tripled in 2024. And at one point, NVDA was the largest company in the world based on market capitalization.

Last night, NVDA reported that it would take a $5.5 billion charge this quarter due to the U.S. restricting its exports of H20 AI chips to China. Roughly 20% of NVDA’s business comes from China, so this is not a small issue.

NVDA shares sold off hard in the after-hours.

NVDA is the first company to “take it on the chin” due to the tariffs/ trade wars, but it won’t be the last. The Trump administration’s chaotic rolling out of its policies has resulted in the stock market as a whole losing some $11 TRILLION in value since late January.

The technical damage to the markets has been severe, to the point that the S&P 500 has just triggered a MAJOR sell signal for the first time since the 2022 top. What followed was a year-long bear market that saw stocks lose over 20%.

If you’ve not prepared for this, the time to do so is NOW before this unfolds.

Indeed, our proprietary Crash Trigger is now on red alert. This trigger went off before the 1987 Crash, the Tech Crash, and the 2008 Great Financial Crisis.

We detail this trigger, how it works, and what it’s saying about the market today in a Special Investment Report titled How to Predict a Crash.

Normally this report is only available to our paying clients, but in light of what’s happening in the markets today, we are making just 99 copies available to the general public.

To pick up one of the remaining copies…

CLICK HERE!

Graham Summers, MBA

Chief Market Strategist

Phoenix Capital Research

Posted by Phoenix Capital Research in Recession Watch, stock collapse?

If They’re Not Careful, the Markets Will CRASH

By Graham Summers, MBA | Chief Market Strategist

The Trump administration has a “messaging” problem.

Over the weekend, stocks erupted higher when it was announced that the U.S. would provide exemptions from new tariffs for phones, computers and chips from China. This meant that some of the most critical exports from China to the U.S. would only be charged 20% tariffs instead of the much higher tariff rate of 145% that the Trump administration had recently introduced.

Then, on Sunday, Commerce Secretary Howard Lutnick appeared on ABC to state that these exemptions would only be temporary as the Trump administration would soon be introducing “a special focus type of tariff” on those same items in the coming weeks.

Then, later that day, the President himself went on a tirade on Truth Social stating that there would be NO exemptions what-so-ever, and that “no one was getting off the hook

Bear in mind that the action taken by the White House on 4/11/25 LITERALLY stated that there would be “exemptions.”

So, what is it? Are some Chinese exports (chips, computers, phones) exempt from the new 145% tariffs or not? If they are exempt, does that mean that they will still be charged tariffs of 20% as originally introduced, or will there be zero tariffs? And what happens when the “special focus type of tariff” is introduced on these products in the coming weeks?

I have no idea. I don’t think anyone does. And this kind of bungled messaging is leading to a potential disaster for the stock market.

At the end of the day, stocks can digest a lot, but they absolutely HATE uncertainty. And this poor messaging, combined with all the uncertainty about how this will play out has resulted in the stock market triggering a RARE momentum “sell” signal.

The last time this signal went off was right before the bear market of 2022. At that time, stocks lost over 20% in a matter of months.

The lows are likely NOT in. The time to prepare for the next leg down is NOW before it hits.

Indeed, our proprietary Crash Trigger is now on red alert. This trigger went off before the 1987 Crash, the Tech Crash, and the 2008 Great Financial Crisis.

We detail this trigger, how it works, and what it’s saying about the market today in a Special Investment Report titled How to Predict a Crash.

Normally this report is only available to our paying clients, but in light of what’s happening in the markets today, we are making just 99 copies available to the general public.

To pick up one of the remaining copies…

CLICK HERE!

Graham Summers, MBA

Chief Market Strategist

Phoenix Capital Research

Posted by Phoenix Capital Research in stock collapse?

What Happens if China Dumps Its Treasury Holdings?

By Graham Summers, MBA | Chief Market Strategist

A very strange thing is happening in the markets.

Historically, when the stock market collapses, money flees stocks and floods into U.S. Treasuries. The reason for this is that Treasuries are considered a safe haven due to the fact that no matter what, the U.S. Government can always print money to pay back its lenders.

As a result of this, typically when stocks break down, bonds rally. In this sense, Treasuries are a market hedge, or at least act as a cushion against stock market losses.

Here’s where things get strange. During  this latest stock market collapse bonds is NOT rallying. Instead, bonds are selling off along with stocks!

Below is a chart of the S&P 500 (top box) and the 30 Year U.S. Treasury (bottom box). As you can see, bonds are collapsing at the same time as stocks. This makes no sense and runs contrary to one of the most basic rules of modern portfolio theory.

What is going on here?

China is one of the largest owners of U.S. debt. All told the People’s Republic of China (PBOC) owns about $750 billion in Treasuries. And by the look of things, China is starting to dump these bonds as part of the trade war.

Why would China do this?

Believe it or not, China’s economy is nowhere near as strong as the media claims. Youth unemployment is so bad that the country simply stopped publishing the data. The country’s policy of simply building things, demolishing them, and then building them again to maintain a high rate of GDP growth is no longer working (building then demolishing infrastructure doesn’t generate revenues or real growth).

Indeed, things are so bad that foreign investors are no longer plowing money into China’s economy: in 2023, foreign direct investment in China declined for the first time in 25 years!

Heck, even the Chinese stock market has gone nowhere for 20 years. This is NOT a sign of sustainable growth!

Put simply, China’s financial system is in VERY serious trouble.  And they are in desperate need of capital which is why it is highly likely they are beginning to dump their Treasury holdings, forcing Treasury bonds to collapse alongside stocks.

If this doesn’t improve soon, we could soon see an international crisis as China’s financial system breaks down in a major way. Which means…

This crisis/ bear market is NOWHERE near over.

Put simply, all of the above items are MAJOR warnings that a crisis is about to hit. This is no longer about tariffs… the Everything Bubble is bursting right before our eyes.

If you’ve yet to prepare for this, the time to act is NOW before the bear market hits.

Indeed, our proprietary Crash Trigger is now on red alert. This trigger went off before the 1987 Crash, the Tech Crash, and the 2008 Great Financial Crisis.

We detail this trigger, how it works, and what it’s saying about the market today in a Special Investment Report titled How to Predict a Crash.

Normally this report is only available to our paying clients, but in light of what’s happening in the markets today, we are making just 99 copies available to the general public.

To pick up one of the remaining copies…

CLICK HERE!

Graham Summers, MBA

Chief Market Strategist

Phoenix Capital Research

Posted by Phoenix Capital Research in Bank Crisis, Debt Bomb, stock collapse?, Trade Wars

By Graham Summers, MBA | Chief Market Strategist

The stock market is in a free-fall as Wall Street realizes that the Trump administration is serious about restructuring the global economy.

For decades, the dominant theme in trade and macroeconomics was globalization/ offshoring. This trend gutted America’s manufacturing and industrial base, effectively shifting millions of middle-class jobs overseas.

Why did American policymakers do this? What was the benefit to all these jobs and factories disappearing?

Corporate profits would rise as labor/ manufacturing overseas would greatly reduce costs. And since things would cost less to make, they’d sell for a cheaper price in the U.S.

In its simplest form, the political class in Washington told most of America: it’s OK that the factory and your job is gone because stocks will go up and things will be cheaper.

The Trump administration has decided to reverse this in a shock and awe campaign via tariffs. The goal is NOT the tariffs themselves… the goal is to FORCE companies to reopen factories, reshore manufacturing to the U.S.

Team Trump tried to warn that this was coming.

Treasury Secretary Scott Bessent stated point blank that the economy had become “addicted” to government spending and that it would need to undergo a “detox period.” And in a not so veiled jab against globalism, he stated that access to cheap goods is not the essence of the American dream.”

Commerce Secretary Howard Lutnick went even further, stating, “This is a re-ordering of global trade for the benefit of America.”

And perhaps the single most telling statement was when the President stated, “I haven’t even looked the stock market.”

The stock market FINALLY got the message and has entered a free-fall. Companies that rely extensively on offshore manufacturing have been completely OBLITERATED. Yesterday, Apple (AAPL) which depends on China and other nations to produce its products stock declined 10%.

Nike (NKE) which relies heavily on Vietnam (a nation Trump slapped with a 46% tariff) collapsed 14%.

By comparison, McDonalds (MCD) which sources most of its supplies from within the U.S. went up over 2%!

The message here is clear: in the new Trump economy, there will be clear winners and losers. Those stocks that are globalized will suffer while those that are primarily domestic will succeed.

Those portfolios that are correctly aligned for this be just fine… others, not so much.

On that note, we are putting together a special investment report designed to help investors navigate this new market environment. It’s titled The MAGA Portfolio and it will detail some of the investments that will win as Team Trump moves to restructure global trade.

Copies will be delivered to subscribers of our FREE daily market commentary Gains Pains & Capital. To join now and have your account in place so this report will be delivered to your inbox on Monday…

CLICK HERE NOW!

Best Regards

Graham Summers, MBA

Chief Market Strategist

Phoenix Capital Research

Posted by Phoenix Capital Research in It IS different this time., Recession Watch, stock collapse?

Did Trump Just “Liberate” Stocks From a Bull Market?

President Trump just unveiled the tariffs the U.S. will be placing on trading partners in the Rose Garden a few moments ago. It’s a YUUUUUUGE chart… and represents a tectonic shift in global trade.

Get a Load of That YUGE Chart!

Remember, 45% of S&P 500 revenues come from abroad. So if you think the U.S. can introduce all these tariffs without it hitting the stock market, I’ve got a bridge I’d like to sell you.

Indeed, the futures market just collapsed on the news. See for yourself, it’s only marginally over the March lows.

Speaking of tectonic shifts, investors are speaking with their money by yanking capital out of stocks for the perceived safety of bonds. And this is a GLOBAL phenomenon.

Bonds Are Crushing Stocks For the First Time in THREE YEARS

Below is a chart showing the ratio between the totality of stocks vs the totality of bonds. This is THE chart for asset allocators looking for clues as to what the markets are saying about stocks vs. bonds.

This ratio has just taken out its bull market trendline (blue line) as bonds have outperformed stocks for four months straight. Put simply, for the first time in over TWO YEARS, bonds are a better place for capital than stocks.

As I write this, the ITOT:IGOV ratio is sitting at critical support (green line). If it takes out that line, BUCKLE UP because stocks are in for a world of hurt and we could very well see a Crash.

Our Crash Trigger is On Red Alert!

IIndeed, our proprietary Crash Trigger is now on red alert. This trigger went off before the 1987 Crash, the Tech Crash, and the 2008 Great Financial Crisis.

We detail this trigger, how it works, and what it’s saying about the market today in a Special Investment Report titled How to Predict a Crash.

Normally this report is only available to our paying clients, but in light of what’s happening in the markets today, we are making just 99 copies available to the general public.

To pick up one of the remaining copies…

CLICK HERE!

Graham Summers, MBA

Chief Market Strategist

Phoenix Capital Research

Posted by Phoenix Capital Research in stock collapse?

 Ok, Now This is SERIOUSLY Bad News For Stocks

By Graham Summers, MBA | Chief Market Strategist

Today is “liberation day” according to the Trump administration.

President Trump believes that introducing tariffs against the U.S.’s trading partners will make things “fair” and stop the U.S. from being “ripped off.” Some Trump insiders have even gone so far as to claim that the U.S. will make so much money from the tariffs that it will be able to stop foisting income tax on its citizens.

Will this prove to be correct? I have no idea. What IS clear is that the trade wars have done SEVERE damage to the stock market. And likely triggered a recession in the process.

This below chart of the S&P 500 speaks for itself. The bull market trendline (blue line) has been destroyed. Even worse, stocks have taken out critical support (the green line) which is now acting as overhead resistance.

In simple terms, this is about as UGLY as a chart can get. There is NOTHING bullish about this.

Moreover, this is happening at a time when the U.S. economic data is SCREAMING recession.

The ISM Manufacturing Survey is a survey of managers at 400 different industrial companies located throughout the United States. It’s one of the most important economic data points there is as it represents the closest thing to a real-world measure of what’s happening on the frontlines of the economy.

The latest ISM Manufacturing Survey was ABYSMAL.

The survey reading fell to 49, which is a RECESSIONARY reading. New orders, which measure NEW business COLLAPSED to 45, which is DEEP into recessionary territory.

And worst of all, Prices Paid, which measures the prices firms are paying for goods and services RIPPED higher to 69. This is WAY above expectations of 62 and suggests that inflation is in fact ROARING back into the economy.

Add if all up, and this survey is SCREAMING “INFLATIONARY RECESSION.”

That is SERIOUSLY bad news. When recessions hit, the average stock market decline is 30%. This would mean that the recent bloodbath in the stock market isn’t even HALF of what we can expect to unfold.

A 30% decline for stocks brings the S&P 500 down to the lows 4,300s!

Indeed, our proprietary Crash Trigger is now on red alert. This trigger went off before the 1987 Crash, the Tech Crash, and the 2008 Great Financial Crisis.

We detail this trigger, how it works, and what it’s saying about the market today in a Special Investment Report titled How to Predict a Crash.

Normally this report is only available to our paying clients, but in light of what’s happening in the markets today, we are making just 99 copies available to the general public.

To pick up one of the remaining copies…

CLICK HERE!

Graham Summers, MBA

Chief Market Strategist

Phoenix Capital Research

Posted by Phoenix Capital Research in stock collapse?

It’s Official… the Economy is Starting to Break

By Graham Summers, MBA | Chief Market Strategist

I warned that the Fed was going to break something.

Well, things are starting to break. The latest round of economic data was disastrous.

Consumer confidence collapsed to its lowest reading since January 2021. As if that wasn’t bad enough, the Expectations Index, which is based on consumers’ views on income, business and labor market conditions, COLLAPSED to 65.2.

That is the lowest reading in 12 years. And it’s WAY below 80, which is usually the level at which predicts a recession.

Similarly, the Philadelphia Fed’s non-manufacturing index imploded to NEGATIVE 32.5. This is the lowest reading since 2020 which was during a PANDEMIC.

The writing is on the wall… unless something changes FAST, something BAD is coming in the economy. And when something BAD happens to the economy, stocks get slaughtered.

The last time President Trump and the Fed got into a pissing match, stocks took out the 200-DSMA, bounced, chopped around for a few weeks and then the REAL fireworks began.

Are stocks about to repeat this? They’ve just collapsed rapidly taking out their 200-DMA.

Pay attention here, the market might be signaling a “tell.”

To start receiving these kinds of actionable insights, join 56,000 readers in over 56 countries in receiving our daily market alert every weekday before the markets open (9:30AM EST).

Subscribe to Gains Pains & Capital!

Best Regards

Graham Summers, MBA

Chief Market Strategist

Phoenix Capital Research

Posted by Phoenix Capital Research in Central Bank Insanity, stock collapse?

Since 1980, This Has Signaled The Lows Are In 

By Graham Summers, MBA | Chief Market Strategist

The S&P 500 has now performed back to back “90% up days”.

A 90% up day is a day in which 90% or more of the stocks that comprise a stock market index rise. Historically, this is a very bullish development. And back to back 90% up days are even better! In fact, back to back 90% up days like the ones the S&P 500 staged on Friday and Monday are usually a hallmark of a market bottom!

As Ryan Detrick has noted, since 1980, two consecutive days with 90% advancing issues in the S&P 500 have resulted in positive returns 12 months out ~91% of the time. Even better, the median return over that time period is 16.5%.

See for yourself:

Put simply, a major metric is signaling to us that the odds greatly favor stocks have bottomed .  The odds favor a rally, NOT a crash.

To start receiving these kinds of actionable insights, join 56,000 readers in over 56 countries in receiving our daily market alert every weekday before the markets open (9:30AM EST).

Subscribe to Gains Pains & Capital!

Best Regards

Graham Summers, MBA

Chief Market Strategist

Phoenix Capital Research

Posted by Phoenix Capital Research in It's a Bull Market, stock collapse?

This is the Chart to Focus On This Week

By Graham Summers, MBA | Chief Market Strategist

Finally some good news!

On Friday, stocks experienced their largest single day gain of 2025. Friday was also a 90% up day: a day in which 90% of stock trading volume was upwards. This, along with several other metrics, is signaling a bottom is in and a bounce has begun. The bigger question is if this is a dead cat bounce or the start of a significant rally.

The markets are a lot like a rubber band: while they can stretch one way or the other and sometimes will reach extremes… but those periods usually resolve with a “snap back” move that brings the market more in line with its normal range, just as a rubber band will snap back from an extreme stretch to its normal resting position.

For stocks, one means of reading the degree of “stretch” is to chart the percentage of the index that is trading above or below the intermediate term trend: the 50-day simple moving average (DSMA).

When a large percentage (over 85%) of stocks are trading over this line, it usually means stocks are overbought and due to correct. Conversely, when a low percentage (below 40%) of stocks are trading above this line, it usually means stocks are oversold and forming a bottom.

You can see the latter phenomenon in the chart below. Anytime less than 40% of stocks in the S&P 500 are above their 50-DSMA, the market usually bottoms soon after. Bear in mind, this is correct in every market environment whether it be during a bear market and a correction that occurs in the context of a bull market.

So what is this metric saying today?

Only 30% of stocks in the S&P 500 are currently trading above their 50-DSMA. This is a strong signal that stocks are extremely oversold and likely forming a significant bottom. Remember, the last five times this low of a percentage of stocks were above their intermediate term trend, stocks kicked off a multi-week rally.

Put simply, a major metric is signaling to us that the odds greatly favor stocks bottoming right here and now. This is the only chart to focus on this week as the media and fintwit are all extremely bearish and calling for a crash.

The odds favor a rally, NOT a crash.

To start receiving these kinds of actionable insights, join 56,000 readers in over 56 countries in receiving our daily market alert every weekday before the markets open (9:30AM EST).

Subscribe to Gains Pains & Capital!

Best Regards

Graham Summers, MBA

Chief Market Strategist

Phoenix Capital Research

Posted by Phoenix Capital Research in It's a Bull Market, stock collapse?

Special Market Update: The Froth is Gone, a Low is Forming Right Here and Now

By Graham Summers, MBA | Chief Market Strategist

This might be the most brutal 10% correction in history. But the good news is that stocks should bottom shortly.

From a purely gain/ loss perspective, the overall indices are only down 10%. However, “under the hood” the damage to the stock market has been severe. The MAG 7 stock, which account for 30% of the S&P 500’s weight, are down ~20%.

As awful as this correction feels, in many ways this was to be expected. We are in the 3rd year of this bull market begun in 2022. Historically, the 3rd year is the most challenging one for bull markets. And with the S&P 500 having recorded truly incredible gains of ~20% in both 2023 and 2024, stocks were due for some increased volatility at least in the first half of 2025.

Put simply, this current period for stocks, while painful, is to be expected. It is not unusual, nor should we panic. And by the look of things, the lows are in or about to be in.

The Tech ETF (XLK) is at MAJOR support. It would be EXTRAORDINARY for it to take out this line right here and now.

Moreover, the ratio between growth and value stocks has fallen to test its 40-Week Simple Moving Average (the same as the 200-Day Simple Moving Average). This has historically marked THE lows for market pullbacks during this bull market begun in late 2022.

In the simplest of terms, ALL of the froth has been taken out of the markets. And with the inflation data, GDP and labor market cooling, the door is open to the Fed starting to ease monetary policy again.

To start receiving these kinds of actionable insights, join 56,000 readers in over 56 countries in receiving our daily market alert every weekday before the markets open (9:30AM EST).

Subscribe to Gains Pains & Capital!

Best Regards

Graham Summers, MBA

Chief Market Strategist

Phoenix Capital Research

Posted by Phoenix Capital Research in Central Bank Insanity, It's a Bull Market, stock collapse?

The Investors Who Fell For This Got Taken to the Cleaners!

By Graham Summers, MBA | Chief Market Strategist

Whoops!

You know your economic model is doing a terrible job when you watch it blow up in a matter of days. Recently, investors got a taste of that with the Atlanta Fed’s GDPNow measure. 

GDPNow is meant to be a real-time (rather than backwards looking) measure of economic activity. It’s a major “go to” tool for investors looking to monitor if the economy is expanding or starting to collapse.

I bring all of this up, because the GDPNow measure entered a free-fall in late February, with its growth rate plunging from 2.9% to NEGATIVE 2.8% in the span of just one month.

Seeing this, investors panicked, believing the economy was entering a recession at a rapid clip. I have little doubt that this contributed to the aggressive sell-off we’ve been seeing in stocks since late February.

There’s just one issue with GDPNow’s collapse: it’s 100% bogus.

It turns out that gold imports to the U.S. rose rapidly during this time from $13 billion to $36 billion, and the GDPNow model inaccurately took this to mean that the trade deficit was exploding which it interpreted as bad news for the economy.

Don’t believe me?

The Atlanta Fed issued a series of statements on X last Friday, in which it admitted that without this screw up, the model would show the economy was still growing by 0.4%, NOT collapsing by 2.4%!

See for yourself.

Talk about a screwup! The economic model that you tout as being one of if not THE best real-time measures of GDP proved to be practically worthless. Sorry to all the investors who saw this and panicked, thinking the U.S. was in recession!

If you’re looking for a high octane tool to determine whether or not to “buy the dips” during market correction, my proprietary Crash Trigger has got you covered. It tracks certain key developments that register before every major market meltdown.

I detail them, along with what they’re currently saying about the market today in a Special Investment Report How to Predict a Crash.

To pick up a free copy, swing by:

www.phoenixcapitalresearch.com/predictcrash-leadgen

Best Regards

Graham Summers, MBA

Chief Market Strategist

Phoenix Capital Research

Posted by Phoenix Capital Research in stock collapse?

Well, We Got a Bounce… What’s Next For Stocks?

By Graham Summers, MBA | Chief Market Strategist

Yesterday, I commented that it was “bounce or big trouble” time for stocks.

The reason for this? The S&P 500 had fallen 5% to test its 200-day simple moving average (DMA): a critical trendline for the bull market. 

What made this a critical situation? After all, a correction of this size (5%) is a relatively common occurrence. On average stocks drop by 5% at least once per year. So this should have been a clear “buy the dip” opportunity, right?

Not exactly.

Under the hood, the market was in a very precarious situation. Only half of its sectors remained in uptrends. Moreover, many individual companies had seen their share prices decline by 20% or more.

Put simply, while the overall indices were only down 5%, beneath the surface, stocks were trading like it was the start of a bear market. As a result of this, the test of the 200-DSMA was absolutely critical. If stocks didn’t bounce there, then we needed to prepare for a real bloodbath in the markets.

Fortunately, we got the bounce with the S&P 500 hitting its 200-DSMA briefly on an intraday basis before buyers came in. 

What now?

Stocks are up this morning, but we need to see some follow through on this bounce. After all, one day of gains isn’t a big deal for stocks. So while the bounce has helped, questions remain as to whether or not it will be sufficient to stop the downward momentum.

The good news is that high yield credit, which usually leads stocks, has NOT broken down in any significant fashion. This suggests that stocks could catch a major bid if they can look past the threat of tariffs and a trade war to the fact that underlying macro conditions have not worsened much if at all.

If you’re looking for a high octane tool to determine whether or not to “buy the dips” during market correction, my proprietary Crash Trigger has got you covered. It tracks certain key developments that register before every major market meltdown.

I detail them, along with what they’re currently saying about the market today in a Special Investment Report How to Predict a Crash.

To pick up a free copy, swing by:

www.phoenixcapitalresearch.com/predictcrash-leadgen

Best Regards

Graham Summers, MBA

Chief Market Strategist

Phoenix Capital Research

Posted by Phoenix Capital Research in stock collapse?

It’s “Bounce or Big Trouble ” Time For Stocks

By Graham Summers, MBA | Chief Market Strategist

The S&P 500 is getting into some serious trouble now.

Bounces are short-lived, lasting at most a day… bulls are refusing to commit… and the breakdown is now reaching serious levels from a technical analysis perspective.

To wit, the S&P 500 is now 2% below its 10-week simple moving average (this is the same as the 50-day simple moving average). During the last four years, the only time stocks have broken down more relative to this line was during the bear market of 2022 or at THE 2023 lows.

Put another way, stocks are at a critical point in this sell-off. Either stocks hold here and begin a significant bounce or the market dynamic has changed dramatically to the point of looking more like a bear market as opposed to a garden variety correction.

See for yourself.

Indeed another way of looking at price action is to note that the S&P 500 is now on the verge of breaking below its bull run trend line from the 2023 lows. This has happened once before during the August 2024 meltdown, but stocks need to catch a bid right here and now if things aren’t going to get REALLY messy.

Seeing this, many investors are asking themselves “are stocks about to Crash?!?”

To figure that out, I rely on certain key signals that flash before every market crash.

I detail them, along with what they’re currently saying about the market today in a Special Investment Report How to Predict a Crash.

To pick up a free copy, swing by:

www.phoenixcapitalresearch.com/predictcrash-leadgen

Best Regards

Graham Summers, MBA

Chief Market Strategist

Phoenix Capital Research

Posted by Phoenix Capital Research in stock collapse?

President Trump Has Saved the Markets… For Now 

By Graham Summers, MBA | Chief Market Strategist

Stocks got saved over the weekend when President Trump announced that the U.S. would be moving forward with its plans for a “Crypto Reserve” that would own multiple cryptocurrencies.

The specific post from Truth Social is below:

This post served several purposes for risk assets. The most significant are:

  1. It ignited a sharp rally in crypto currencies.
  2. It served as a kind of “Trump Put” on risk assets.

Regarding #1, the crypto space has been in decline for the last two months largely as investors became disillusioned with the progress the Trump administration was making in introducing crypto-based government funds. Bitcoin, the largest and most liquid crypto currency, had taken out critical support and was on the verge of erasing its entire post-election gains.

President Trump’s post on Truth Social reversed all of this, sending Bitcoin back into its former range. In the simplest of terms, crypto is back on the administration’s list of priorities. The next major bull run in crypto coins is likely here.

Which brings us to #2 in our list: President Trump’s post on Truth Social served as a kind of “Trump Put” on risk assets.

One of the hallmarks of Trump’s first term was his near constant tweeting/ talking about stocks any time the markets were in danger of breaking down in a major way. Thus far in Trump’s second term, these interventions have been absent even as stocks broke below their bull market trendline last week.

President Trump’s post on Truth Social was a clear signal that the “Trump Put” is back. In the very simplest of terms, Trump is watching the markets and intervening when risk assets get into trouble. 

The big question for investors is… will this work? Up until Trump intervened the markets were breaking down in a Big way, with some risk assets crashing 20%+ in a matter of days.

Put simply, are stocks about to Crash?!?

To figure that out, I rely on certain key signals that flash before every market crash.

I detail them, along with what they’re currently saying about the market today in a Special Investment Report How to Predict a Crash.

To pick up a free copy, swing by:

www.phoenixcapitalresearch.com/predictcrash-leadgen

Best Regards

Graham Summers, MBA

Chief Market Strategist

Phoenix Capital Research

Posted by Phoenix Capital Research in stock collapse?