
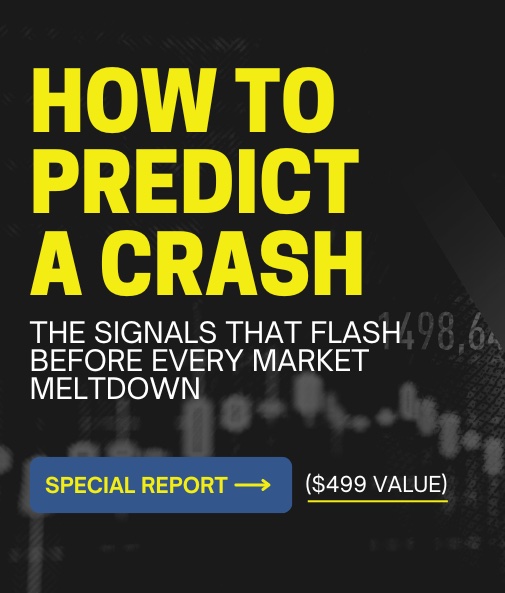
THE ONLY REPORT INVESTORS NEED TO KNOW WHEN TO GET OUT OF STOCKS
LISTEN TO OUR PODCAST.

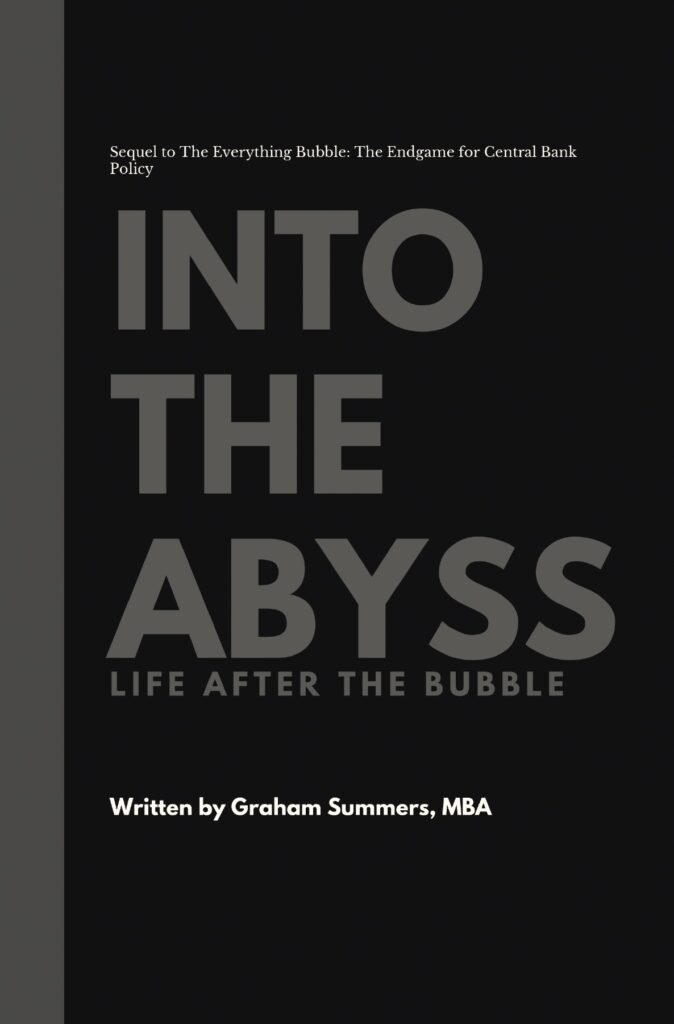
GRAHAM'S NEW BOOK WAS THE #1 NEW RELEASE IN FOUR CATEGORIES ON AMAZON
Category Archives: The Markets
I Sincerely Hope You Took Advantage of This!
By Graham Summers, MBA | Chief Market Strategist Two days ago, I wrote an article titled “Are the Markets Signaling a Peace Dividend?” Fast forward to today, and something of a cease fire is in place, though both Israel and … Continue reading
Posted in Geopolitics, stock collapse?, The Markets
Comments Off on I Sincerely Hope You Took Advantage of This!
Urgent Market Update: the Middle East
By Graham Summers, MBA | Chief Market Strategist Israel bombed Iran last night. This is a complicated situation and frankly no one (not even the President of the United States, apparently) has all the information. I make that last point … Continue reading
Posted in Geopolitics, The Markets, Weak $USD
Comments Off on Urgent Market Update: the Middle East
China Taps Out! The Trade War is Paused… Will Stocks Hit New Highs or Roll Over and Crash?
The U.S. and China unveiled a preliminary trade deal on Monday unleashing RABID buying in the stock market. Is this trade deal and subsequent stock market rally legit… or is this all just a headline driven bunch of BS and … Continue reading
Posted in The Markets, Trump 2nd Term
Comments Off on China Taps Out! The Trade War is Paused… Will Stocks Hit New Highs or Roll Over and Crash?
Will You Profit From the Coming Market Meltup?
By Graham Summers, MBA | Chief Market Strategist As we keep stating, a trade deal is coming between the U.S. and China. This means THE lows are in for the markets. Over the weekend, China officials met with their U.S. … Continue reading
Posted in The Markets, Trump 2nd Term
Comments Off on Will You Profit From the Coming Market Meltup?
President Trump Just Told Us What’s Coming…
By Graham Summers, MBA | Chief Market Strategist The Trump administration just gave one of the most blatant “tells” in investing history. Yesterday, President Trump told investors to “buy stocks” because the U.S. economy was going to be like a … Continue reading
Posted in The Markets, Trump 2nd Term
Comments Off on President Trump Just Told Us What’s Coming…
It’s Confirmed, China and the U.S. Will Meet to Make a Deal
By Graham Summers, MBA | Chief Market Strategist China just “tapped out.” When the Trump administration launched its trade war on 4/2/25, the media teemed with analysis that this approach was a colossal mistake, that China, not the U.S. was … Continue reading
Posted in It's a Bull Market, The Markets
Comments Off on It’s Confirmed, China and the U.S. Will Meet to Make a Deal
Is the Stock Market About to Crash?
“Are the markets about to reverse course and crash?” This is the #1 question on investors’ minds today. The stock market has just staged one of its most spectacular “V-shaped” recoveries in history. And many investors are wondering if the … Continue reading
Posted in Bank Crisis, Central Bank Insanity, stock collapse?, The Markets
Comments Off on Is the Stock Market About to Crash?
Is the Fed Trying to Crash Stocks?
By Graham Summers, MBA | Chief Market Strategist The #1 mandate for the Fed is to maintain financial stability. That is literally the Fed’s job. It’s supposedly why the Fed was created in 1913. The stock market just experienced one … Continue reading
Posted in It IS different this time., stock collapse?, The Dollar, The Economy, The Everything Bubble, The Markets
Comments Off on Is the Fed Trying to Crash Stocks?
Buckle Up, This Bull Market MIGHT Be Ending
By Graham Summers, MBA | Chief Market Strategist The markets are setting up for a big test. If they fail, we’re in for some REAL fireworks in stocks. I’ve been bullish on stocks for most of the last few weeks, … Continue reading
Posted in stock collapse?, The Markets
Comments Off on Buckle Up, This Bull Market MIGHT Be Ending
Will DOGE Have an Impact on Your Portfolio?
By Graham Summers, MBA | Chief Market Strategist By now you’ve no doubt heard that the Department of Government Efficiency (DOGE) is uncovering a truly jaw-dropping amount of fraud, waste, and abuse in the U.S. Federal Government. Some of the … Continue reading
Posted in stock collapse?, The Markets, We called it...
Comments Off on Will DOGE Have an Impact on Your Portfolio?
How Trump’s Negotiating Strategies Can Make You Money
By Graham Summers, MBA | Chief Market Strategist Thus far, the Trump tariff wars are following a negotiation framework that Trump has used throughout his career in commercial real estate. That pattern: Regarding #1, anchoring is a psychological phenomenon through … Continue reading
Posted in The Economy, The Markets, Trump 2nd Term
Comments Off on How Trump’s Negotiating Strategies Can Make You Money
Is THE Top in For Stocks?
By Graham Summers, MBA | Chief Market Strategist Editors note: Chief Market Strategist Graham Summers, MBA will be on the Schilling Show radio program today at 1:30 EST. You can listen in here. Everywhere I look, I see investors proclaiming … Continue reading
Posted in The Markets, Trump 2nd Term
Comments Off on Is THE Top in For Stocks?
You Can Use This Tool to Save Your Portfolio From a Crash
By Graham Summers, MBA | Chief Market Strategist Is the stock market about to crash? Everywhere I look on social media, the defining narrative is that the stock market is in a massive bubble that is about to burst, triggering … Continue reading
Posted in stock collapse?, The Markets
Comments Off on You Can Use This Tool to Save Your Portfolio From a Crash
Our Next Prediction For Stocks Is…
By Graham Summers, MBA | Chief Market Strategist The stock market is setting up to offer a buying opportunity in the next week or two. The S&P 500 hit a new all-time high last week. Every dip was bought as … Continue reading
Posted in stock collapse?, The Markets
Comments Off on Our Next Prediction For Stocks Is…
This is How Successful Investors Think About Stocks (And You Can Too).
By Graham Summers, MBA Stocks hit new all time highs last week. The reasoning here is quite simple: the economy is growing and the Fed has signaled it will start easing rates soon. This is something of a goldilocks scenario. … Continue reading
Posted in The Markets
Comments Off on This is How Successful Investors Think About Stocks (And You Can Too).
The Second Wave of Inflation Has Arrived
By Graham Summers, MBA | Chief Market Strategist I warned time and again that the Fed was making a massive policy mistake that would unleash another round of inflation. By quick way of review, the Fed stopped raising interest rates … Continue reading
Posted in Inflation, Recession Watch, The Markets
Comments Off on The Second Wave of Inflation Has Arrived
Three Questions to Ask Any Guru Opining on the Situation in the Middle East
By Graham Summers, MBA War has broken out in the Middle East. As usual, everyone is attempting to have an “expert” take on this situation. The reality is that less than one in 10,000 of the people speaking on this … Continue reading
Posted in The Markets
Comments Off on Three Questions to Ask Any Guru Opining on the Situation in the Middle East
Two Charts That Can Help You See What’s to Come For the Markets
By Graham Summers, MBA The market rally in 2023 has been driven by tech, specifically, Big Tech (Apple, Microsoft, Nvidia, Alphabet, etc.). While a handful of large companies have driven the stock market gains, the vast majority of stocks are … Continue reading
Posted in The Markets
Comments Off on Two Charts That Can Help You See What’s to Come For the Markets
Technical Setup: A Correction is Coming
Let’s set politics aside today and focus on the stock market. From a technical analysis perspective, the market has become extremely overstretched and is due for a correction. The S&P 500 is trading above its monthly Bollinger Bands to the upside (red … Continue reading
Posted in The Markets
Comments Off on Technical Setup: A Correction is Coming
Something BAD is About to Happen, and 99% of Investors Will Get Hurt By It
Things are beginning to get out of control in currency land. The $USD is collapsing. Astute chart readers will note that the $USD has already experienced two sharp drops in the last few months (blue rectangles in the chart below). … Continue reading
Posted in The Markets
Comments Off on Something BAD is About to Happen, and 99% of Investors Will Get Hurt By It
