stock collapse?

Four Charts Every Trader Needs to See Today

By Graham Summers, MBA | Chief Market Strategist

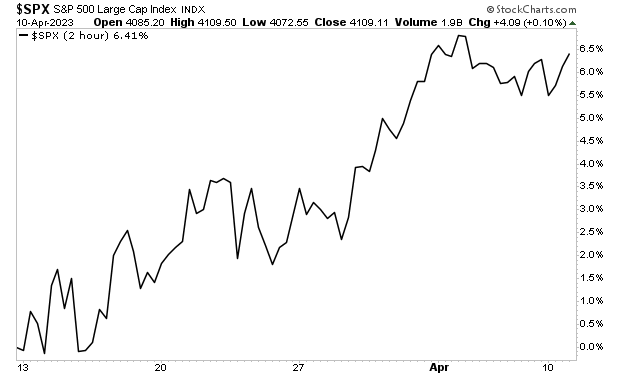
The S&P 500 looks primed for a correction of sorts.

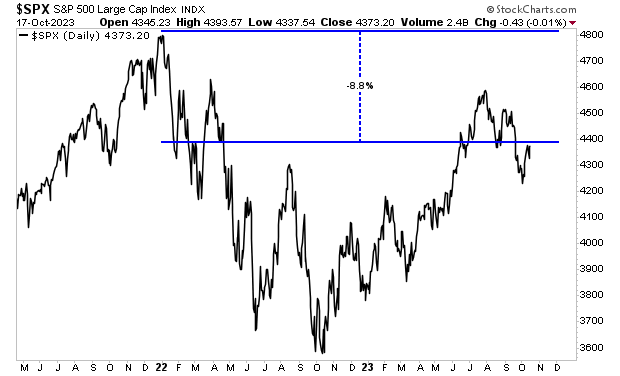
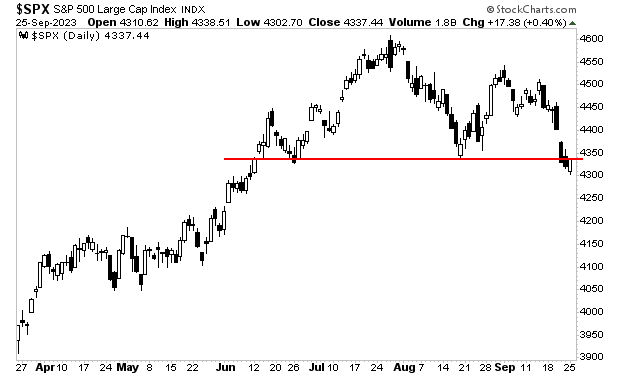
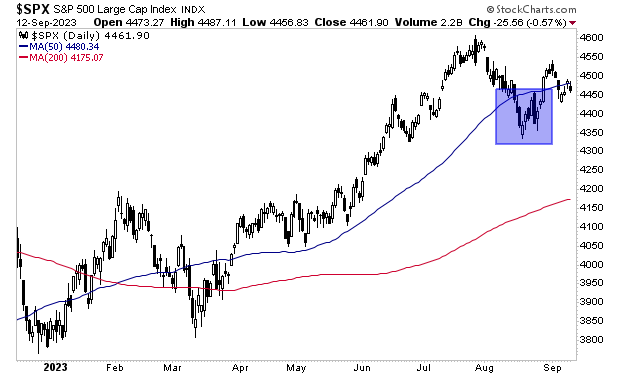
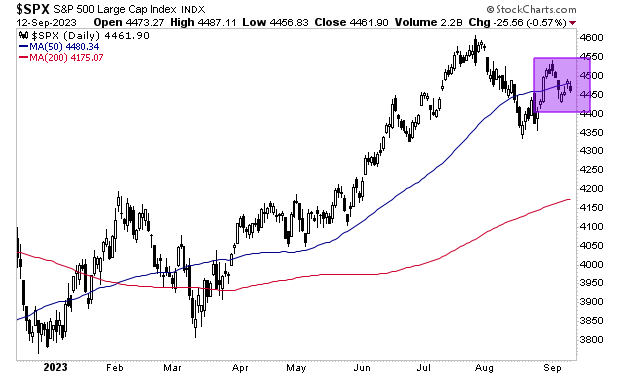
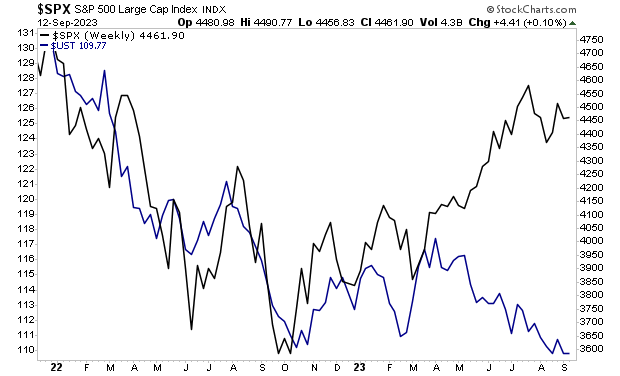
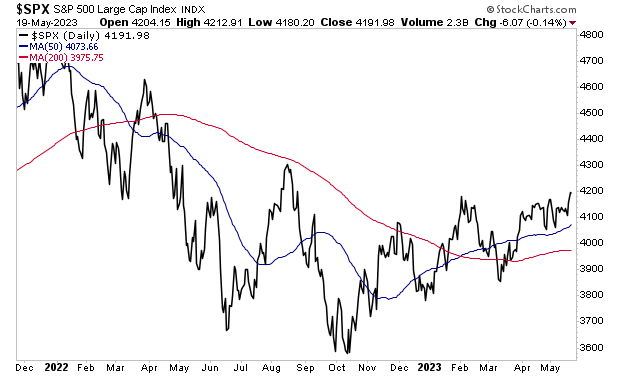
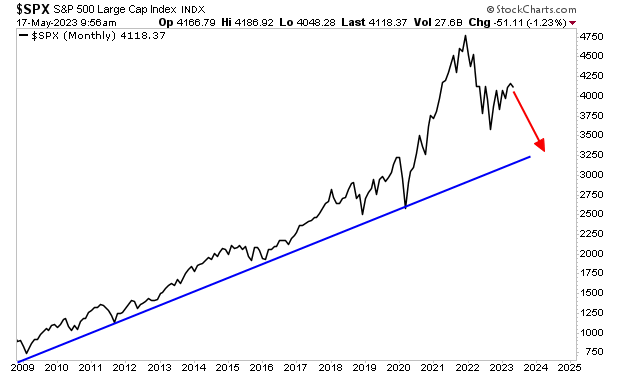
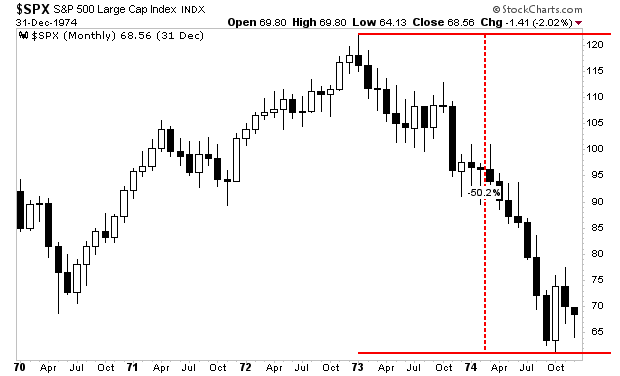
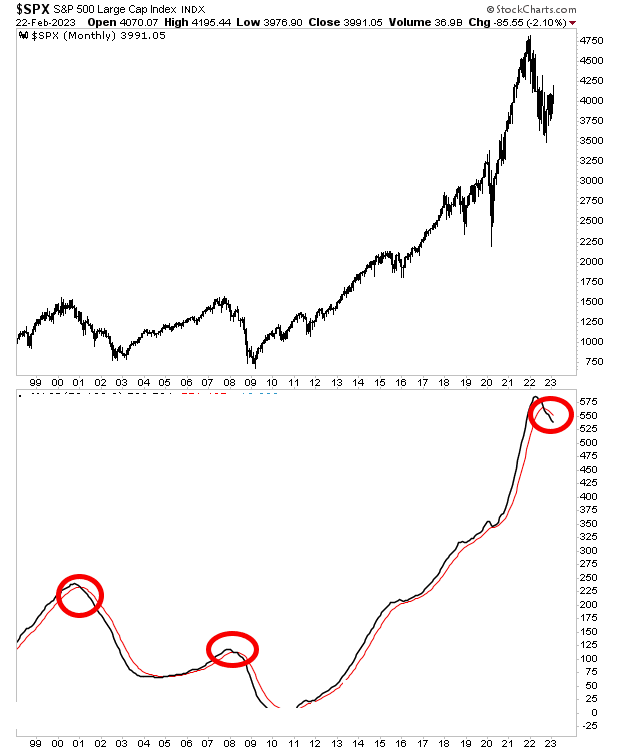
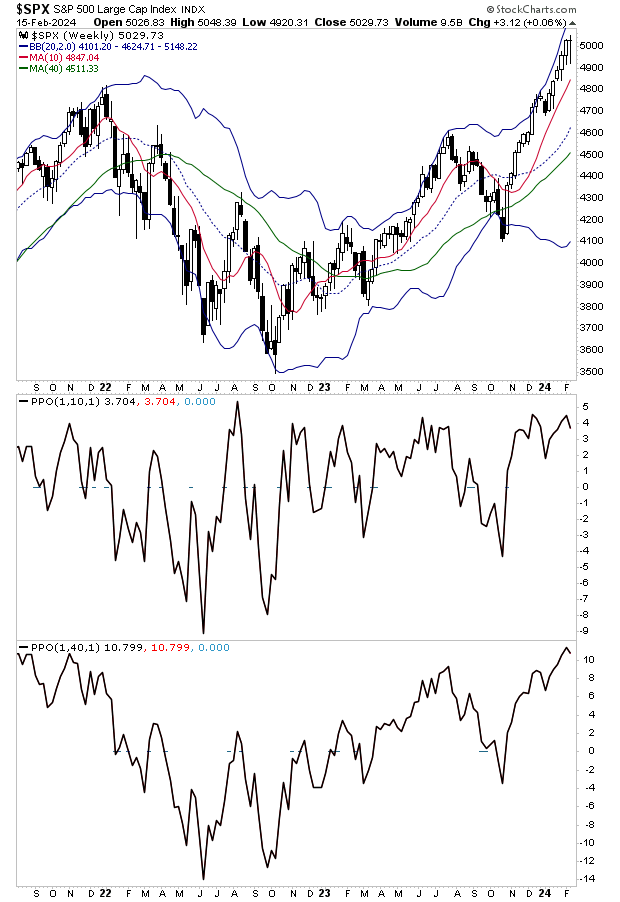
As I’ve noted previously, the  S&P 500 is quite extended above both its 10-week moving average (same as the 50-DMA) as well as the 40-week moving average (same as the 200-DMA). Historically, this degree of extension above both trendlines has marked a temporary top as the below chart illustrates.

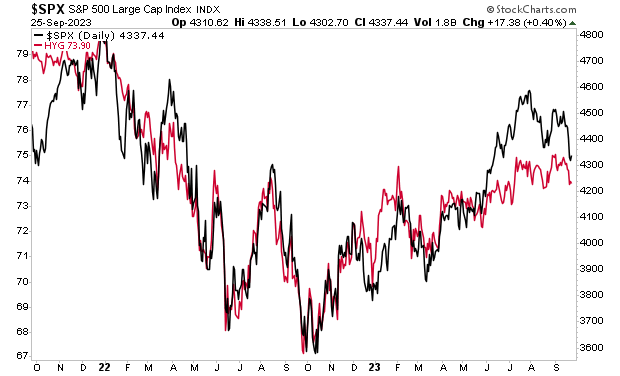
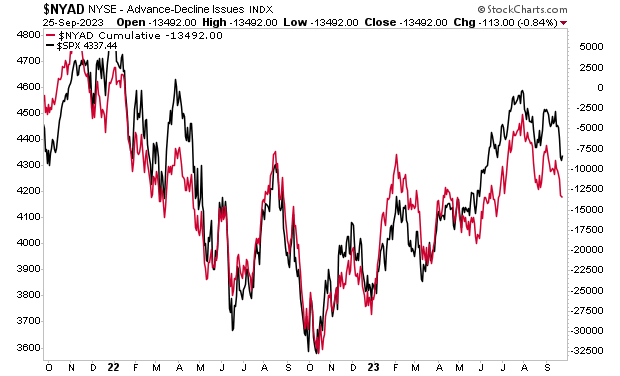
Beyond this,  NO sector is outperforming the S&P 500 at this time (maybe with the exception of Communication Services).

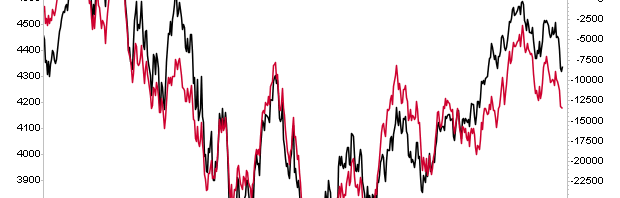
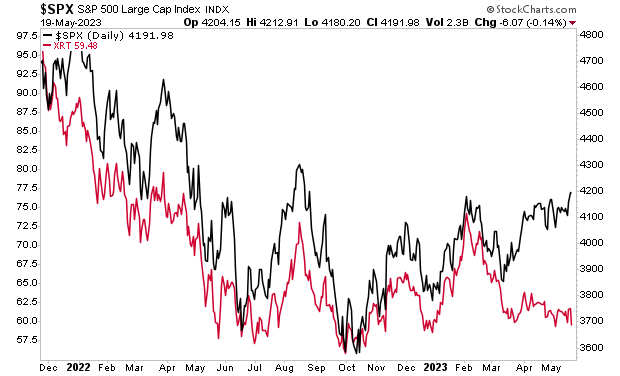
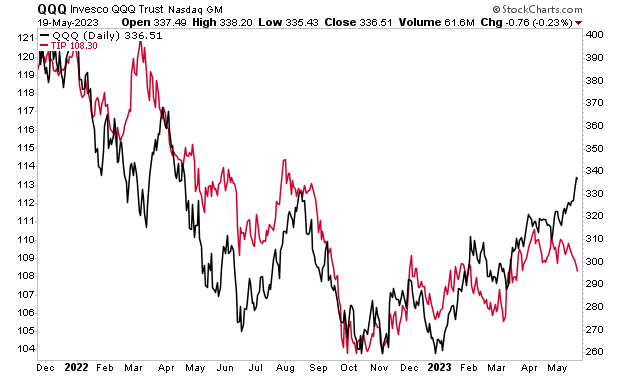
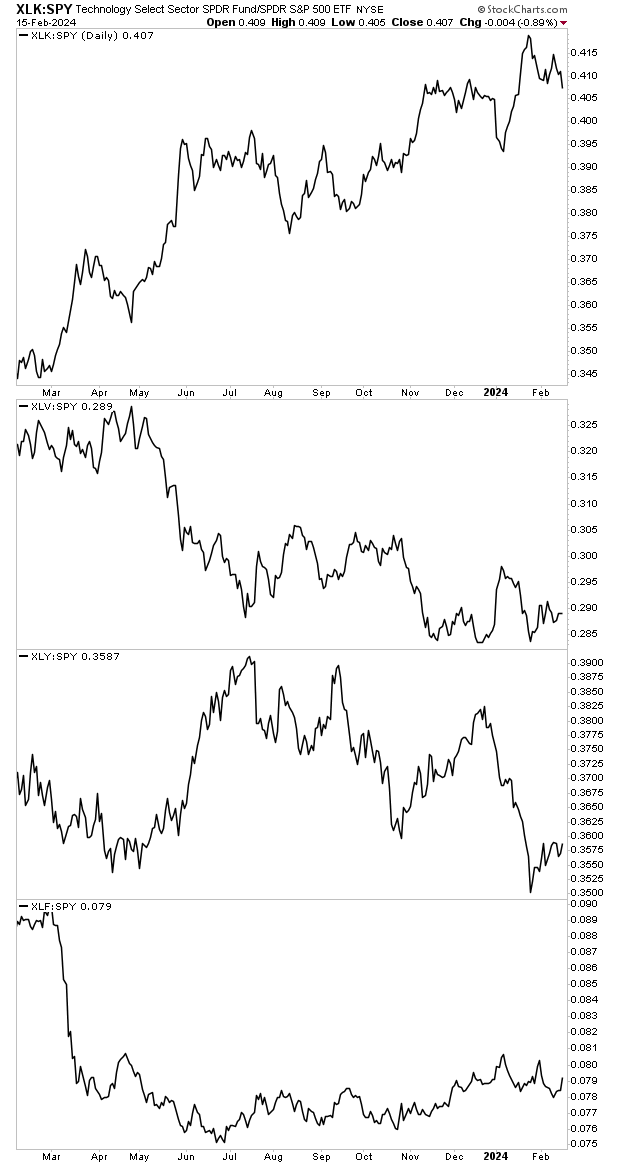
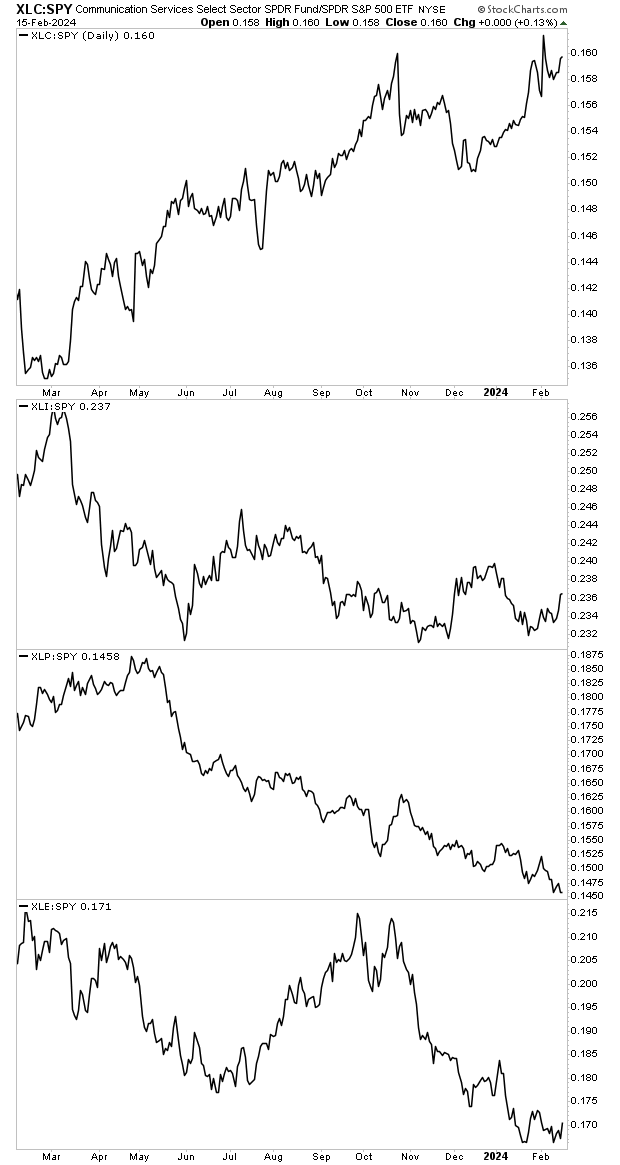
Below are three charts showing the ratio performance between each sector in the S&P 500 and the broader index. When the individual sector outperforms, the line rises. When the individual sector underperforms, the line falls. As you’ll note, NO SECTOR is leading the market higher right now.

Tech, Healthcare, Consumer Discretionary and Financials:

Communication Services, Industrials, Consumer Staples, and Energy.

Utilities, Real Estate and Materials:

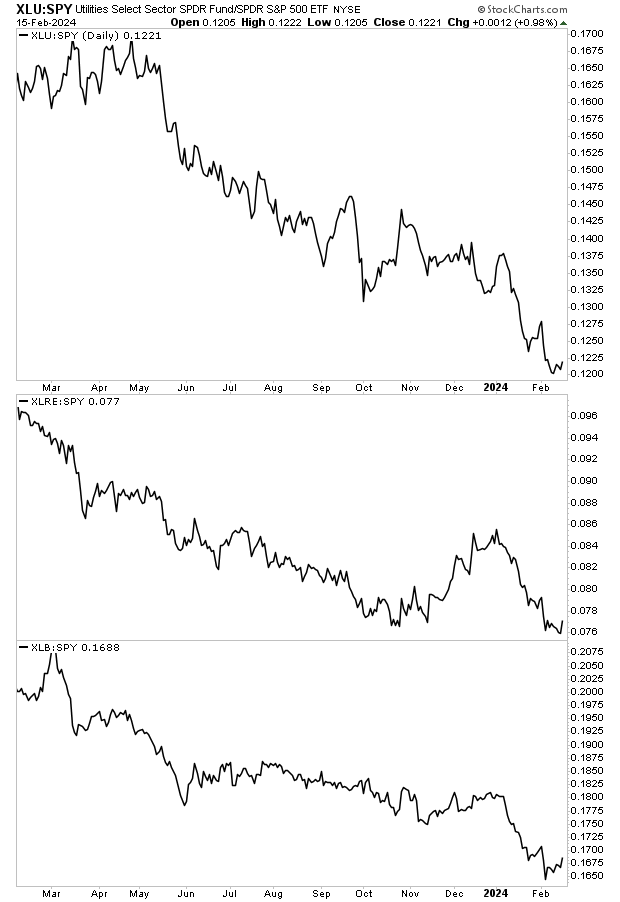
Looking at the above ratios, we note that Tech, Consumer Discretionary, Financials and Real Estate lead the market higher during the rally from early November until the end of 2023. However, today, not one single sector is leading the overall market higher (maybe with the exception of Communication Services). Even the Tech sector, which usually is a market leader has been underperforming the broader index since January.

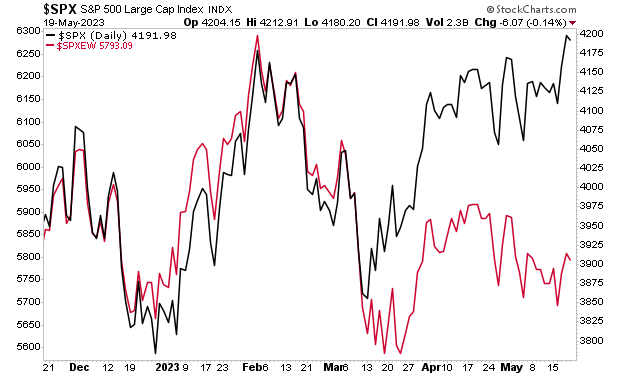
So how has the market held up despite every sector underperforming?

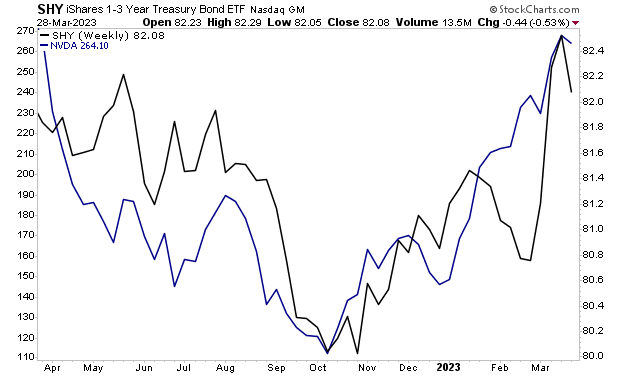
A handful of stocks have pulled the overall market higher. Specifically, Nvidia (NVDA), Amazon (AMZN), Meta (META), and Eli Lilly & CO (LLY). Remove those companies from the S&P 500 and stocks are effectively flat.

Add it all up, and the above analysis suggests that “under the surface” the S&P 500 could see a decent correction of 5% or more in the coming weeks. Only a small handful of stocks are holding everything up. This combined with our overbought and overextended the market is suggests the momentum  for the next market move will be DOWN.

If you’re looking to take your trading to the next level, we’ve identified a simple strategy for profiting from the market that is on par with anything before.

If you’re looking to take your trading to the next level, we’ve identified a simple strategy for catching rallies, avoiding corrections, and potentially beating the market by a wide margin. And best of all, it only takes about five minutes a day to use it! And yet, despite this simplicity, it is INCREDIBLY profitable.

To find out what it is and how it works, all you need to do is join our FREE daily investment commentary GAINS PAINS & CAPITAL. You’ll immediately be given access to an investment report detailing this trading strategy so you can start using it today!

To do so, go to:

gainspainscapital.com/simplestrategy

Posted by Phoenix Capital Research in stock collapse?

I Guarantee You Most Investors Aren’t Ready For This

By Graham Summers, MBA

The yield on the 2-Year U.S. Treasury hit a new high yesterday.

Why does this matter?

Because…

1) It indicates the Fed’s fight to tame inflation is NOT done.

2) Stocks are in for a world of hurt in the coming months.

Regarding #1, back in May 2023, the 2-Year U.S. Treasury was anticipating that the Fed would have rates at 3.75% in May of 2025. At the time, this meant the Fed would cut rates at least two times before May of 2025 (rates were at 5.25% in May 2023).

Fast forward to today, and the 2-Year U.S. Treasury has just broken out to new highs of 5.20%. This means the market is now anticipating that the Fed will have cut rates possibly ONCE by October of 2025. Moreover, the idea that rates will be ABOVE 5% instead of BELOW 4% in late 2025 is a HECK of a shift.

Put simply, the bond market is figuring out that the Fed will need to keep rates MUCH higher for MUCH longer. And this brings us to #2 in our list above.

Stocks are in for a world of hurt.

Stocks are priced based on Treasury yields. This is one of the primary reasons why stocks remain down almost 10% from their all-time highs despite the fact the economy is growing. After all, if you can earn 5.25% risk free in bonds for two years, why risk putting your money into much riskier stocks where both the earnings yield AND the dividend yield are lower (4.07% and 1.62%, respectively).

The great crisis of our lifetimes is fast approaching.

In 2000, the Tech Bubble burst.

In 2007, the Housing Bubble burst.

The long term U.S. Treasury bubble burst in 2022. And the crisis is now approaching.

Smart investors are already taking steps to prepare for this.

If you’ve yet to take steps to prepare for what’s coming, we just published a new exclusive special report How to Invest During This Bear Market.

It details the #1 investment to own during the bear market as well as how to invest to potentially generate life changing wealth when it ends.

Normally this report would be sold for $249. But we are making it FREE to anyone who joins our Daily Market Commentary Gains Pains & Capital.To pick up your copy, swing by: 

https://phoenixcapitalmarketing.com/BM.html

This image has an empty alt attribute; its file name is signature.jpg
Posted by Phoenix Capital Research in Debt Bomb, stock collapse?
Three Charts Every Investor Needs to See Today

Three Charts Every Investor Needs to See Today

By Graham Summers, MBA

Stocks broke down badly over the last two days.

The line in then sand for the S&P 500 was 4,460. Stocks broke through it on Friday. They failed to reclaim it yesterday. This is quite bearish.

Unfortunately, there’s more room to go for this drop. High yield credit which usually leads stocks is showing us what’s coming.

The picture is even uglier when we take a look at market breadth. Again, this usually leads the index.

If you’ve yet to take steps to prepare for what’s coming, we just published a new exclusive special report How to Invest During This Bear Market.

It details the #1 investment to own during the bear market as well as how to invest to potentially generate life changing wealth when it ends.

Normally this report would be sold for $249. But we are making it FREE to anyone who joins our Daily Market Commentary Gains Pains & Capital.

To pick up your copy, swing by:

https://phoenixcapitalmarketing.com/BM.html

This image has an empty alt attribute; its file name is signature.jpg
Posted by Phoenix Capital Research in stock collapse?

Did Stocks Just Kiss Good-Bye?

By Graham Summers, MBA

Nearly every market collapse follows a particular pattern.

That pattern?

1) Stocks break down below a critical level of support.

2) Stocks rally to “kiss” this former support, failing to reclaim it.

3) Stocks roll over and the real collapse begins.

This pattern is now playing out with the S&P 500.

The S&P 500 first broke below its 50-day moving average (DMA) in August of 2023. This was a significant development as it was the first time the S&P 500 had lost this support since the March 2023 lows. I’ve illustrated this with a blue rectangle in the chart below.

The market then rallied to retest the 50-DMA from below. It briefly broke above this line in early September, but has failed to hold it.This represents the “kiss” as I mentioned earlier: when stocks try to reclaim critical support but fail to do so. I’ve illustrated this with a purple square in the chart below.

What comes next?

Bonds have been telling us for weeks. It’s just a matter of time before stocks “get it.”

If you’ve yet to take steps to prepare for what’s coming, we just published a new exclusive special report How to Invest During This Bear Market.

It details the #1 investment to own during the bear market as well as how to invest to potentially generate life changing wealth when it ends.

To pick up your FREE copy, swing by:

https://phoenixcapitalmarketing.com/BM.html

This image has an empty alt attribute; its file name is signature.jpg
Posted by Phoenix Capital Research in stock collapse?

Warning: Investors Are Buying Stocks Based on FAKE Jobs Numbers

By Graham Summers, MBA

Last week, I noted that the Bureau of Labor Statistics (BLS) and other government agencies have been engaging in a strange scheme.

That scheme?

Releasing economic data that initially suggests the economy is booming, only for that same data to be revised downward multiple times in subsequent months.

Some people think the BLS is massaging the data the make Bidenomics look more successful that it really is. Others simply believe that the BLS is using faulty economic models (after all, how accurate is your model if it needs two or three revisions to be correct?).

Regardless of the reason, this issue continues to happen. And investors keep falling for it!

Case in point, last Friday, the BLS released the non farms payroll numbers for August 2023. And once again, you guessed it, the prior months (June and July) were revised lower. And not by a little: June’s NFP number was revised down by 80,000 jobs, while July’s was revised downward by 30,000 jobs. 

Bear in mind, June’s initial NFP number of 209,000 had already been revised downward by  24,000 jobs in July. So with this second downward revision of 80,000 jobs, we now know that HALF of the jobs in the June NFP report were FAKE.

1st revision (24,000) + 2nd revision (80,000)=104,000 FAKE jobs. 

104,000 Fake Jobs / 209,000 Jobs Claimed = 49.7% of the jobs were fake.

As I mentioned a moment ago, the August NFP report also revised July’s job numbers down by 30,000. So when we add this to the 104,000 fake jobs “created” in June, we’re now up to 134,000 FAKE jobs being created in the last two months.

As if that wasn’t bad enough, as Bill King noted in his King Report, seasonal adjustments were boosted to make August’s NFP numbers look better. In 2022, the BLS adjusted August’s NFP numbers upward by 47,000. But for some reason, this very same seasonal adjustment accounted for 117,000 jobs.

Put another way, we already know that 70,000 of the 187,000 jobs the BLS claims the economy generated in August were due to a seasonal adjustment, as opposed to being real jobs created in the economy. 

Oh, and bear in mind, July’s numbers have only been revised down once thus far. They will likely be revised down again next month. And we can expect a similar thing to happen for August’s NFP numbers as well.

Indeed, as ZeroHedge recently pointed out, these downward revisions have occurred for every single month in 2023 thus far.

Why does all of this matter?

Because investors are pouring billions of dollars of capital into stocks based on those initial jobs numbers. Check out the below chart and you’ll see what I mean.

These folks are in for a RUDE awakening in the coming weeks. The signs are now clear that the economy is slowing. And this is happening at a time when investors are paying 19 times forward earnings for stocks!

The only time stocks were previously this richly valued was when A) the economy was expanding rapidly and B) the Fed was printing trillions of dollars in new month.

Today the economy is rolling over… and the Fed is DRAINING liquidity from the financial system. So again, investors are buying stocks based on a fantasy.

If you’ve yet to take steps to prepare for what’s coming, we just published a new exclusive special report How to Invest During This Bear Market.

It details the #1 investment to own during the bear market as well as how to invest to potentially generate life changing wealth when it ends.

To pick up your FREE copy, swing by:

https://phoenixcapitalmarketing.com/BM.html

This image has an empty alt attribute; its file name is signature.jpg
Posted by Phoenix Capital Research in stock collapse?

Investors Are Making a Crucial Mistake Here… Don’t Be One of Them!

By Graham Summers, MBA

One of the hallmarks of the Biden Presidency is that economic data is released that looks fantastic at first glance… only to then be revised much lower in subsequent months.

Conspiracy theorists believe this indicates that the Bureau of Labor Statistics (BLS) and other bean-counter agencies are massaging the data to make the economy look better than it is in order to push a narrative that Bidenomics works. Other people simply believe that the reason data is continually being revised lower is because the economic models the BLS and other agencies use are garbage with little value (after all, how great can the model be if it needs to be revised two or three times to get an accurate number).

Regardless of the reason this is happening, the impact is the same: investors are buying stocks based on a fantasy that the economy is booming.

The formula is as follows:

1) The initial data released about jobs or GDP or some other metric looks quite strong.

2) Investors pile into stocks based on the notion that the economy is booming.

3) The data is revised lower, usually more than once.

The key item here is that investors DON’T sell stocks at a later date based on the downward revisions… in fact, few if any investors even bother keeping track of this stuff. And that’s the problem: people are buying based on the illusion of strong economic growth when in reality the growth is much weaker if not indicative of contraction! 

As Zerohedge noted a few days ago, the monthly payrolls report has been revised lower every single month in 2023. Again, this is not just one or two months with downward revisions… it’s every. single. month.

Now, you could easily argue that these downward revisions are simply because the BLS’s models are useless, but that’s missing the point: the headline data, or the data that investors use to justify buying stocks at 19 times forward earnings, is WRONG.

In fact, if we dig into less popular data that isn’t broadcast by the financial media, we get a VERY DIFFERENT picture of the U.S. economy.

Take a look at the official job openings data taken from the Federal Reserve. Again, this is official data showing how many jobs are currently available in the U.S. economy. If the economy is booming and businesses are hiring people to expand their operations, why is this number cratering in ways usually associated with a recession.

Meanwhile, investors are bidding stocks higher and higher. As I write this, the stock market is priced at 19 times forward earnings. The only time stocks are this richly valued is when A) the economy is expanding rapidly and B) the Fed is printing trillions of dollars in new month.

Today the economy is rolling over… and the Fed is DRAINING liquidity from the financial system. So again, investors are buying stocks based on a fantasy. 

If you’ve yet to take steps to prepare for what’s coming, we just published a new exclusive special report How to Invest During This Bear Market.

It details the #1 investment to own during the bear market as well as how to invest to potentially generate life changing wealth when it ends.

To pick up your FREE copy, swing by:

https://phoenixcapitalmarketing.com/BM.html

This image has an empty alt attribute; its file name is signature.jpg
Posted by Phoenix Capital Research in stock collapse?

One of These is Wrong… Will You Profit From What’s Coming?

By Graham Summers, MBA

Everything hinges on bonds today.

If longer duration Treasury yields continue to drop, then stocks will find a bottom of sorts. But if Treasury yields continue to rise, particularly on the all-important 10-Year U.S. Treasury, then stocks will be repriced to much lower levels.

As the below chart from Dr Ed Yardeni illustrates, the S&P 500 is currently trading at around 19 times forward earnings. This is an extremely RICH valuation given that the yield on the 10-Year U.S. Treasury is around 4.25%.

Consider that the last time stocks were this richly valued was early 2022 BEFORE the Fed started tightening monetary policy. At that time, the yield on the 10-Year U.S. Treasury was around ~2%. Obviously corporate earnings are now much higher, but the point is that the stock market is priced at a VERY high multiple given where the risk-free rate of return is trading right now.

Something has to give. Either Treasury yields are about to drop hard… or stocks will collapse. And smart investors who are properly positioned for this will see extraordinary returns.

If you’ve yet to take steps to prepare for what’s coming, we just published a new exclusive special report How to Invest During This Bear Market.

It details the #1 investment to own during the bear market as well as how to invest to potentially generate life changing wealth when it ends.

To pick up your FREE copy, swing by:

https://phoenixcapitalmarketing.com/BM.html

This image has an empty alt attribute; its file name is signature.jpg
Posted by Phoenix Capital Research in stock collapse?

This is the Most Important Chart in the World

By Graham Summers, MBA

Ever since the U.S. abandoned the Gold Standard in 1971, U.S. debt, also called Treasuries have become the bedrock of our financial system. 

Put in the very simplest of terms, Treasuries are the senior most asset class, with their yields representing the “risk free” rate of return against which all risk assets (stocks, real estate, commodities, etc.) are priced.

Treasury yields are the reason stocks exploded higher from the April 2020 lows. They are also the reason stocks peaked and began a bear market in March 2022. And they are the reason stocks bottomed in October 2022, igniting one of the best bull runs in recent history.

I mention all of this because the yield on the 10-Year U.S. Treasury, which is the single most important bond in the world, has recently hit new highs. And if it doesn’t stop right here and now, stocks are primed for a major collapse.

How major?

The last time the yield on the 10-Year U.S. Treasury was at its current level, the S&P 500 was trading at 3,600. Today it’s at 4,400.

See for yourself.

Sure, stocks might hold up with Treasury yields at these levels for a time. But the clock is ticking. And it’s only a matter of time before we get a NASTY risk off move.

If you’ve yet to take steps to prepare for what’s coming, we just published a new exclusive special report How to Invest During This Bear Market.

It details the #1 investment to own during the bear market as well as how to invest to potentially generate life changing wealth when it ends.

To pick up your FREE copy, swing by:

https://phoenixcapitalmarketing.com/BM.html

This image has an empty alt attribute; its file name is signature.jpg
Posted by Phoenix Capital Research in stock collapse?

There’s Something “Unusual” About This Market Rally… I Think I Know What It Is

By Graham Summers, MBA

The stock market sure look bullish, doesn’t it?

The S&P 500 has managed to start turning its 200-day moving average (DMA) upwards. This is a significant development is at it indicates that the intermediate to long-term trend is on the verge of becoming “up.”

As positive as this seems, beneath the surface of the markets there are a lot of glaring divergences developing.

Divergences occur when two assets that typically trade in line with each other start to diverge. These kinds of developments tell us that something unusual is happening in the market. Sometimes it’s not a bit deal. Other times, like in late 2007 or just before the shut-downs in 2020, these divergences serve as a warning that a crash or black swan event is about to hit.

On that note, let’s consider some of the more glaring divergences taking place today. 

The Retail ETF (XRT) tracks the performance of 90 retailers in the U.S. As such it serves as a decent proxy for the consumer. And XRT has NOT participated in this rally at all. In fact, it’s rapidly approaching its October 2022 lows. 

There are other, similar divergences all over the markets.

Tech stocks usually trade in line with inflation-adjusted Treasuries. The reason for this is that Tech is priced based on where “real,” or inflation adjusted, Treasury yields are trading. When yields are relatively low, investors pile into tech because it is a high growth sector.

With that in mind, there is a large divergence between tech stocks and inflation-adjusted Treasuries today. Someone is “wrong” here.

These are just two examples of major divergences, but there are literally over a dozen happening in the stock market right now. Something is very, very “off” about this market rally in stocks.

And I think I know what it is.

What’s happening is that the overall market is being pushed higher by a handful of large tech companies. Because these companies account for nearly 25% of the S&P 500’s overall weight, their outperformance is forcing the overall market to move higher despite all these divergences. 

Indeed, when we strip out the effect of these companies with an “equal weight” stock market index, this dynamic becomes clear. MOST of the companies in the S&P 500 are down. Only a small handful are up. They just happen to be the largest companies both in terms of size and in terms of index weighting.

How will this play out?

Sometimes divergences resolve with the trailing assets playing “catch up.” However, when there are so many divergences occurring across so many different areas of the market, this is unlikely.

What’s far more likely is that the markets nose-dive in the near future. Many analysts will tell you “ no one saw this coming!” but now you know better.

For those looking to prepare and profit from this mess, our Stock Market Crash Survival Guide can show you how.

Within its 21 pages we outline which investments will perform best during a market meltdown as well as how to take out “Crash insurance” on your portfolio (these instruments returned TRIPLE digit gains during 2008).

To pick up your copy of this report, FREE, swing by:

https://phoenixcapitalmarketing.com/stockmarketcrash.html

Posted by Phoenix Capital Research in stock collapse?

Signs of a Recession Are Growing…

Is the economy just about to roll over?

Copper, the commodity with a PhD in economics, has erased all of its year to date gains. It’s currently about 10% off its 2022 lows which marked the low for risk assets before this current bear market rally began.

A picture containing text, screenshot, diagram, font

Description automatically generated

It’s a similar story for oil, which is just slightly off its 2023 lows and down 46% from its 2022 highs.

A picture containing text, screenshot, diagram, font

Description automatically generated

Steel doesn’t look good trading at new lows for 2023.

Ditto for aluminum.

A picture containing text, diagram, screenshot, plot

Description automatically generated

As well as lumber.

Is this demand destruction? Or is it the result of the Fed tightening monetary policy and taking out some of the froth from the financial system?

The bond market suggests its demand destruction. The 2s10s, which has predicted every recession since 1955 is suggesting a severe recession is coming.

A picture containing text, font, line, screenshot

Description automatically generated

What do you think this will do to stocks?

A picture containing text, line, screenshot, plot

Description automatically generated

If you’ve yet to take steps to prepare for what’s coming courtesy of the banking crisis, we have published an exclusive special report How to Invest During This Bear Market.

It details the #1 investment to own during the bear market as well as how to invest to potentially generate life changing wealth.

This report is usually $250, but we’re giving away 100 copies for FREE to those who sign up for our free daily market commentary.

Today is the last day this report is available to the general public.

To pick up one of the remaining copies, use the link below…

https://phoenixcapitalmarketing.com/BM2.html

A close-up of a logo

Description automatically generated with medium confidence
Posted by Phoenix Capital Research in Recession Watch, stock collapse?

What Happened Yesterday… and Why Regional Banks Are in Trouble

By Graham Summers, MBA

Thus far in 2023, there have been three major bank failures. And I do mean MAJOR: all told the three banks had $532 billion in assets. That amount is actually greater in size that the combined assets of the 25 banks that failed in 2008.

What is going on here? 

What is going on is that the Fed created this mess… and bad risk management at the banks has exacerbated it.

Let me explain.

Traditionally, banks make money as follows:

1) You deposit your money at the bank.

2) The bank pays you a low interest rate on this deposit.

3) The bank turns around and loans out $5, $7, even $10 in loans for every $1 you deposited. The bank charges a much higher rate of interest on these loans than the interest rate it pays you on your deposit.

4) Alternatively, the bank buys $5, $7, or even $10 in long-duration assets (Treasuries, or other long-term bonds) for every $1 you deposited.

5) The bank pockets the spread between the interest it earns on its loans/ bonds and the interest rate is pays you on your deposits.

This situation works well provided the Fed keeps interest rates low. Unfortunately for the banks, the Fed unleashed inflation by printing ~$5 TRILLION between 2020 and 2022. 

Bond yields trade based on many things… including inflation. And once inflation entered the financial system, Treasury yields ripped higher.

When Treasury yields rise, bond prices FALL. And who was sitting on trillions of dollars’ worth of long-term Treasuries and loans that traded based on long-term Treasuries?

You guessed it… the regional banks.

Courtesy of the Fed’s idiocy, the banks were destined to be sitting on hundreds of billions of dollars worth of losses on these assets. 

But it gets worse.

Once the Fed finally decided to get off its rear and do something about inflation, it embarked on its most aggressive rate hike cycle in history, raising rates from 0.25% to 5% in the span of a single year.

Why does this matter?

Remember how banks pay you a low interest rate on your deposit? Well who is going to want to keep his or her money in a bank that pays 0.3% at best… when he or she can earn 4% or even 5% in a money market fund or short-term Treasury bond, courtesy of the Fed raising rates so high so fast ?

And so, depositors began pulling their money from banks… and not by a little: 2022 was the first year since 1945 in which money on a NET BASIS left the banking system in the U.S.

But hang on… remember how the bank loaned out or bought $5, $7, or even $10 worth of loans or long-term assets based on every $1 you deposited in the bank? Well when you pull your money out of the bank, the bank has to unload all that stuff to maintain its capital requirements.

And so, the Fed delivered the ultimate 1-2 punch to the U.S. regional banking system.

The first punch was it ignored inflation to the point that the banks were sitting on hundreds of billions of dollars’ worth of losses.

However, the KO punch was the Fed raised rates aggressively, which resulted in depositors pulling money out of the banks in search of higher returns on their cash.

Now, don’t get me wrong. The banks are partially to blame for the fact that didn’t act once the Fed announced it would be raising rates to end inflation. With proper risk management (bond hedges for instance) these banks would have been better prepared for the bond market massacre of 2022.

However, even careful risk management would have done nothing to help these banks once depositors started pulling their money out. And no bank could raise its deposit rates to 4% or 5% to compete with money market funds or short-term Treasuries while staying in business.

And so we get this: a situation in which MAJOR regional banks are going bust and the regional bank ETF has lost a third of its value in the span of six weeks.

This situation is nowhere near over. According to some analysis, HALF of the U.S.’s banks are currently insolvent.

The clock is ticking here. Ignore trader games, something BAD is coming to the markets.

If you’ve yet to take steps to prepare for what’s coming, we have published an exclusive special report How to Invest During This Bear Market.

It details the #1 investment to own during the bear market as well as how to invest to potentially generate life changing wealth.

This report is usually $250, but we’re giving away 100 copies for FREE to those who sign up for our free daily market commentary.

As I write this, there are less than 19 left.

To pick up one of the remaining copies, use the link below…

https://phoenixcapitalmarketing.com/BM2.html

This image has an empty alt attribute; its file name is signature.jpg

Posted by Phoenix Capital Research in stock collapse?

Warning: the Financial System is About to Lose Its Last Major Prop

By Graham Summers, MBA

Japan just reported inflation of 3.5%.

This is a big deal. 

Why?

First and foremost, it’s significantly higher than expectations: 3.5% vs 3.2%.

Secondly, it shows that inflation is turning back upwards in Japan. Last month’s inflation data was 3.2% which was down from the prior month’s 3.3% which was down from the prior month’s 4.3%. 

Put simply, after trending down for three months, inflation is turning back upwards in Japan.

And finally… Japan remains the last central bank that is still easing monetary conditions.

The Fed is aggressively tightening monetary conditions. So is the European Central Bank as well as the Bank of England. Only the Bank of Japan remains engaged in Quantitative Easing.

With inflation coming in hot in Japan, the Bank of Japan will soon be forced to end its money printing. Which means the financial system would lose its last and final source of excess liquidity.

Put another way, the great monetary easing from 2020-2023 would completely over. Every major central bank would be tightening. Liquidity would be exiting the system at an even more rapid clip.

What do you think this would do to stocks?

My proprietary crash trigger knows. It just triggered its 3rd confirmed “SELL” signal in 25 years.

The last two time sit signaled?

2000 and 2008.

If you’ve yet to take steps to prepare for what’s coming, we have published an exclusive special report How to Invest During This Bear Market.

It details the #1 investment to own during the bear market as well as how to invest to potentially generate life changing wealth.

This report is usually $250, but we’re giving away 100 copies for FREE to those who sign up for our free daily market commentary.

As I write this, there are less than 30 left.

To pick up one of the remaining copies, use the link below…

https://phoenixcapitalmarketing.com/BM2.html

This image has an empty alt attribute; its file name is signature.jpg

Posted by Phoenix Capital Research in stock collapse?

Warren Buffett Would Like a Word With You

By Graham Summers, MBA

Warren Buffett is arguably the greatest investor of all time.

Unlike many of the super wealthy that existed before him (Rockefeller, Morgan, Vanderbilt, Dupont) Buffett wasn’t an entrepreneur who built an oil, steel, banking, or railroad empire. Instead, Buffett was an investor, who allocated capital in such a way that his holding company Berkshire Hathaway, grew to be one of the 10 largest companies on the S&P 500.

Buffett himself grew to be worth over $100 billion in the process.

Put simply, this is a man who got unbelievably rich from the markets. So when Warren Buffet speaks on the subject of stocks, it’s a good idea to listen.

One of Buffett’s best known quotes concerning the markets is that “trannies don’t lie,” meaning that the Dow Jones Transportation Index, which is comprised of companies associated with transportation in the real economy is one of the most accurate economic bellwethers out there.

Put simply, whatever the Dow Jones Transportation Index does, is a solid indicator of what’s happening in the economy.

I mention this because the Transportation index has just broken down from a clear Head and Shoulders topping pattern. This suggests the economy is rolling over in a significant manner.

Now take a look at the Transportation index (red line) overlaid with the broader market as represented by the S&P 500 (black line) in the chart below. The implication concerning the economy is clear. But the S&P 500 has yet to “get it.”

Indeed, in the Big Picture, my proprietary Crash Trigger is now on the first confirmed “Sell” signal since 2008.

This signal has only registered THREE times in the last 25 years: in 2000, 2008 and today.

If you’ve yet to take steps to prepare for what’s coming, we have published an exclusive special report How to Invest During This Bear Market.

It details the #1 investment to own during the bear market as well as how to invest to potentially generate life changing wealth.

This report is usually $250, but we’re giving away 100 copies for FREE to those who sign up for our free daily market commentary.

As I write this, there are less than 40 left.

To pick up one of the remaining copies, use the link below…

https://phoenixcapitalmarketing.com/BM2.html

This image has an empty alt attribute; its file name is signature.jpg

Posted by Phoenix Capital Research in stock collapse?

Three Charts You Need to See Before the Weekend Hits

By Graham Summers, MBA

It’s earnings season and options expiration week for the month of April. 

Both of those items have historically been extremely bullish: stocks almost always rally into earnings and options expiration week is the week of for Wall Street to gun the markets higher.

And yet… the stock market is doing this.

When a pattern that has a lot of historical precedent stops working… it can indicate a serious shift is taking place under the surface of the markets.

I would also note that the Fed’s balance sheet has rolled over, indicating that the Fed is withdrawing liquidity from the system again.

While Bitcoin and other liquidity plays are beginning to roll over as well.

All of this suggests the next leg down for the markets is just around the corner.

If you’ve yet to take steps to prepare for what’s coming, we just published a new exclusive special report How to Invest During This Bear Market.

It details the #1 investment to own during the bear market as well as how to invest to potentially generate life changing wealth when it ends.

We made just 100 copies available to the general public.

As I write this, there are less than 50 left.

To pick up your FREE copy, swing by:

https://phoenixcapitalmarketing.com/BM2.html

This image has an empty alt attribute; its file name is signature.jpg

PS. Our new investing podcast Bulls, Bears & BS is officially live and available on every major podcast application (Apple, Spotify, etc.)

To download or listen, swing by:

https://bullsbearsandbs.buzzsprout.com/

Posted by Phoenix Capital Research in stock collapse?, The Everything Bubble

Why Stocks Are On Borrowed Time

By Graham Summers, MBA

The Fed has turned off the money pump again.

If you’re looking for a reason why stocks erupted higher starting in early March, look no further than the below chart of the Fed’s balance sheet. As you can see, during the regional banking crisis triggered by the collapse of Silicon Valley Bank, the Fed began expanding its balance sheet rapidly.

How rapidly?

Nearly $400 BILLION in two weeks’ time. Not since the depths of the 2020 crash has the Fed printed this much money.

Stocks bottomed soon after this… exploding higher by 6+% in a single month. 

I bring all of this up, because the Fed has turned off the money printer again. Over the last week, the Fed’s balance sheet has fallen by $100 billion.

What does this mean?

The clock is ticking for stocks. And with a recession just around the corner… it’s only a matter of time before the market breaks to new lows.

Indeed, our proprietary Crash signal has just triggered its 3rd confirmed signal in the last 25 years. The last two times it signaled?

2000 and 2008. 

If you’ve yet to take steps to prepare for what’s coming, we just published a new exclusive special report How to Invest During This Bear Market.

It details the #1 investment to own during the bear market as well as how to invest to potentially generate life changing wealth when it ends.

To pick up your FREE copy, swing by:

https://phoenixcapitalmarketing.com/BM2.html

This image has an empty alt attribute; its file name is signature.jpg

PS. Our new investing podcast Bulls, Bears & BS is officially live and available on every major podcast application (Apple, Spotify, etc.)

To download or listen, swing by:

https://bullsbearsandbs.buzzsprout.com/

Posted by Phoenix Capital Research in stock collapse?

What Do These People Know That We Don’t?

By Graham Summers, MBA

A few things for us to think about…

Wal-Mart (WMT) is the largest private employer in the world. It’s also one of the largest retailers in the world. As such, it is a major economic bellwether.

The Waltons are the family that founded Wal-Mart (WMT). They remain the largest owners of its stock. And they have been dumping BILLIONS of dollars in WMT stock in the last few months.

What do they know that we don’t?

Apple (AAPL) is the largest company on the S&P 500. It is also the largest consumer discretionary company in the world. AAPL insiders including the CEO, COO and General Counsel have sold $41 million worth of stock recently.

The last time the CEO sold was in 2018. AAPL shares fell 41% that year. He’s selling again now.

What does he know that we don’t?

And finally… my proprietary Crash Trigger is now on the first confirmed “Sell” signal in over a decade.

The last time this signal hit?

2008.

What does it know that we don’t?

If you’ve yet to take steps to prepare for what’s coming, we just published a new exclusive special report How to Invest During This Bear Market.

It details the #1 investment to own during the bear market as well as how to invest to potentially generate life changing wealth when it ends.

To pick up your FREE copy, swing by:

https://phoenixcapitalmarketing.com/BM2.html

This image has an empty alt attribute; its file name is signature.jpg
Posted by Phoenix Capital Research in stock collapse?

The Bond Market Fears Something Worse Than Inflation is Coming

By Graham Summers, MBA

The bond market is signaling some thing “BAD” is coming.

Bond yields rose throughout late 2021-early 2023 on fears of inflation. But once Silicon Valley Bank imploded, yields dropped rapidly: historically investors pile into Treasuries as a “safety trade” whenever things get hairy in the financial system. The regional banking crisis in mid-March was no exception with yields collapsing at their fastest rate since the 1987 crash.

When this happened, I began to wonder… would yields begin to rise again as things normalized following the regional banking bailouts… or would the economy roll over and yields finally start to plunge as a recession took hold?

We now have our answer…

The yield on the 2-Year U.S. Treasury is NOT rising anymore. If anything it’s rolling over and approaching the “Silicon Valley Bank” lows.

This is a signal that something “BAD” is brewing in the economy/ financial system. If everything was fine, yields would be rising again based on hopes of growth and fears of inflation.

Put simply, the fact yields are falling like this tells us that the bond market fears something far worse than inflation is coming…

Indeed, the 2s10s are now beginning to invert. Historically, this has been the signal that a recession is about to hit.

What happens to stocks when a recession hits while inflation is still at 6%?

The 70s showed us…

If you’ve yet to take steps to prepare for what’s coming, we just published a new exclusive special report How to Invest During This Bear Market.

It details the #1 investment to own during the bear market as well as how to invest to potentially generate life changing wealth when it ends.

To pick up your FREE copy, swing by:

https://phoenixcapitalmarketing.com/BM2.html

This image has an empty alt attribute; its file name is signature.jpg

Posted by Phoenix Capital Research in Inflation, stock collapse?

OK, This is Getting Downright Spooky

By Graham Summers, MBA

Investors are running a repeat of the same trading pattern we saw in 2008.

That pattern?

A mini-crisis in March, followed by a summer rally, and then the real fireworks begin.

In 2008, Bear Stearns had to be absorbed in a shotgun wedding to JP Morgan on March 16th. That marked a temporary low, as investors believed the Fed easing/ backstopping the issue resolved things despite the clear evidence that the economy was rolling over.

The stock market then rallied for two months before the crisis began in earnest.

Today in 2023, the same pattern is playing out. 

Once again, there was a mini-crisis in March with Silicon Valley Bank/ Signature Bank playing the part of Bear Stearns. The Fed / Treasury stepped in, backstopping the troubled banks and facilitating a deal to have them absorbed by other players.

Investors are taking this to signal the “all clear” and are piling back into stocks, kicking off a rally… once again despite the clear evidence the economy is rolling over.

As if this wasn’t spooky enough, consider that in the BIG PICTURE my proprietary Crash Trigger is now on the first confirmed “Sell” signal in over a decade.

The last time this signal hit?

2008. 

See for yourself…

If you’ve yet to take steps to prepare for what’s coming, we just published a new exclusive special report How to Invest During This Bear Market.

It details the #1 investment to own during the bear market as well as how to invest to potentially generate life changing wealth when it ends.

To pick up your FREE copy, swing by:

https://phoenixcapitalmarketing.com/BM2.html

This image has an empty alt attribute; its file name is signature.jpg

PS. Our new investing podcast Bulls, Bears & BS is officially live and available on every major podcast application (Apple, Spotify, etc.)

To download or listen, swing by:

https://bullsbearsandbs.buzzsprout.com/


Posted by Phoenix Capital Research in stock collapse?

Three Charts Every Investor Needs to See Today

By Graham Summers, MBA

A few charts to consider…

Bitcoin… the ultimate liquidity play, has a rounded top. It is just clinging to support. Below that is nothing but air pockets down to 24,000 it not 19,000.

Short term Treasury bonds and high beta growth company Nvidia (NVDA). This entire move higher in high growth tech has been driven by rates. That is now ending…

Historically a recession hits when a yield curve inversion goes back to positive. We’re well on our way to that as I write this.

Seeing multiple set ups suggesting the same thing (a risk off move is coming) adds to the probability. And from a BIG PICTURE perspective my proprietary Crash Trigger is now on the first confirmed “Sell” signal since 2008.

This signal has only registered THREE times in the last 25 years: in 2000, 2008 and today.

If you’ve yet to take steps to prepare for what’s coming, we just published a new exclusive special report How to Invest During This Bear Market.

It details the #1 investment to own during the bear market as well as how to invest to potentially generate life changing wealth when it ends.

To pick up your FREE copy, swing by:

https://phoenixcapitalmarketing.com/BM2.html

This image has an empty alt attribute; its file name is signature.jpg

PS. Our new investing podcast Bulls, Bears & BS is officially live and available on every major podcast application (Apple, Spotify, etc.)

To download or listen, swing by:

https://bullsbearsandbs.buzzsprout.com/


Posted by Phoenix Capital Research in stock collapse?

Are We About to See a Full-Scale Banking Crisis?

By Graham Summers, MBA

Something doesn’t add up.

The Fed and Treasury keep telling us everything is fine… but the Fed has just expanded its balance sheet by $400+ billion in the span of two weeks.

We haven’t seen money printing like this since the depth of the 2020 meltdown. The Fed has erased 2/3rds of its 9 month long Quantitative Tightening in 14 days!

Despite these emergency loans/ access to credit, the regional banking ETF is right back near its panic lows. 

Even stranger, several of the big banks are collapsing in share price as well. Wells Fargo, Bank of America, and Citigroup are all back at their October lows. 

Looking at this, it appears something MAJOR is brewing behind the scenes. Banks might less than 14% of the S&P 500 weighting, but they account for something like 70% of all mortgages and 60% of all consumer loans.

Put simply, if this sector is in major trouble, it’s going to have a MAJOR effect on the economy. 

Indeed, from a BIG PICTURE perspective my proprietary Crash Trigger is now on the first confirmed “Sell” signal since 2008.

This signal has only registered THREE times in the last 25 years: in 2000, 2008 and today.

If you’ve yet to take steps to prepare for what’s coming, we just published a new exclusive special report How to Invest During This Bear Market.

It details the #1 investment to own during the bear market as well as how to invest to potentially generate life changing wealth when it ends.

To pick up your FREE copy, swing by:

https://phoenixcapitalmarketing.com/BM2.html

This image has an empty alt attribute; its file name is signature.jpg

PS. Our new investing podcast Bulls, Bears & BS is officially live and available on every major podcast application (Apple, Spotify, etc.)

To download or listen, swing by:

https://bullsbearsandbs.buzzsprout.com/

Posted by Phoenix Capital Research in Central Bank Insanity, stock collapse?