Editors note: Chief Market Strategist Graham Summers, MBA will be on the Schilling Show radio program today at 1:30 EST. You can listen in here.
Everywhere I look, I see investors proclaiming that “THE” top is in and a bear market is about to unfold.
First and foremost, there is NO reason to ever try to call a top.
Why?
Because doing so doesn’t make you any money. In fact, top callers usually miss out on major market gains by selling way too early.
Consider what happened during the last market correction in April 2024. Then, just as now, the top callers came out of the woodwork. The market corrected for two weeks before rallying another 15%. Anyone who sold, missed out on these gains.
Moreover, there are nearly ZERO signs from real market indicators that THE top is in right now.
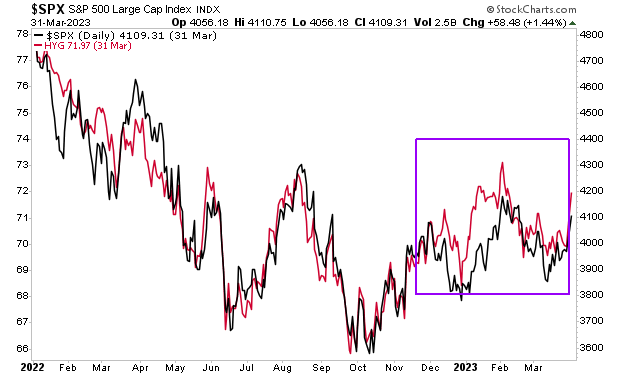
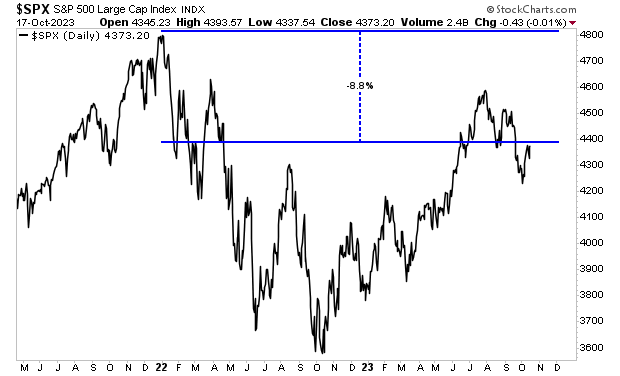
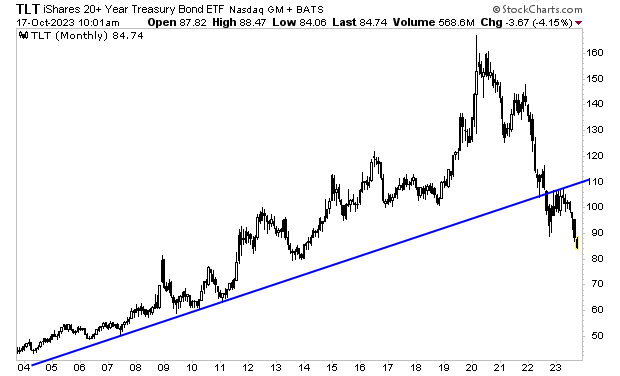
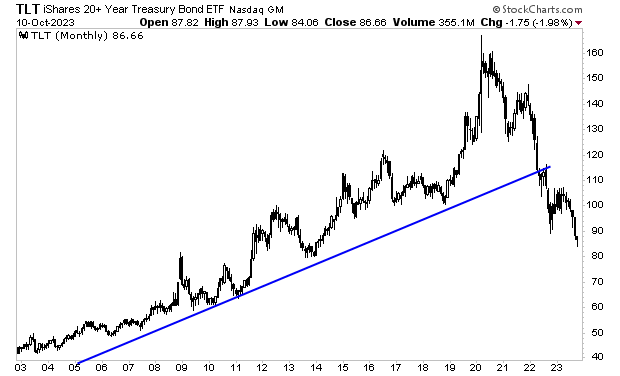
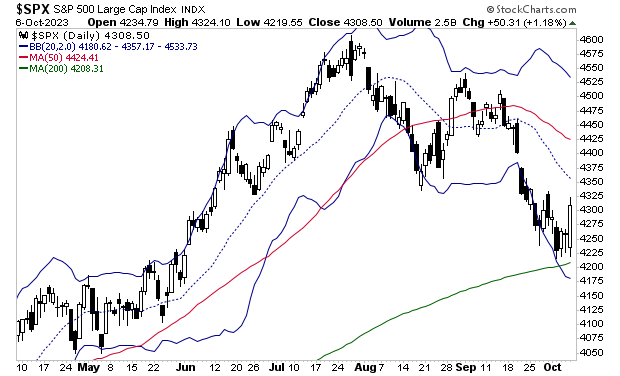
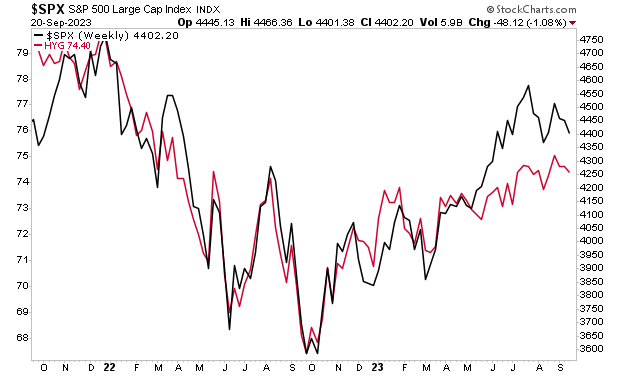
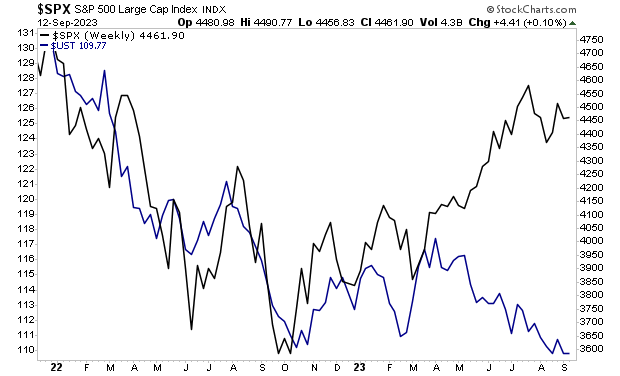
Consider the last major bear market that unfolded from early 2022 until October 2023. At that time, high yield credit broke down along with stocks, signaling that a major shift had taken place in the financial system.
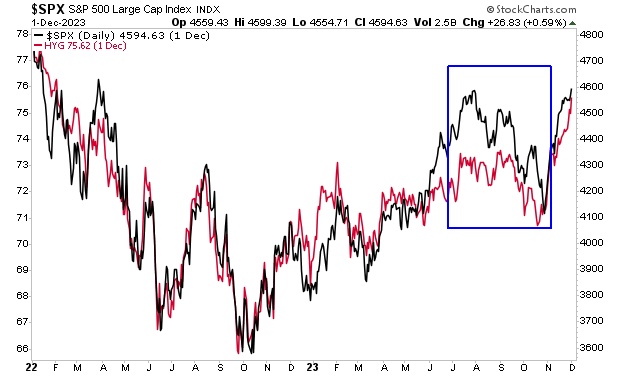
Today, high yield credit is near all-time highs. If anything, it is signaling that stocks have sold off TOO MUCH!
The same is true for market breadth. Going into the bear market of 2022, breadth peaked before stocks.
Today, breadth is near all-time highs. It too is signaling that the selling is overdone for stocks.
Finally, and likely most importantly, the U.S. is four months away from the next Presidential election. And the next President of the United States, Donald Trump, is obsessed with the stock market.
Do you REALLY want to be shorting stocks when the single biggest cheerleader in the history of the stock market is going to take office?
With that in mind, we are about to publish a Special Investment Report detailing the #1 investment to own when during a Trump 2nd Term.
Normally, this report would sell as a stand-alone item for $499, but we are giving away a limited number of copies for free to investors who join our daily e-letter: Gains Pains & Capital.
To join today… and reserve your copy of The #1 Investment to Own During Trump’s 2nd Term…
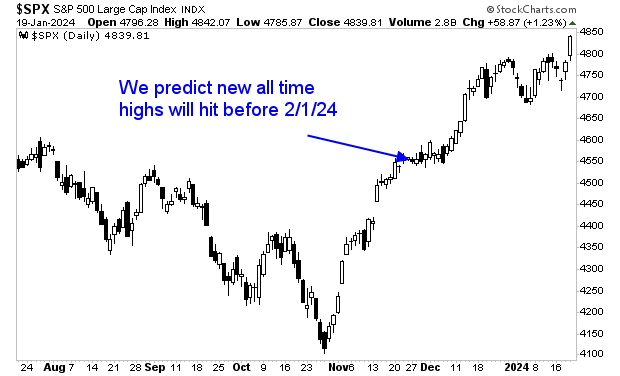
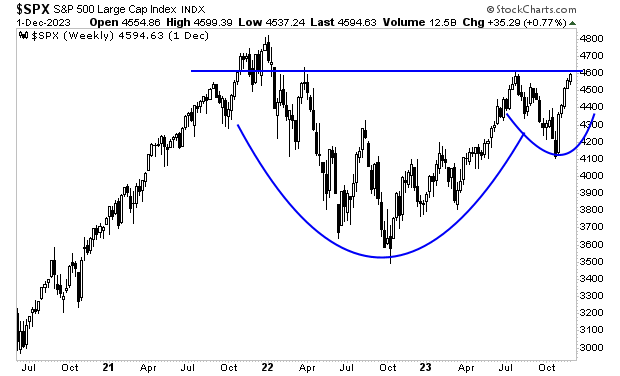
This correction is close to over. And when it ends, stocks will rally hard to new all-time highs.
How do I know this?
Because the market internals are telling me.
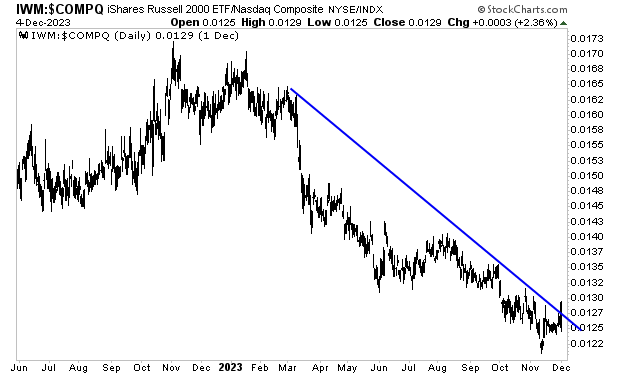
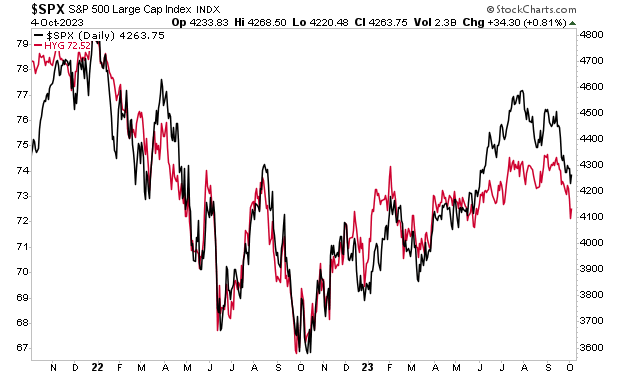
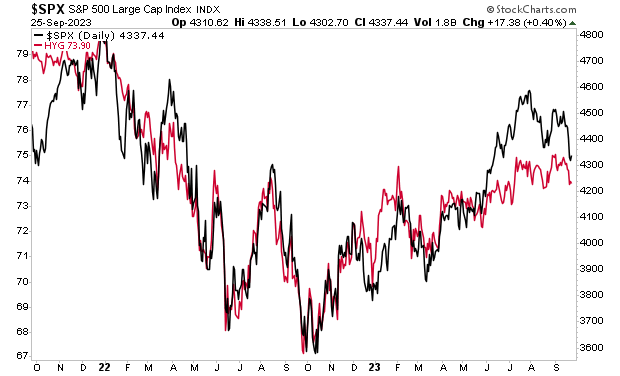
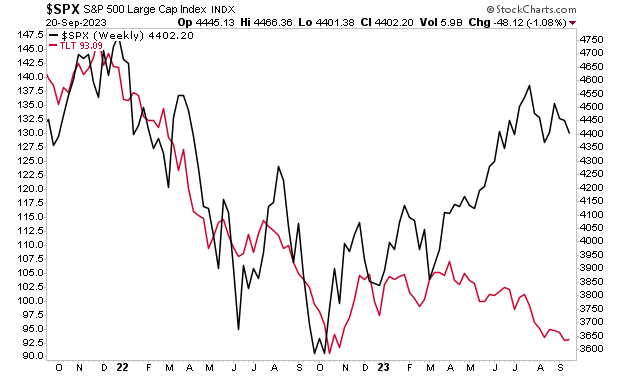
Historically, high yield credit leads the stock market. The reason for this is because high yield credit (read: junk bonds) is MUCH more sensitive to macro changes due to the fact that when the economy rolls over, junk bond investors typically lose a LOT of money very quickly.
Because of this, high yield credit acts as a kind of “canary in the coal mine” for the financial system. If something BAD is coming, this is the first area to react.
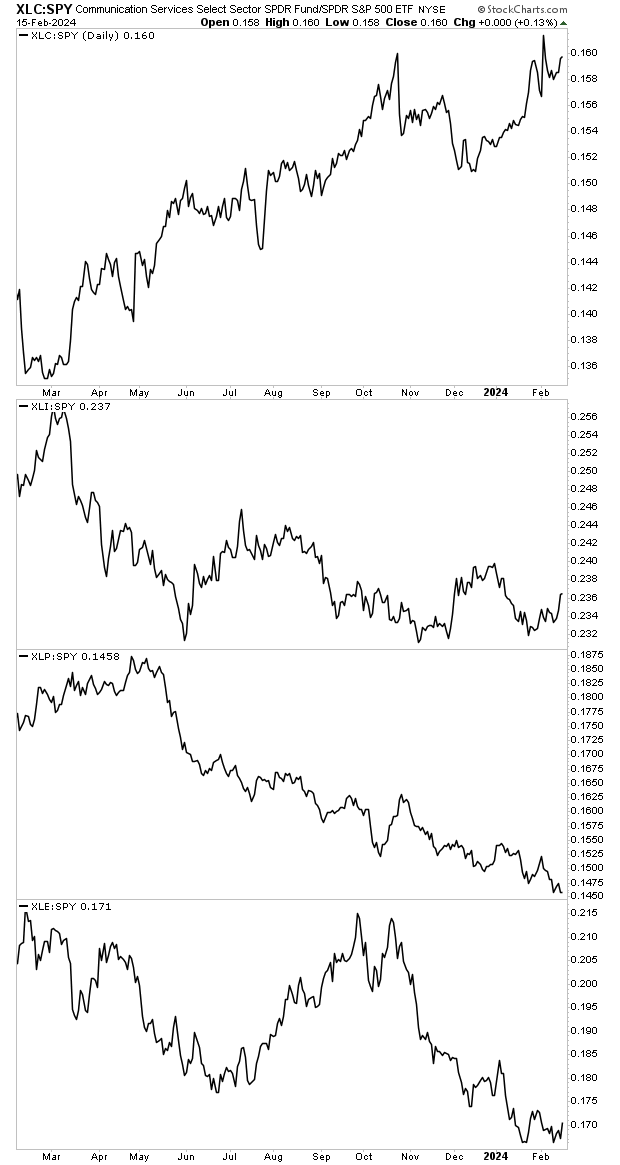
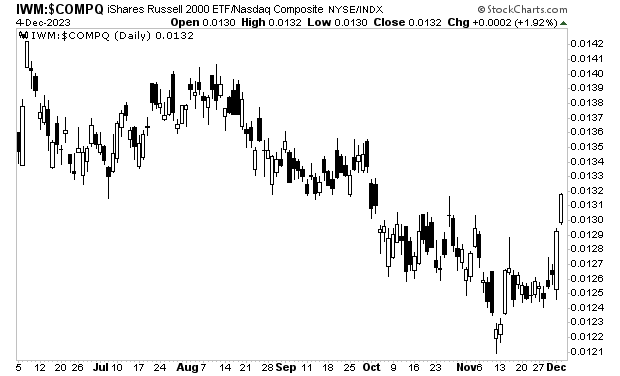
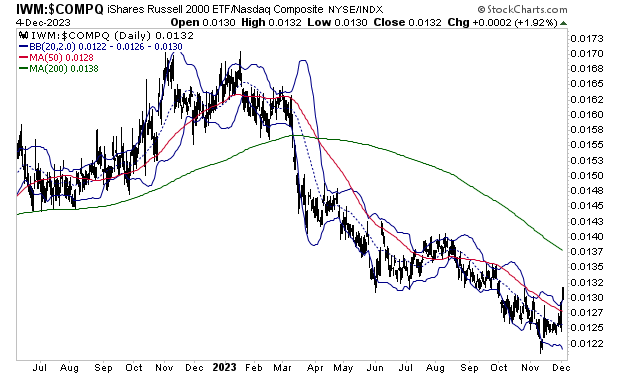
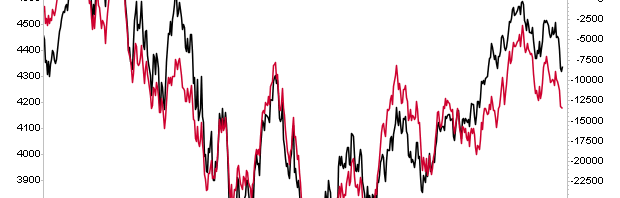
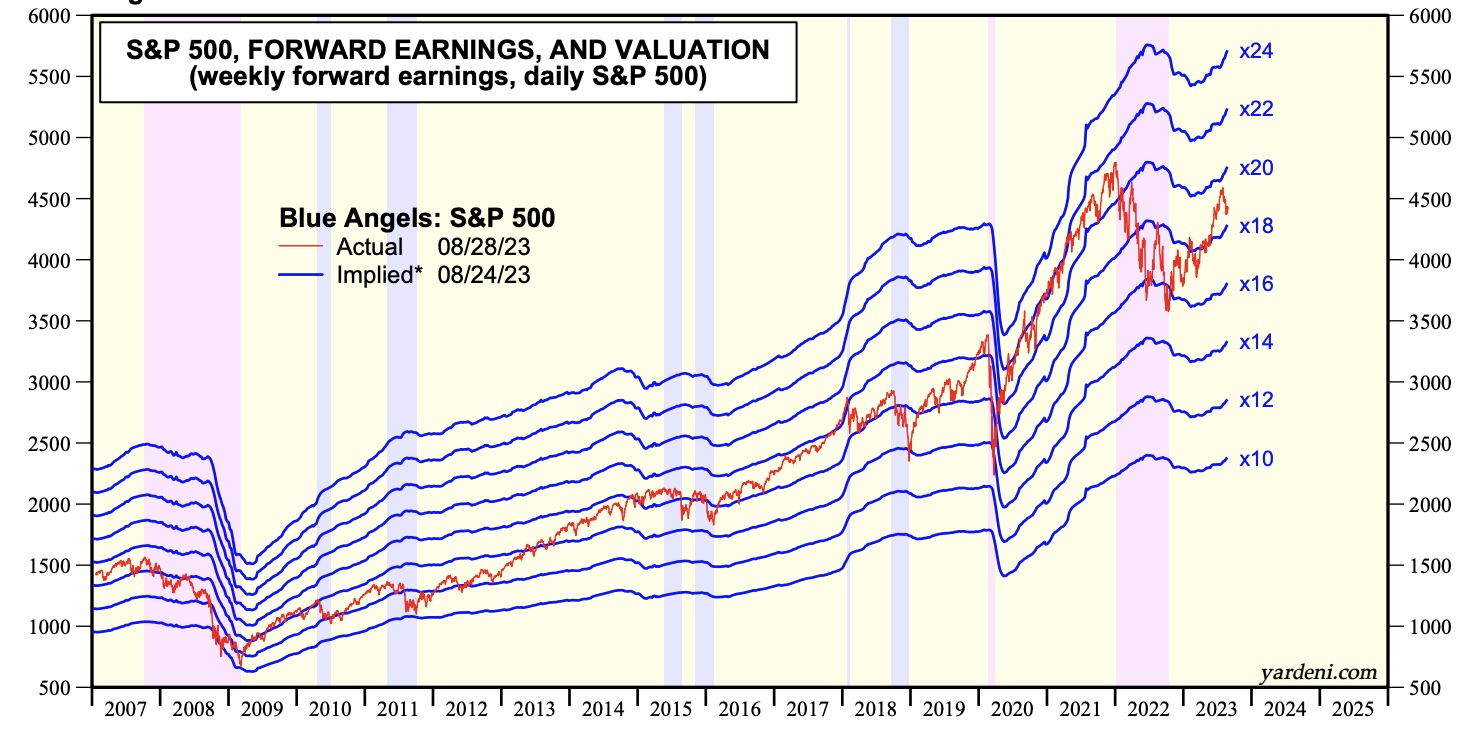
High yield credit (red line in the chart below) just hit new all-time highs. Indeed, based on high yield credit, the S&P 500 should be north of 5,600 right now. This is NOT bearish for risk assets including stocks.
High yield credit isn’t the only market internal that suggests stocks are ready to rip higher.
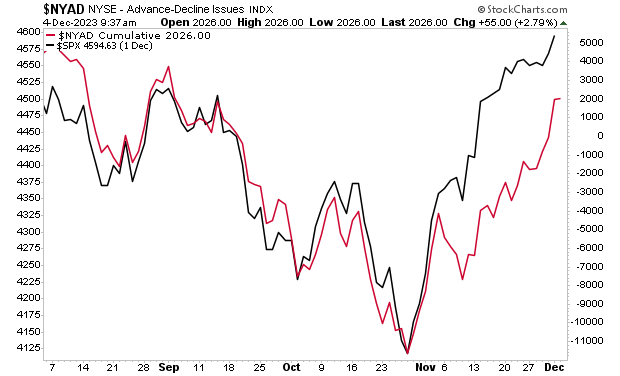
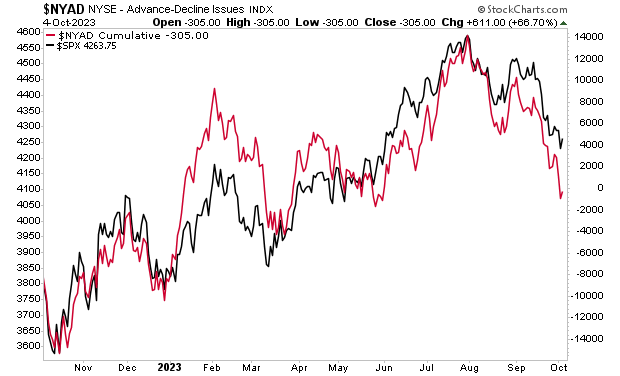
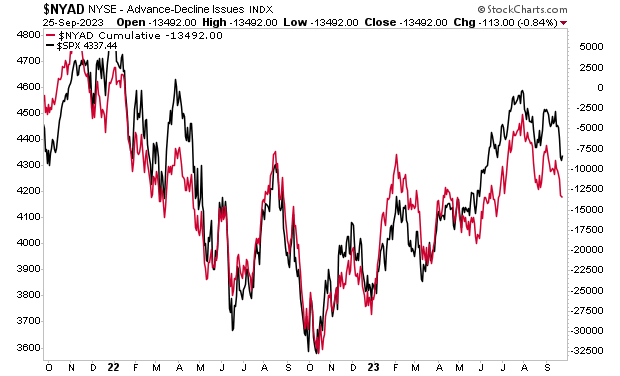
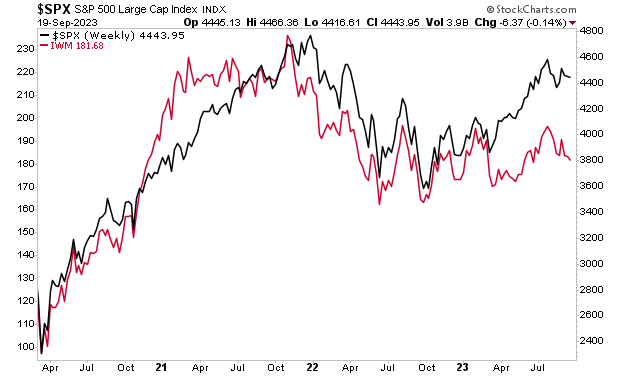
Overall breadth has bounced hard after hitting new all-time highs. The below chart is telling us that the S&P 500 is being dragged down by big tech, but overall market breadth is getting STRONGER not weaker.
Again, this is NOT bearish. Indeed, if we go by breadth (red line in the chart below), the S&P 500 should be 100 points higher right now.
I suspect part of the reason why market internals are acting so strongly is because the market is discounting that the next President of the United States will be Donald Trump, who is obsessed with the stock market.
If you’ll recall, the former President promoted the stock market almost non-stop during his first term. Indeed, he tweeted about it an average of two times per week, mentioned it in the media dozens of times, and even pumped it higher by leaking economic developments any time it looked as if the markets would break down.
Put simply, Trump is a stock market cheerleader, and I believe the stock market is discounting a second Trump term. This will benefit certain sectors and stocks more than others. And those investors who are properly positioned stand to make potential fortunes.
With that in mind, we are about to publish a Special Investment Report detailing the #1 investment to own when during a Trump 2nd Term.
Normally, this report would sell as a stand-alone item for $499, but we are giving away a limited number of copies for free to investors who join our daily e-letter: Gains Pains & Capital.
To join today… and reserve your copy of The #1 Investment to Own During Trump’s 2nd Term…
Get ready for a “Rip Your Face Off” rally in the stock market.
Why?
Three reasons…
1) The bull market is getting stronger, not weaker.
Regarding #3, for most of the last three months, the overall market’s gains have been driven by a handful of Big Tech plays.
No longer…
Overall market breadth has surged in the last two weeks, hitting new all-time highs before this recent pullback. This bull market is getting stronger, not weaker.
Reason #2 why stocks are about to explode higher.
The Fed is about to start cutting rates… at a time when the economy is still growing. The futures market is predicting between 1.75% and 2% in rate cuts by September of next year. That means seven or even EIGHT rate cuts in a 13 month period!
That is NOT bearish.
And finally, and likely most importantly, reason #3 why stocks are about to rally hard.
The next President of the United States, Donald Trump, is obsessed with the stock market. He tweeted about it an average of two times per week during his first term. And Team Trump has already leaked proposals to take over the Fed if the Fed doesn’t play ball.
Remember, the stock market is forward looking, which means that starting today, the market is going to begin discounting a Trump win.
This will benefit certain sectors and stocks more than others. And those investors who are properly positioned stand to make potential fortunes.
With that in mind, we are about to publish a Special Investment Report detailing the #1 investment to own when during a Trump 2nd Term.
Normally, this report would sell as a stand-alone item for $499, but we are giving away a limited number of copies for free to investors who join our daily e-letter: Gains Pains & Capital.
To join today… and reserve your copy of The #1 Investment to Own During Trump’s 2nd Term…
I ask because everywhere I look, I see analysts and gurus proclaiming that yesterday’s “bearish” action was the start of a major collapse.
There’s just one problem with this… MOST of the market rallied yesterday.
I’m not making this up… over 400 of the 500 companies in the S&P 500 finished the day UP yesterday. The reason the market fell at all is because big tech, which comprises 30% of the market’s weight, dropped hard.
In fact, the overall market breadth (a measure of internal market strength) actually erupted to new all time highs yesterday.
Does this look like the start of a major collapse to you?
This is why you have to be so careful when someone starts spouting off bearish arguments based on stocks dropping. It’s so easy to panic and sell… when the dip might in fact be a MAJOR buying opportunity.
Case in point, a LOT of people sold in April when the market corrected just ~5% (a totally healthy correction in the context of a bull market). The S&P 500 has since rallied over 600 points. Anyone who sold in April MISSED OUT on making some serious money!
Remember, as investors, our job is to make money, not look for any excuse to dump stocks and panic about something bad happening. And as I’ve outlined in recent articles, this means riding bull markets for as long as possible, and then side-stepping bear markets when they eventually hit.
In the very simplest of terms, you need to be invested in stocks, until an objective, verifiable tool (not your feelings or limiting beliefs) tells you it’s time to “get out.”
I’ve developed a tool that takes ALL of the guessing work out of this problem. With just one look at this tool, you can tell whether it’s a good time to buy stocks or not. I detail it, along with what it’s currently saying about the market today in a Special Investment Report How to Predict a Crash.
As I outlined yesterday, as an individual investor, there are two things you NEED to focus on:
1) Ride bull markets for as long as possible.
2) Get out of stocks once a bear market hits.
If you do this, you WILL get wealthy from investing over time.
I bring this up, because I’m seeing more and more analysts arguing that the bull market is about to end and that a raging recession will crater stocks.
I don’t see what they are seeing. If anything, stocks look ready to go to new highs of 5,800 or even higher by year end. Please note, I’m not saying there won’t be dips and corrections along the way… I mean that this is a bull market, and if anything it’s getting stronger.
One of the primary criticisms of this bull market is that it’s being driven by just a handful of stocks: the big tech plays like Amazon, Alphabet, Nvidia, etc. Meanwhile, the other 495 stocks that comprise the S&P 500 are trailing behind.
This actually makes perfect sense. The big tech companies are the most profitable companies in history. Collectively, Amazon, Nvidia, Microsoft, Meta, and Alphabet generated $116 BILLION in cash flow in 1Q24.
That’s roughly $1.28 BILLION in cash flow… per day.
Again, there’s a reason by the big tech companies lead the market: they’re the largest, most profitable companies in history. They should lead the market!
The key item is whether the rest of the market plays “catch up” or if big tech rolls over. And throughout this bull market begun in October 2022, the rest of the market has played “catch up.”
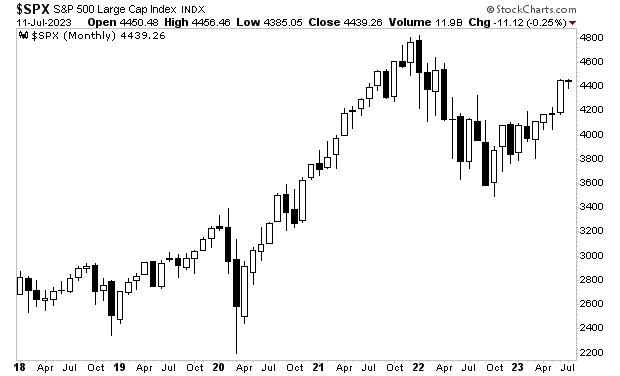
Take a look at the first leg higher from October 2022 to June 2023. At that time, the regular S&P 500 which is heavily weighted towards tech and is represented by the black line in the chart below dramatically outperformed the equal weighted S&P 500: a version of the S&P 500 in which each company receives 1/500th weighting as represented by the blue line in the chart below.
Then, just like now, stock market bears and misguided gurus were out proclaiming that the stock market was about to collapse because it was “held up by only a handful of stocks.”
Then the rest of the market played “catch up” and the market roared to over 5,000 within eight months.
So again, the fact that big tech is leading the market… and makes up the bulk of its gains isn’t necessarily a BAD thing. If the rest of the market plays catch up… as it tends to do… the bull market will continue MUCH LONGER than most analysts expect.
Remember, as investors, our job is to make money, not look for any excuse to dump stocks and panic about something bad happening. And as I’ve outlined in recent articles, this means riding bull markets for as long as possible, and then side-stepping bear markets when they eventually hit.
In the very simplest of terms, you need to be invested in stocks, until an objective, verifiable tool (not your feelings or limiting beliefs) tells you it’s time to “get out.”
I’ve developed a tool that takes ALL of the guessing work out of this problem. With just one look at this tool, you can tell whether it’s a good time to buy stocks or not. I detail it, along with what it’s currently saying about the market today in a Special Investment Report How to Predict a Crash.
As an individual investor, there are two things you NEED to focus on:
1) Ride bull markets for as long as possible.
2) Get out of stocks once a bear market hits.
If you do this, you WILL get wealthy from investing over time.
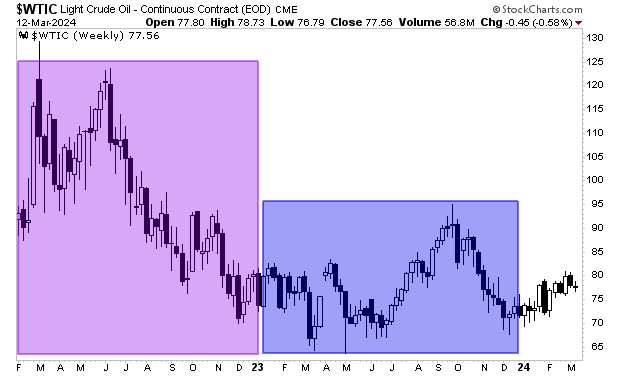
Consider the last 35 years. The investor who simply bought stocks regardless of whether they were in a bull or bear market experienced a 17 year period in which he or she made NO money from their investments.
The reason?
The bear markets from 2000-2003 and 2007-2009. The losses generated by those five years’ worth of bear markets resulted in 17 years of ZERO gains from the markets.
See for yourself… from 1996 through 2013/2014, stocks went nowhere. Anyone who invested during this time grew his or her portfolio via contributions NOT market gains.
Again, as an individual investor you can’t just ride bull markets. You also need to avoid bear markets.
If you did that over the last 35 years, you achieved the gains from the green rectangles, and didn’t give back those gains during the bear markets in between. And you got rich in the process.
Remember, as investors, our job is to make money, not look for any excuse to dump stocks and panic about something bad happening. And as I’ve outlined in recent articles, this means riding bull markets for as long as possible, and then side-stepping bear markets when they eventually hit.
In the very simplest of terms, you need to be invested in stocks, until an objective, verifiable tool (not your feelings or limiting beliefs) tells you it’s time to “get out.”
I’ve developed a tool that takes ALL of the guessing work out of this problem. With just one look at this tool, you can tell whether it’s a good time to buy stocks or not. I detail it, along with what it’s currently saying about the market today in a Special Investment Report How to Predict a Crash.
If you’re looking for a reason why the U.S. hasn’t slipped into recession yet, the answer is simple…
Uncle Sam is propping up the economy. And it’s working… for now
Some items of note:
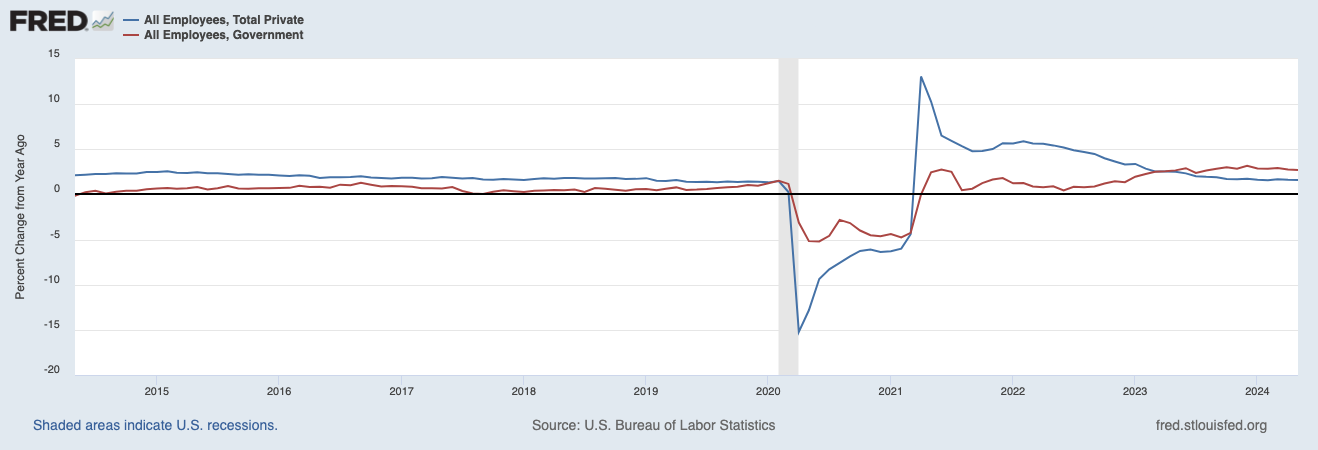
Since, mid-2021, public sector job growth has outpaced private sector job growth.
Government transfers (social spending) accounted for 40% of the growth in income in 1Q24 and was the single largest contributor to personal income growth in 20 states.
In June, the government accounted for 1/3rd of all job gains.
When you add private sector jobs that are funded indirectly by the government, (healthcare, education) Uncle Sam accounted for 74% of ALL jobs created in June!
As I mentioned earlier, the government is propping up the economy via hiring and social spending. This is why the U.S. economy refuses to break down into a recession despite weakness in the private sector.
Small wonder then that stocks keep ripping higher. The S&P 500 has hit new all-time highs in each of the last five weeks!
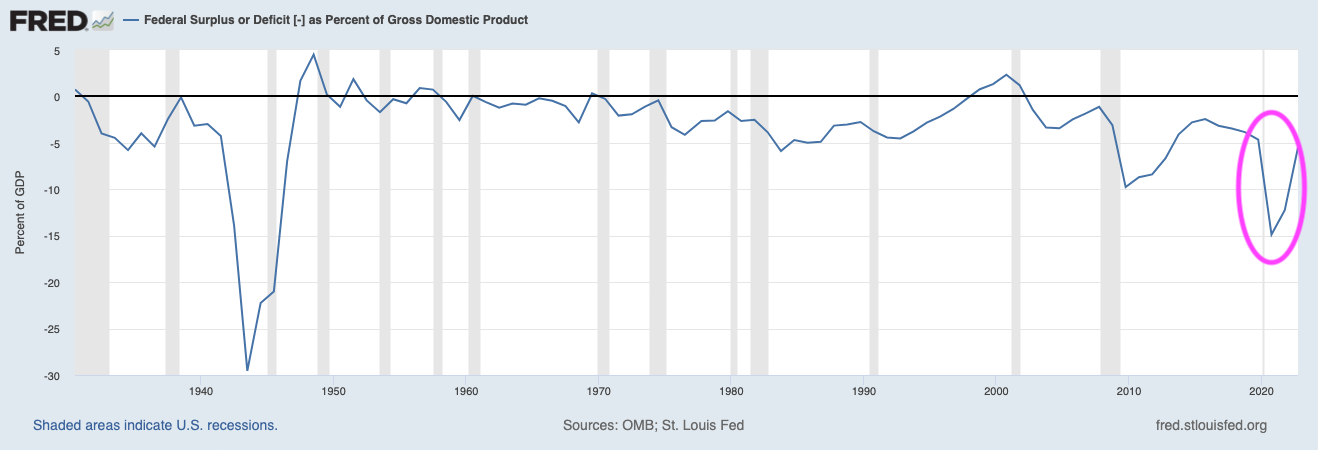
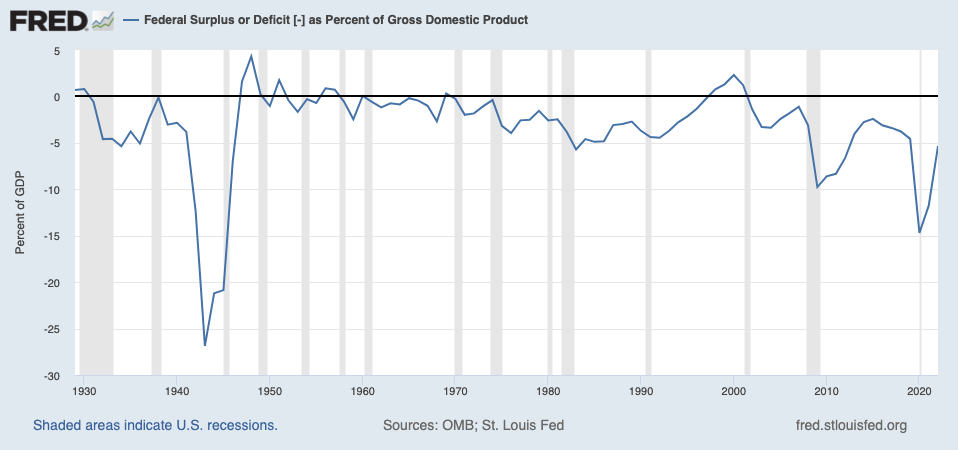
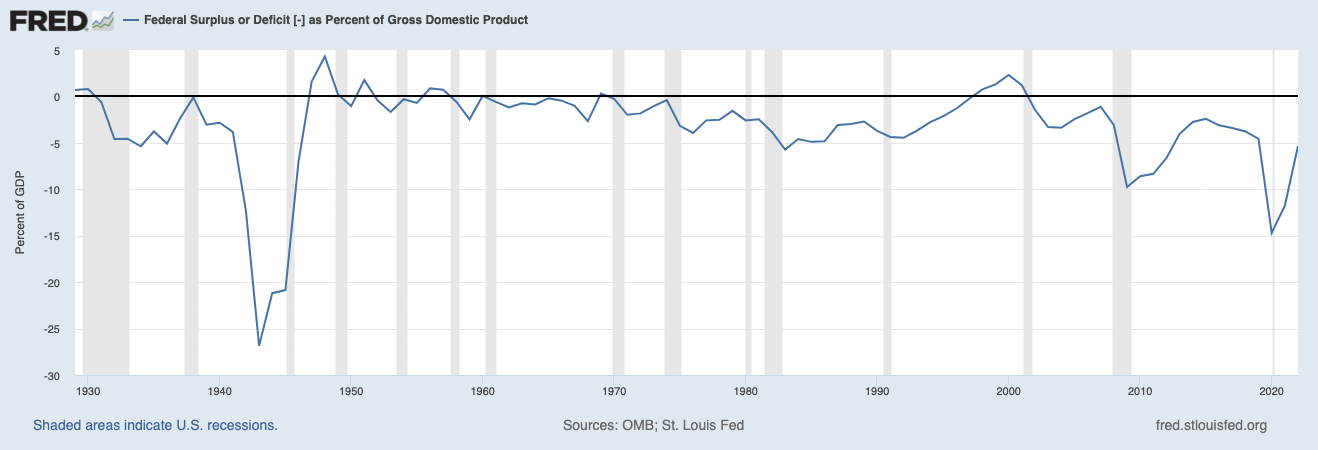
Put simply, this is a raging bull market courtesy of an economy that is being propped up abject government spending that is funded by the largest deficit as a percentage of GDP in the history of the U.S. (outside of WWII).
At some point this situation will end… BADLY. But in the meantime, we need to ignore all the doom and gloom and ride this bull market for as long as possible.
Think about the raging bull market that occurred in the early ’00s. The first signs of the Great Financial Crisis appeared in mid-2006. Those who panicked based on this, had to wait another 20 months as the market rose another ~30% before stocks finally began to break down.
Remember, as investors, our job is to make money, not look for any excuse to dump stocks and panic about something bad happening. And as I’ve outlined in recent articles, this means riding bull markets for as long as possible, and then side-stepping bear markets when they eventually hit.
In the very simplest of terms, you need to be invested in stocks, until an objective, verifiable tool (not your feelings or limiting beliefs) tells you it’s time to “get out.”
I’ve developed a tool that takes ALL of the guessing work out of this problem. With just one look at this tool, you can tell whether it’s a good time to buy stocks or not. I detail it, along with what it’s currently saying about the market today in a Special Investment Report How to Predict a Crash.
Over the last week, I’ve noted that Uncle Sam is the economy now.
What I mean by this, is that the U.S. government is spending so much money, and hiring so many people, that the economy is refusing to fall into recession despite weakness in the private sector.
By quick way of review…
Since, mid-2021, public sector job growth has outpaced private sector job growth.
Government transfers (social spending) accounted for 40% of the growth in income in 1Q24 and was the single largest contributor to personal income growth in 20 states.
Put simply, the “fix” is in as far as the economy is concerned. And it’s Uncle Sam, NOT the Fed, sitting in the economic driver’s seat.
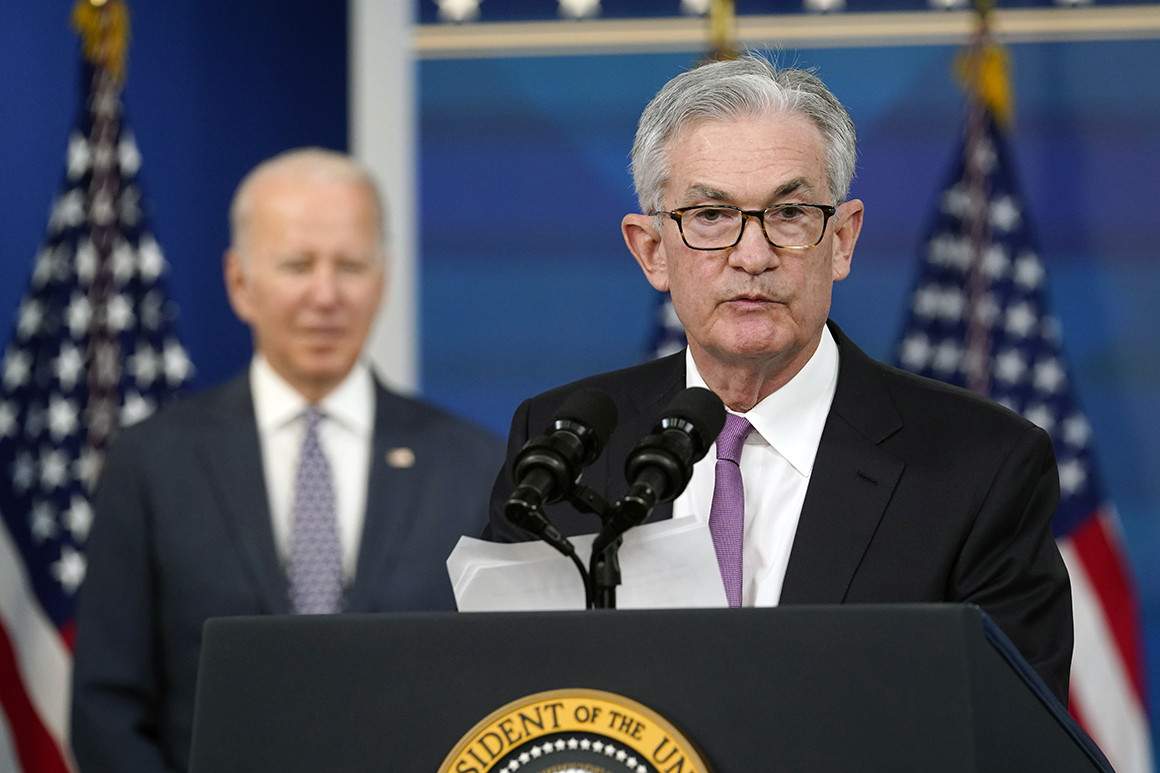
The most powerful financial insider in the world, Fed Chair Jerome Powell, confirmed this in a speech at the ECB Forum on Central Banking yesterday.
Some highlights from Fed Chair Powell’s comments.
The budget deficit is very large, and the deficit path is unsustainable.
Debt sustainability should be a real focus going forward, should be tackled sooner or later.
Fiscal policy is a job for elected officials.
The Fed has been told to stay out of politics and they do.
(h/t Bill King)
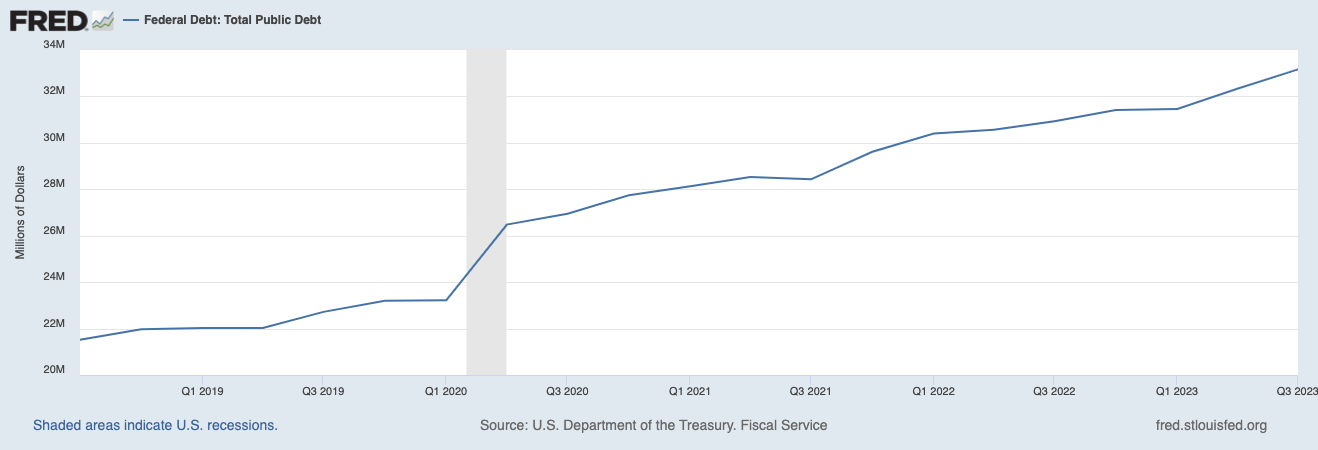
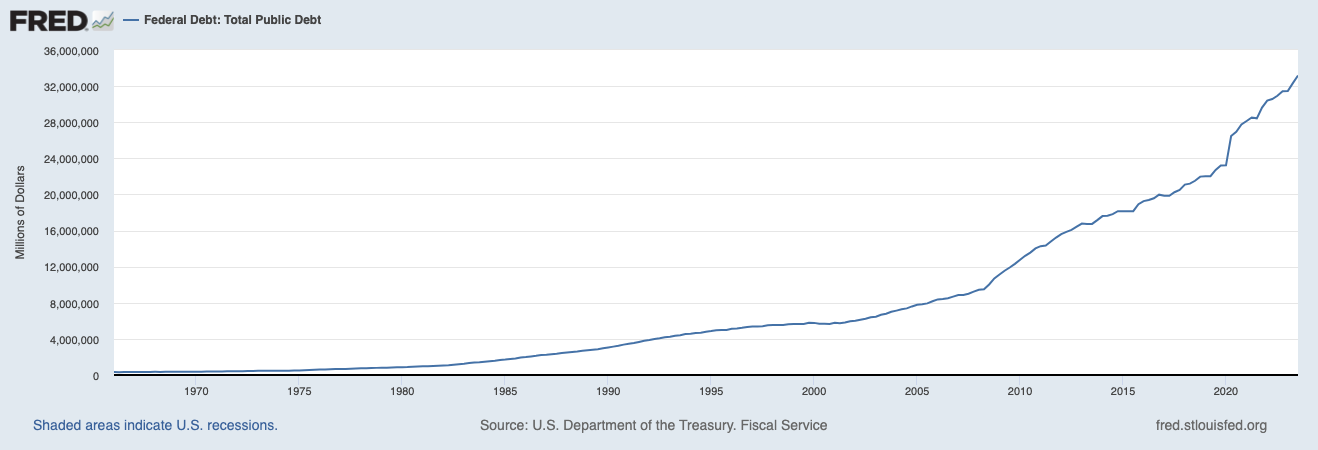
This is a MAJOR tell from the most powerful financial insider in the world: the Federal Government is the one running the “economic” show right now. And it is issuing a truly jaw dropping amount of debt to accomplish this: the Biden administration is on pace to add $9 trillion in debt in just four years.
See for yourself… the U.S.’s debt load is going parabolic.
At some point, this is going to be a REAL problem. But for those of us focusing on making money from the markets, the important thing to note right now is that the economic “fix” is in. And the Fed’s not going to get in the way.
Small wonder then that stocks keep ripping higher. By the look of things, the S&P 500 will hit a new all-time highs later today.
After all, as investors, our job is to make money, not look for any excuse to dump stocks and panic about something bad happening. And as I’ve outlined in recent articles, this means riding bull markets for as long as possible, and then side-stepping bear markets when they eventually hit.
In the very simplest of terms, you need to be invested in stocks, until an objective, verifiable tool (not your feelings or limiting beliefs) tells you it’s time to “get out.”
I’ve developed a tool that takes ALL of the guessing work out of this problem. With just one look at this tool, you can tell whether it’s a good time to buy stocks or not. I detail it, along with what it’s currently saying about the market today in a Special Investment Report How to Predict a Crash.
Yesterday, I noted that Uncle Sam effectively is the economy… for now.
What I meant by this is that the government is hiring so many people and spending so much money, that it is stopping the economy from rolling over into a recession.
By quick way of review…
Since, mid-2021, public sector job growth has outpaced private sector job growth.
Government transfers (social spending) accounted for 40% of the growth in income in 1Q24 and was the single largest contributor to personal income growth in 20 states.
It is VERY difficult for the U.S. economy to roll over into a recession with this going on. But this economic “prop” is coming at a cost.
The U.S. is issuing a staggering amount of debt to hire all these people and pay out all this money. The Biden administration has already added $7 trillion in new debt and is adding a new $1 trillion in debt every 100 days.
Put simply, assuming President Biden completes his first term, he will have presided over the largest debt expansion in U.S. history: a jaw dropping $9 trillion.
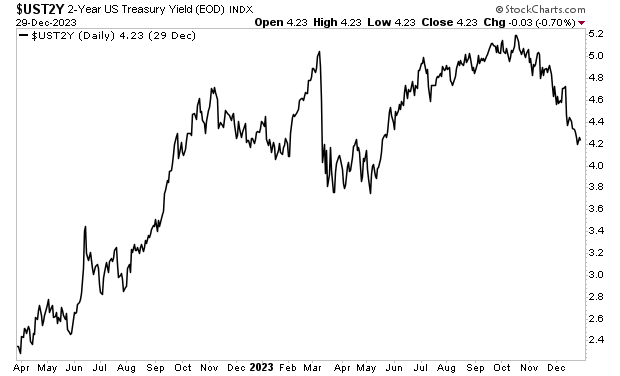
At some point, this is going to be a REAL problem, particularly when you consider that a massive amount of debt that was issued when rates were around zero will come due in the next 24 months.
With rates now over 5%, the U.S. will be forced to pay a lot more money in interest payments when it goes to roll over this old debt.
How much more money?
Interest payments on the national debt are expected to clear $870 billion this year and $1 trillion in 2025. That would make interest payments the single largest government outlay.
In very simple terms, starting next year, Uncle Sam’s will be paying his debtors MORE than he pays Americans via social security.
How will this play out? That remains to be seen. But one thing is clear: all this money printing is stopping the U.S. from rolling over into recession. And this is boosting stocks.
To whit, the stock market has hit a new all-time highs in four of the last five weeks. This is a RAGING BULL of a market, and investors NEED to ride it for as long as possible until the music stops.
Why?
Because when the next recession hits, the market will lose 20%-30% and be DEAD money for at least nine months.
After all, as investors, our job is to make money, not look for any excuse to dump stocks and panic about something bad happening. And as I’ve outlined in recent articles, this means riding bull markets for as long as possible, and then side-stepping bear markets when they eventually hit.
In the very simplest of terms, you need to be invested in stocks, until an objective, verifiable tool (not your feelings or limiting beliefs) tells you it’s time to “get out.”
I’ve developed a tool that takes ALL of the guessing work out of this problem. With just one look at this tool, you can tell whether it’s a good time to buy stocks or not. I detail it, along with what it’s currently saying about the market today in a Special Investment Report How to Predict a Crash.
The most important thing for investors to understand about the economy is that “it is different this time.”
We’ve already assessed how multiple previously accurate recession indicators (yield curve inversion, Sahm Rule trigger, etc.) have registered false positives in this cycle.
Why is this happening?
For one thing, the U.S. has never voluntarily shut down its economy. It’s also never pumped $11 TRILLION (an amount equal to over 50% of GDP at the time) into its financial system in the span of 20 months.
But surely both of those items have been factored into the data by now, right?
Sure, but you also have to consider that the money printing/ spending, hasn’t stopped! The U.S. is currently running the largest deficit as a percentage of GDP outside of WWII.
It is VERY difficult for the economy to roll over into recession with this going on. Indeed, in many ways, the government IS the economy right now.
Since mid-2021, job growth in the public sector/ government (red line in the chart below) has outpaced that in the private sector (blue line in the chart below).
The government isn’t just hiring, either. It’s also putting out gargantuan amounts of money via social spending. As E.J. Antoni notes, 40% of the growth in income in 1Q24 was from government transfers (read: spending). Indeed, government transfers were the SINGLE largest contributor to personal income growth in 20 states!
So Uncle Sam isn’t just hiring… he’s also handing out money by the tens of billions of dollars!
Again, it’s VERY difficult for the economy to roll over into recession with this going on. I’m not saying this will work forever. But we need to see the private sector absolutely collapse to overcome all these government interventions in order for the economy to roll over into a REAL recession.
After all, as investors, our job is to make money, not look for any excuse to dump stocks and panic about something bad happening. And as I’ve outlined in recent articles, this means riding bull markets for as long as possible, and then side-stepping bear markets when they eventually hit.
In the very simplest of terms, you need to be invested in stocks, until an objective, verifiable tool (not your feelings or limiting beliefs) tells you it’s time to “get out.”
I’ve developed a tool that takes ALL of the guessing work out of this problem. With just one look at this tool, you can tell whether it’s a good time to buy stocks or not. I detail it, along with what it’s currently saying about the market today in a Special Investment Report How to Predict a Crash.
I keep warning that “this time really is different” when it comes to the economy.
Everyone knows this on some level… but most analysts are refusing to acknowledge it.
Remember, never before has the U.S. shut down its economy voluntarily. Not during WWII, not during the Spanish flu, NEVER. So that alone was a game-changer as far as how our economy functions (and is measured).
Moreover, never before has the Fed and the Federal Government pumped $11 TRILLION into the financial system in the span of 20 months. Consider that the U.S. economy was ~$20 trillion at the time… so we’re talking about policymakers putting an amount greater that 50% of GDP into the financial system.
Again, this has never happened before. In fact, if you add up all the money ever printed in the history of the U.S., over 40% of it was printed in 2020 alone.
So again, it is “different” this time. Both the downturn, and the policy response were unprecedented. And that has rendered many traditional economic metrics useless at predicting the next move in the cycle.
We’ve already assessed the yield curve inversion, as well as the coming Sahm Rule trigger which we expect later this summer. Today’s lets assess the Money Supply or M2.
In its simplest rendering, M2 measures the amount of money in the financial system (savings accounts, money market funds, etc.) Historically, analysts have looked at M2 to assess whether a recession was coming or not. If M2 goes negative, it usually precedes a recession.
I bring all of this up because in 2023, M2 went negative, resulting in countless analysts and commentators shouting that a recession was about to hit.
The big problem with this is that they forgot to note that M2 had GROWN by 40% during the pandemic… so of course it’s going to decline a bit! Heck even a significant decline is likely to occur after a 40% jump!
Today, M2 is turning back up again. And all the folks who were screaming about its decline indicating a recession was about to hit are silent. And all the investors who sold the farm based on the gurus/ analysts screaming about M2 have missed out on one of the greatest bull runs in stock market history.
Again… it really is different this time. Most historical economic measures are so warped by the pandemic and subsequent policy-response that obsessing over them is only going to lead to missing out on market gains.
After all, as investors, our job is to make money, not look for any excuse to dump stocks and panic about something bad happening. And as I’ve outlined in recent articles, this means riding bull markets for as long as possible, and then side-stepping bear markets when they eventually hit.
In the very simplest of terms, you need to be invested in stocks, until an objective, verifiable tool (not your feelings or limiting beliefs) tells you it’s time to “get out.”
I’ve developed a tool that takes ALL of the guessing work out of this problem. With just one look at this tool, you can tell whether it’s a good time to buy stocks or not. I detail it, along with what it’s currently saying about the market today in a Special Investment Report How to Predict a Crash.
Stocks hit new all-time highs last week… but you wouldn’t know it from the mood on social media and financial TV!
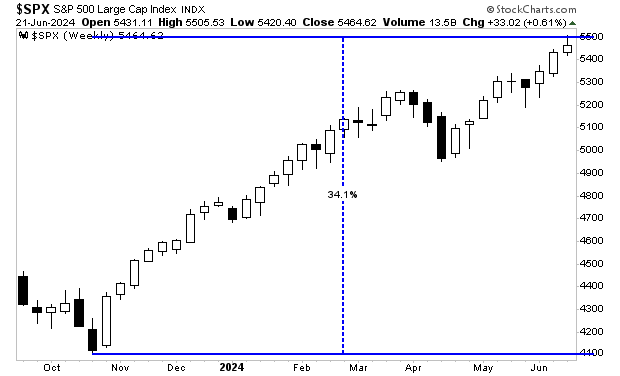
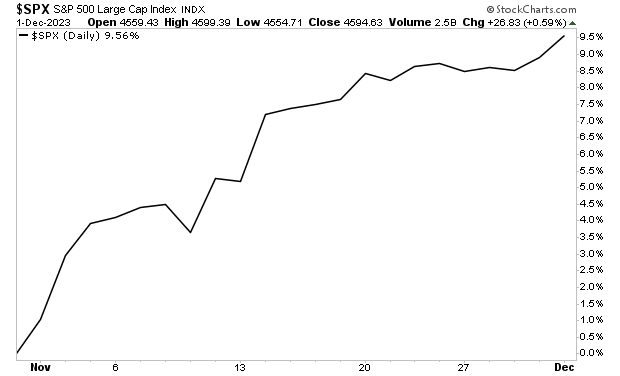
It’s truly incredible to watch… the markets have been on a historic run, with the S&P 500 rallying 1,400 points since the November 2023 lows. And yet, throughout this period, the overall mood amongst market participants seems anxious if not outright worried.
Everywhere you look, there’s talk of a potential recession… or concerns about geopolitics… or claims that Artificial Intelligence (AI) stocks are in a massive bubble that is about to burst.
And yet, the markets keeps charging higher, with every dip being bought. Those who fretted about the countless number of things that could go wrong have made nothing. Those who focused on making money and stayed invested in stocks have seen their entire portfolios increase by over 33%!
Which brings us to #2: trying to calling a top.
Please understand, I’m not trying to make fun of people who are cautious or conservative with their investments. But at some point, if you’re looking to make real money with your investing, you need to focus on what works and ignore feelings/ worries that don’t contribute anything to your net worth.
I’m talking about thoughts like…
1) This stock has gone up a lot, so it must be in a bubble.
2) This is the top!
3) The market is rigged!
NO ONE got rich from any of those three concepts. If your goal is to make money from your investments, you should remove all three of them from your investing vocabulary.
Let’s break down all three.
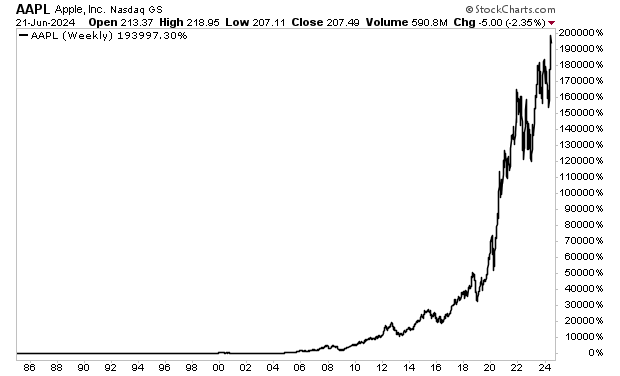
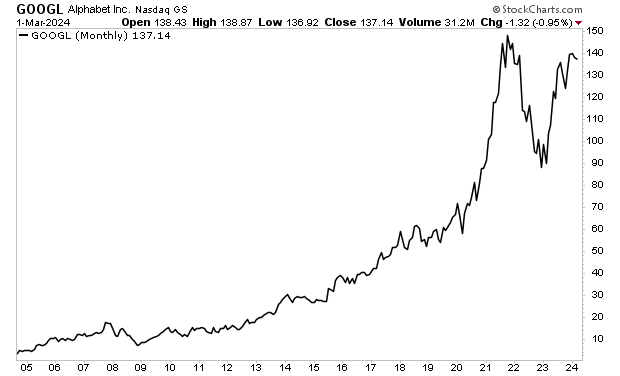
Regarding #1, since going public Apple (AAPL) has looked “bubbly” countless times. Heck, it was up 20,000% in 2018. And yet, if you focused on the fact AAPL had gone up so much, you missed out on the run to 200,000% gains!
Which brings us to #2: trying to calling a top.
No one… I repeat, NO ONE has ever gotten rich from calling a top. A small handful of people have gotten rich from crashes or bear markets… but most if not ALL of investors (including the legends) got rich from riding bull markets or bull moves in individual stocks.
Indeed, every bull market is nothing more than a series of “tops” which are then taken out by new highs. If you’re obsessed with calling a top and getting out of stocks, you’re guaranteeingyou won’t see future gains. Put another way, your obsession is limiting your profits.
Which brings us to #3 in our list: claiming that the market is rigged.
The reason people claim this is because time and again it looks as if stocks are going to break down only to reverse and ramp higher. But if you dig a little deeper into this way of thinking, you quickly realize that it means the person who is angry that the markets refuse to collapse secretly wants something bad to happen to the markets.
Understand, I’m not saying that the markets aren’t manipulated. Anything that involves a lot of money or power breeds corruption and manipulation. But getting angry because stocks refuse to break down badly is bad for your physical health, your mental health, and your portfolio.
As investors, our job is to make money, not look for any excuse to dump stocks and panic about something bad happening. And as I’ve outlined in recent articles, this means riding bull markets for as long as possible, and then side-stepping bear markets when they eventually hit.
In the very simplest of terms, you need to be invested in stocks, until an objective, verifiable tool (not your feelings or limiting beliefs) tells you it’s time to “get out.”
I’ve developed a tool that takes ALL of the guessing work out of this problem. With just one look at this tool, you can tell whether it’s a good time to buy stocks or not. I detail it, along with what it’s currently saying about the market today in a Special Investment Report How to Predict a Crash.
Everywhere you look, people are calling for a recession to hit. In fact, many big name investors and gurus have been calling for a recession for most of the last two years.
During that time, stocks have gone up 50%.
The primary reason people are calling for a recession is that a number of signals that have previously predicted recessions are once again flashing “danger.”
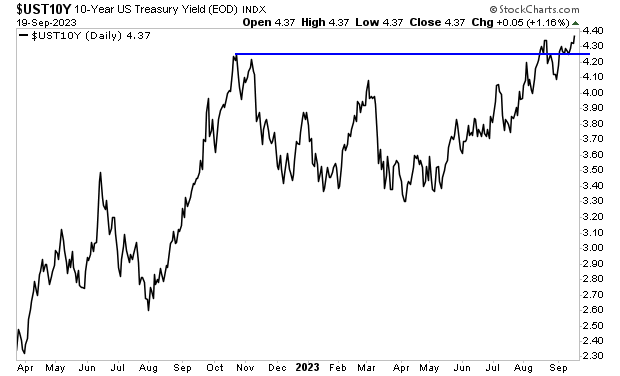
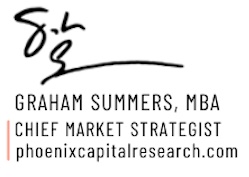
For instance, the yield curve has been inverted for nearly two years. Historically a yield curve inversion followed by a subsequent dis-inversion has predicted every recession since 1980.
You can see this clearly in the chart below. Anytime the blue line broke below 0, the yield curve was inverted. You’ll note that recessions (grey bars) hit soon after the yield curve became dis-inverted (the blue line broke back above 0).
Looking at that chart, many investors believe it’s time to dump their stocks and prepare for a recession and market crash. However, there are two problems with using this metric to invest in stocks today.
1) The pandemic and its economic impact messed up the usefulness of many metrics including the yield curve.
2) Stock returns vary dramatically during yield curve inversions.
Regarding #1, the pandemic/ economic shutdowns and subsequent Fed/ Federal Government interventions have never happened before. Never before in history has the economy been shut down. And never before has the Fed/ Federal Government pumped $11 TRILLION into the financial system in the span of 20 months.
Put simply, our current economic environment is completely different from every other environment in which the yield curve inverted. Case in point, today the Fed is talking about cutting rates while the economy is growing and inflation is falling.
That was not the case when the yield curve inverted in 1980, 1988, 2001, 2007, or 2019. So again, the pandemic messed up a lot of economic metrics that have been accurate in the past.
Which brings us to #2 in our list above: stock returns vary dramatically during yield curve inversions.
Stocks returned anywhere from -38% to +16% during the last five yield curve inversions. That is QUITE a range of returns. And it negates the usefulness of investing based on what the yield curve is doing.
Think of it this way… if someone approached you and said, “if you use this investing trick, you either lose 38% or make 16%,” you’d tell them to take a hike.
Well, that’s what stocks have returned during yield curve inversions.
As investors, our job is to make money, not look for any excuse to dump stocks and panic about something bad happening. And as I’ve outlined in recent articles, this means riding bull markets for as long as possible, and then side-stepping bear markets when they eventually hit.
In the very simplest of terms, you need to be invested in stocks, until an objective, verifiable tool (not your feelings or an inaccurate economic metric) tells you it’s time to “get out.”
I’ve developed a tool that takes ALL of the guessing work out of this problem. With just one look at this tool, you can tell whether it’s a good time to buy stocks or not. I detail it, along with what it’s currently saying about the market today in a Special Investment Report How to Predict a Crash.
As an investment strategist, I get asked this question all the time. On the surface, it sounds as if the person is interested in making money from the stock market.
Having worked in finance for over 20 years, I’ve come to realize that when someone asks me this, what he or she is really saying is that they believe stocks are too risky for investing. After all, during the course of my career the markets have experienced three MAJOR crises. And who wants to put his or her money into an asset class that can lose 30% in a matter of weeks?
Let’s start with the basics of stock market investing.
Stocks are essentially a means of investing in human innovation. Nearly every stock trading on the stock market represents someone’s life work to build a better product/service. Sure, there is the occasional fraud or company that manages to go public without actually producing anything of value, but for the most part, the stock market is the closest thing to betting on human ingenuity/ innovation.
Now, humanity gets a lot of things wrong. But when it comes to inventing/ creating/ developing things, it’s RARELY a good idea to bet against us. For this reason, over the long-term, stocks tend to go up a LOT.
See for yourself.
So why not simply buy stocks ALL THE TIME?!?
Because, during the occasional periods in which stocks DON’T go up… they either A) lose a LOT of money or B) go nowhere for ~20 years.
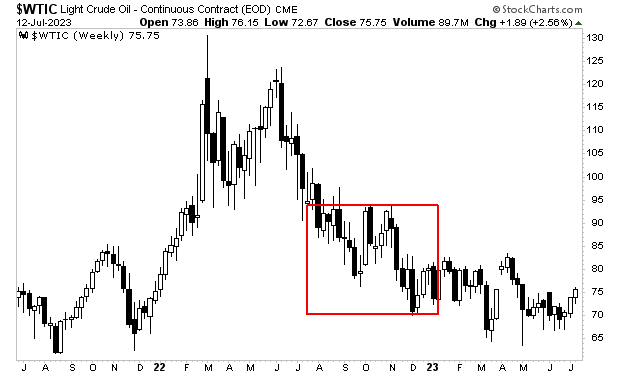
See for yourself. I’ve illustrated those periods in which stocks didn’t do well with red rectangles in the chart below.
Thus, investors are in a quandary.
One the one hand, stocks tend to go up a LOT over the long-term. But on the other hand, there are periods in which stocks do NOTHING for ~20 years.
Thus, the focus for ANYONE looking to invest in stocks is to determine whether stocks are in a strong bull market… or if they are about to enter a prolonged period of ZERO returns.
I’ve developed a tool that takes ALL of the guessing work out of this problem. With just one look at this tool, you can tell whether it’s a good time to buy stocks or not. I detail it, along with what it’s currently saying about the market today in a Special Investment Report How to Predict a Crash.
Everywhere I look on social media, the defining narrative is that the stock market is in a massive bubble that is about to burst, triggering a devastating crash.
The dirty little secret about the people pushing these narratives is that they have never actually called a crash. Instead, they’ve been bearish for years and years, and like a broken clock, they’ve been right once or twice. And I can guarantee you they didn’t make ANY MONEY from a market crash when it DID happen.
Let’s start with the basics here.
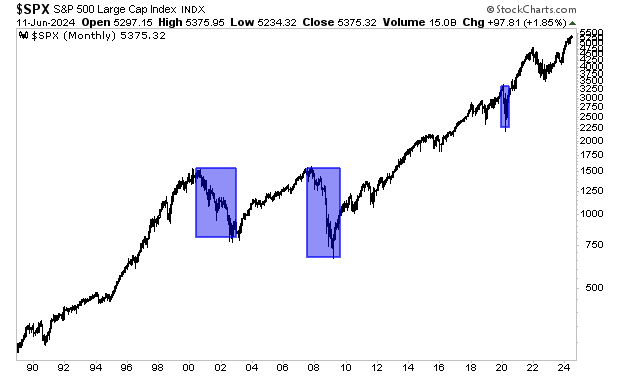
Crashes, DO happen, but they are RARE. There have been THREE in the last 35 years:
1) 2000-2003
2) 2007-2009
3) February-April 2020
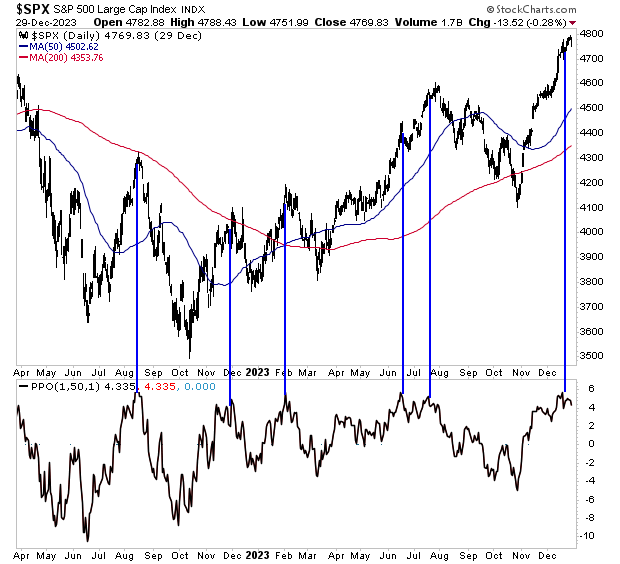
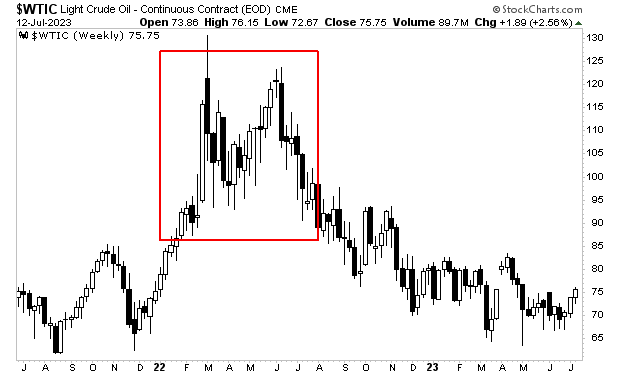
Bear in mind, I’m talking about REAL crashes here or full-scale crises, not garden variety corrections of 10%. I’ve illustrated the crashes of note in the chart below.
Again, there were just THREE major financial catastrophes in a 35 year period, or roughly one every 10 years or so. That’s quite rare. Name another “1 in 10 years” event that people obsess about to this degree. I can’t. People get worked up about buying new homes or changing careers, both of which are “1 in 10 years”-type events… but I don’t see entire Youtube Channels and social media accounts that talk non-stop about those events the same way I see people obsessing about market crashes.
Again, when we talk about crashes, we’re talking about “1 in 10 years” events!
Even if we were to include EVERY time the market dropped more than 10% in rapid fashion, the number of “events” in the stock market is less than 10. Even if I missed a few here, you’re still talking about a “1 in 3 years” event.
Meanwhile, throughout this 35 year period, in spite of these crashes/ events, stocks rose nearly 2,000%. Anyone who obsessed about crashes to the point of avoiding stocks completely, or even worse, betting on a collapse non-stop, missed one of the greatest periods of wealth generation in human history.
So why not simply buy stocks non-stop and hold for the long-term?
Because when crashes DO happen, stocks can take YEARS before they hit new highs.
Consider the period from 1996-2013. There were several MAJOR bull markets that saw stocks generate huge returns. Unfortunately, the subsequent bear markets/ crashes ERASED most if not all of those gains. As a result of this, stocks didn’t make a cent for 17 years!
Thus, investors are in a quandary.
One the one hand, crashes are rare events. And obsessing over them can lead to missing out on creating generational wealth from your investments.
However, on the other hand, when crashes DO happen, they can lead to 10+ years of ZERO returns for long-term, buy and hold investors. What are the odds that a REAL person would be willing to sit through a period like that and not despair?
Likely ZERO.
So obviously, investors need a tool of avoiding crashes, while riding bull markets for as long as possible.
I’ve developed PRECISELY such a tool. I detail it, along with what it’s currently saying about the market today in a Special Investment Report How to Predict a Crash.
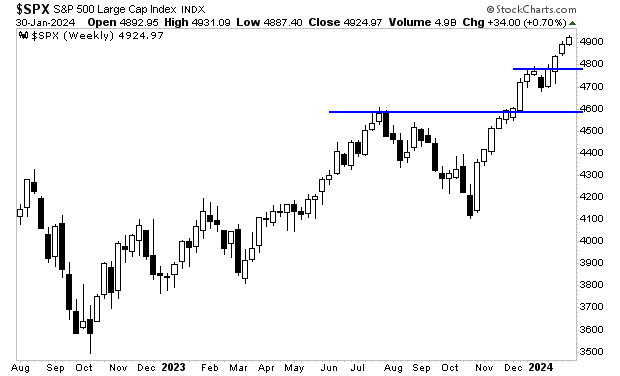
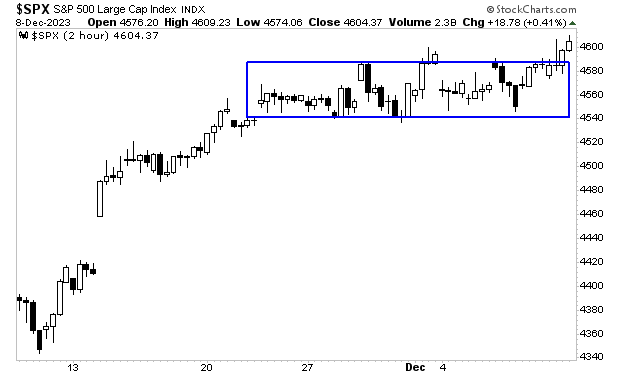
The stock market is setting up to offer a buying opportunity in the next week or two.
The S&P 500 hit a new all-time high last week. Every dip was bought as the markets finished the week in a solid “risk on” framework.
However, beneath the surface, several market leading indicators show a dip is coming…
High yield credit, which has led every turn for stocks in the last four months, has rolled over. As I write this Monday morning, it suggests the S&P 500 will fall to 5,300 in the near future. This is just a “dip” and we see it as a buying opportunity.
Breadth, another market leading indicator, is saying the same thing direction-wise. But it suggests the dip will be slightly deeper with the S&P 500 dropped to the 5,200s . The fact both breadth and high yield credit are saying the same thing, adds weight to the forecast for a risk off move.
Will this risk off move open the door to something worse? Could stocks crash some time in the near future?
To answer those questions, I rely on certain key signals that flash before every market crash.
I detail them, along with what they’re currently saying about the market today in a Special Investment Report How to Predict a Crash.
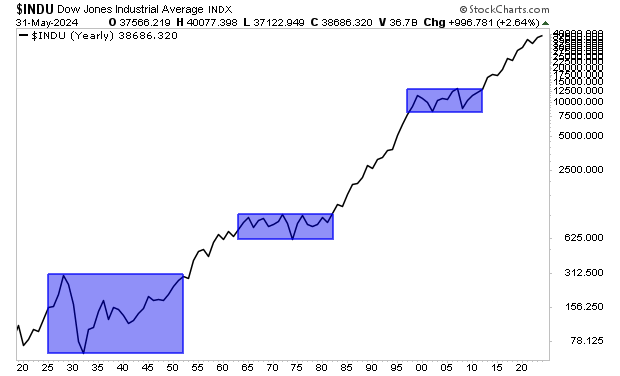
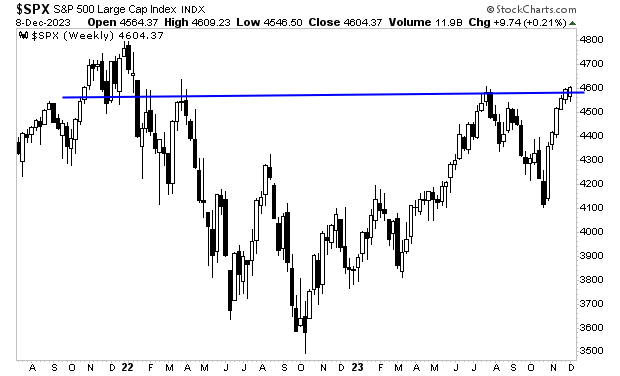
Being bearish is inherently problematic because historically stocks tend to go up… and quite a lot. Over the last 100 years, the Dow Jones Industrial Average has finished the year up 68% of the time. And as you can see in the chart below… they’ve gone up a LOT.
Investing is all about probabilities, and if there is a greater than two thirds odds that stocks will go up in any given year, betting on a collapse is generally going to be a losing bet.
Understand, I’m not suggesting you should be mindlessly optimistic about the markets. There are always risks. But from a big picture perspective, stocks tend to go up, and go up quite a lot.
This should be the foundation for your view of the markets.
So why not simply buy stocks any time you have any additional capital?
Because when stocks DON’T go up, they either:
1) Go nowhere for years, if not decades.
2) Can lose a LOT of money VERY quickly.
Regarding #1, take a look at the below chart of the Dow Jones Industrial Average since 1919. You’ll note that there were three periods in which stocks went nowhere for a considerable length of time.
They were:
1) 1923-1953 (30 years)
2) 1963-1982 (19 years)
3) 1993-2015 (22 years)
Anyone who loaded up on stocks automatically throughout these time periods didn’t make a cent for decades.
There are a lot of analysts who ignore these facts and tell their clients to simply buy stocks for the long-term at any time, but what are the odds that a real person, putting real money to work in the markets could sit through ~20 years of NO gains and not despair?
ZERO.
Put simply, if you’re looking to make REAL wealth from the markets, you need to focus on WHEN to buy stocks and when to avoid them.
You’re probably wondering how can I act so carefree about stocks today when there are clearly so many issues in the world?
The answer is simple: I have proprietary triggers that hit before any major market break-down. Until one of them goes off, the market is telling me that stocks aren’t concerned about the issues/ risks.
To figure that out, I rely on certain key signals that flash before every market crash.
I detail them, along with what they’re currently saying about the market today in a Special Investment Report How to Predict a Crash.
After all, there’s the prospect of a recession, the massive deficit ($1.6 trillion), conflict in the Middle East, the so-called AI bubble waiting to burst, and more.
However, despite all of these problems, stocks keep rising. In fact, they closed at new all-time highs just last week. Anyone who sold their holdings based on any of the above risks missed out on growing their portfolio. Anyone who panicked in April and sold their positions… or even worse DIDN’T take advantage of the drop to go long, has missed out on a LOT of money.
It’d be bad enough to do this once… but unfortunately many investors do this time and time again to the point of missing out on MILLIONS’ of dollars worth of gains.
It all stems from a lack of understanding about the stock market.
At any given time, the market’s action is determined by the decisions of millions of individuals, all of whom have “skin in the game” in the form of money. So, the market is processing literally billions, if not trillions, of pieces of information every day.
However, out of all these pieces of information, stocks usually only “care about” or focus on two or three items at any particular time. Sometimes it might be the economy. Other times it might be the Fed. Other times it might be a war, or a President’s actions (or tweets), or a hedge fund blowing up, or inflation, etc.
And until stocks start caring about a specific issue to the point of breaking down… all the hypothetical risks or issues that investors care about individually are unimportant (as far as stocks are concerned).
This is the single biggest mistake most investors make: worrying or panicking about risks to the point of missing out on bull markets. It’d be one thing if this was just a mistake… but it’s a costly mistake. As I mentioned earlier, investors miss out on MILLIONS of dollars’ worth of market gains when they don’t catch the big market rallies.
I realize the above words sound crazy coming from me. After all, two of the biggest calls of my career involved betting on bad things happening: the Great Financial Crisis of 2008 and the EU Debt Crisis of 2011-2012.
So how can I act so carefree about stocks today when there are clearly so many issues in the world?
The answer is simple: I have proprietary triggers that hit before any major market break-down. Until one of them goes off, the market is telling me that stocks aren’t concerned about the issues/ risks.
I’ll detail one of the them in tomorrow’s article… but in the meantime, if you’re looking for someone to guide your investing to make sure you’re NOT missing out on the biggest market gains, I can help.
Some quick facts about my track record.
I first recommended shares of Nvidia (NVDA) to clients in 2007 when it was trading at a split-adjusted price of $1 per share (it’s over $900 today).
I moved clients into Microsoft (MSFT) in 2014 when it was below $50 a share (it’s over $400 today).
We also bought AutoZone in 2012 when it was $422 a share (it’s over $2,700 today).
Simply put, when it comes to making BIG money from investing, I’ve done it time and again. Indeed, since 2015, subscribers of my Private Wealth Advisory have maintained a win rate of 74%.
Yes, we made money on three out of every four trades we closed… for EIGHT YEARS STRAIGHT!
And I believe 2024 is going to be our best year yet! We’ve already locked in gains of 10%, 15%, 27%, 30% and 67%… and the year isn’t even half over!
I’d love to have you join us. And you can do this today, for just $3.99 with a 30-day trial to Private Wealth Advisory!
Before proceeding I must warn you that this offer will expire this coming Friday at midnight!
A six month subscription comes with:
Again, the doors close on this offer this Friday at midnight.
Japan is showing us the endgame for central bank insanity.
Ever since the Great Financial Crisis, the Fed has been following Japan’s playbook for propping up a financial system. Indeed, everything the Fed has done, Japan originally nearly a decade earlier.
The Fed first cut interest rates to zero in 2008. Japan did that in 1999.
Similarly, the Fed first introduced large-scale Quantitative Easing (QE) programs in 2008. Japan first did that in 2001.
My point is that Japan is the grandfather for central bank insanity. Because of this, the current situation in that country bears watching as it shows us the endgame for what will eventually unfold in the US.
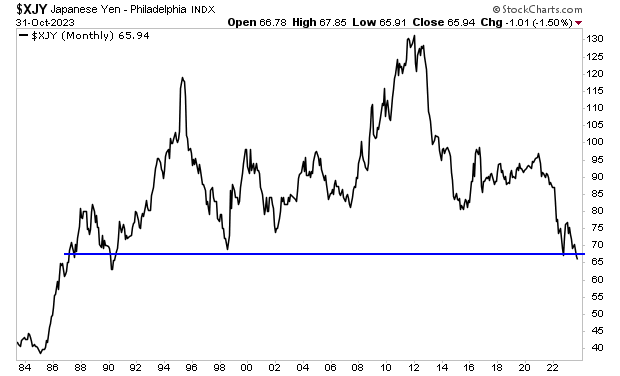
I’m talking about the collapse of a currency.
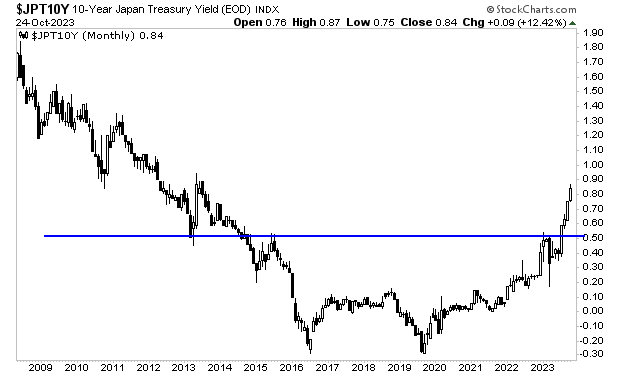
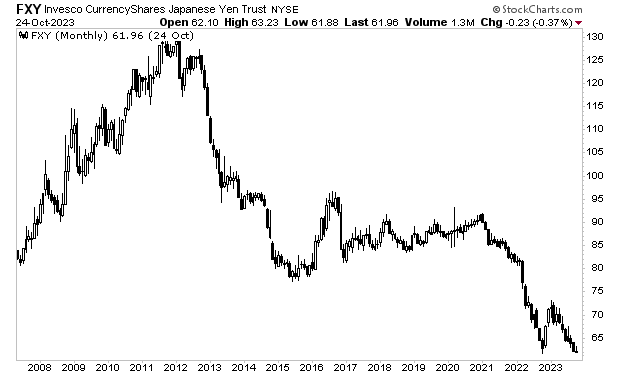
Japan’s currency, the Yen, started collapsed in 2002. Since that time, Japan’s central bank, the Bank of Japan or BoJ for short, has begun intervening to prop up the currency.
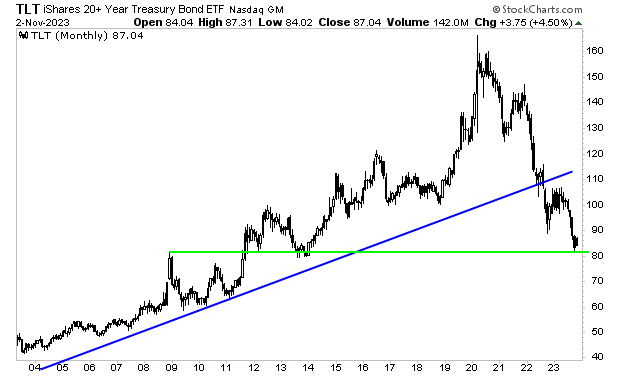
As you can see in the below chart, every single one of these interventions has failed. The Yen is now hanging on to the edge of a cliff by its fingernails. If this last line of support gives way, it could enter a free-fall.
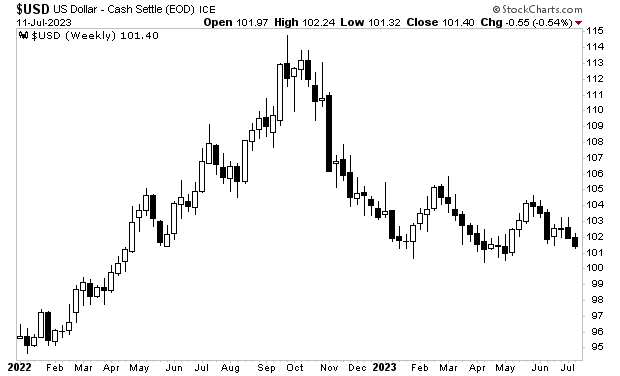
Put simply, the third largest economy in the world is on the verge of an outright currency collapse. And if you think this couldn’t happen in the U.S., you are mistaken. The Fed has already signaled that it will be inflating away the U.S. debt in the coming years.
This means the $USD slowly entering a death spiral… and inflation trades making fortunes.
There is a LOT of money to be made here… and if you’re looking for a means to to insure you profit from it, we recently published a Special Investment Report detailing three investments that will profit from the Fed’s inflationary mistakes. As I write this, all three of them are exploding higher.
Normally this report would cost $499, but we are giving copies FREE to anyone who joins our daily market commentary.
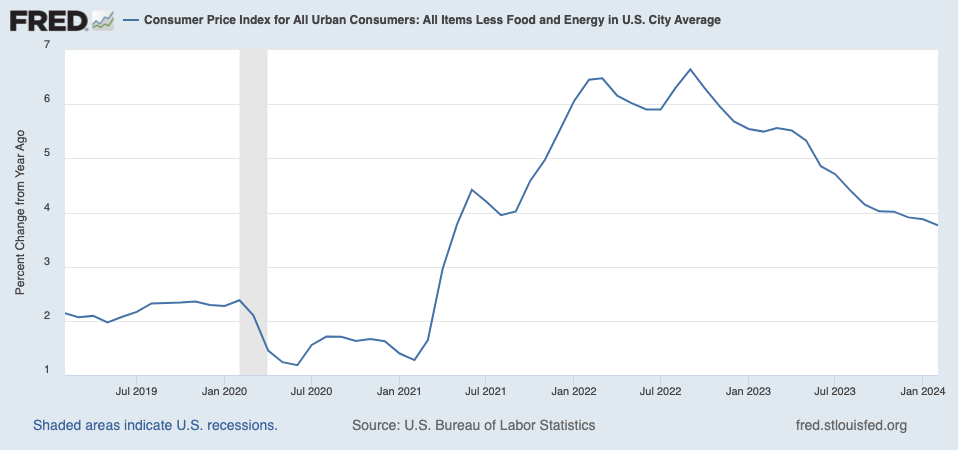
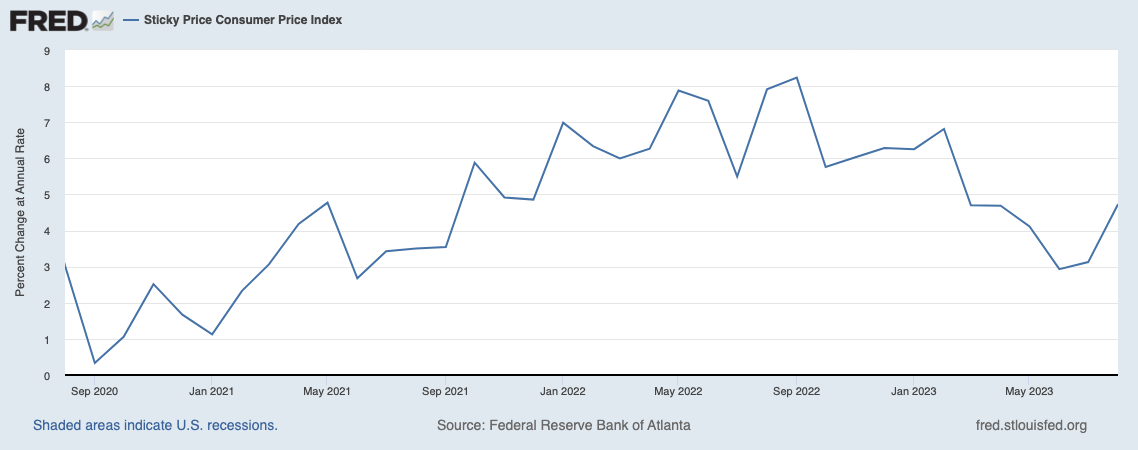
Since that time, the Fed has shifted to talking about easing monetary conditions.
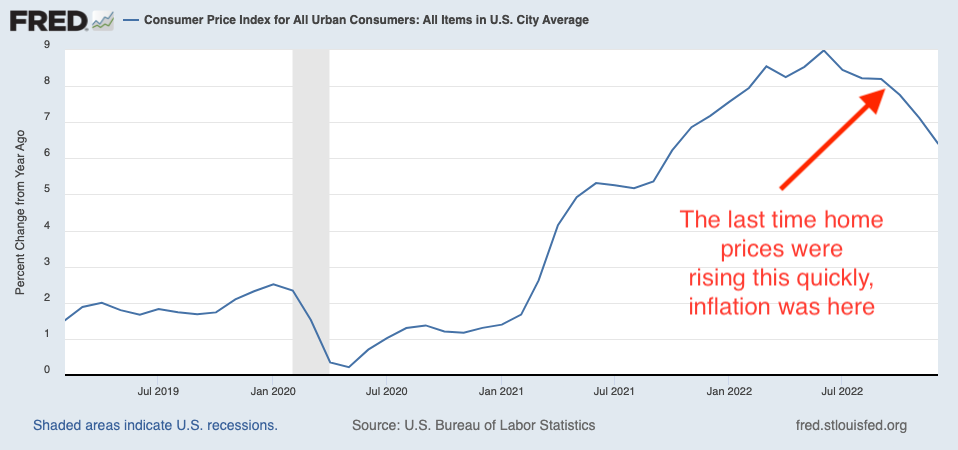
This has ignited a second wave of inflation.
On an annualized basis, the 1-month change in inflation is 3.9%
On an annualized basis, the 3-month change in inflation is 4.4%
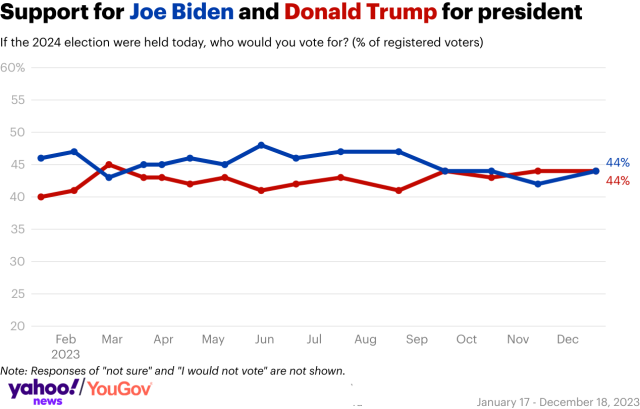
This resurgence in inflation has benefited former President Trump’s campaign as Americans by and large vote with their wallets.
Former President Trump has set his sights on the Fed.
Regarding #5, Trump is convinced the Fed plays politics to benefit the establishment/ leftists. He believes the Fed intentionally sabotaged the economy during his first term by raising rates aggressively from 2017-2019. He also believes the Fed is actively juicing the markets to help the Biden administration today (he’s not wrong there).
And unlike his prior attacks on the Fed, which largely consisted of tweets and interviews in which he mocked Fed officials, this time around, Trump is planning to take action if elected.
Trump’s advisors recently leaked a proposal to overhaul the Fed completely should Trump win in 2024. Among the various proposals:
Allowing Trump to fire Fed Chair Jerome Powell before the latter’s term is up.
Revising the Fed’s leadership structure to include the White House in decisions concerning monetary policy (including cutting or raising interest rates).
Using the Treasury to keep Fed policy “in check”
Let me be clear here: I’m not saying that I agree with Trump’s proposals or that a Trump win in 2024 would be a good thing. I’m simply pointing out, as a statement of fact, what Trump plans to do if he wins.
This terrifies the Fed. If there’s one thing policymakers DON’T like, it’s being told what to do, or worse still, being fired.
And thus the Fed is in a pickle. On the one hand, it wants to do everything it can to juice the economy/ stock market to insure Trump doesn’t win.
But on the other hand… juicing the financial system is highly inflationary, which makes it more likely that Trump will win!
So what does this mean for stocks?
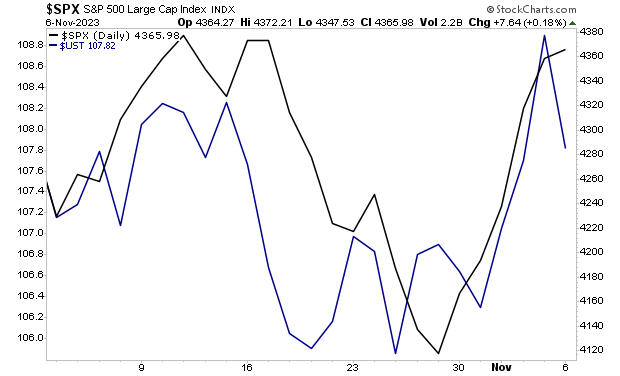
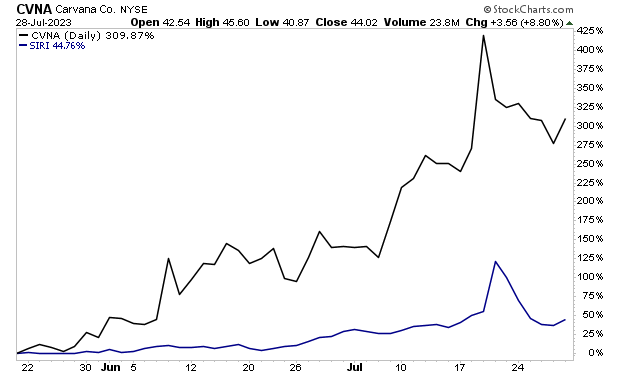
Increased volatility.
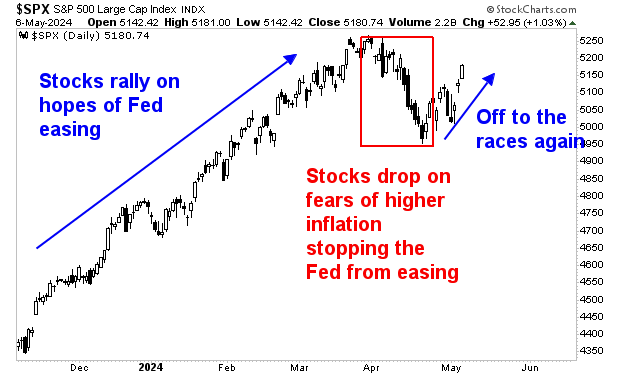
Stocks are being pulled in two directions shifting from focusing on potential Fed easing, to worrying about higher inflation resulting in the Fed having to tighten again.
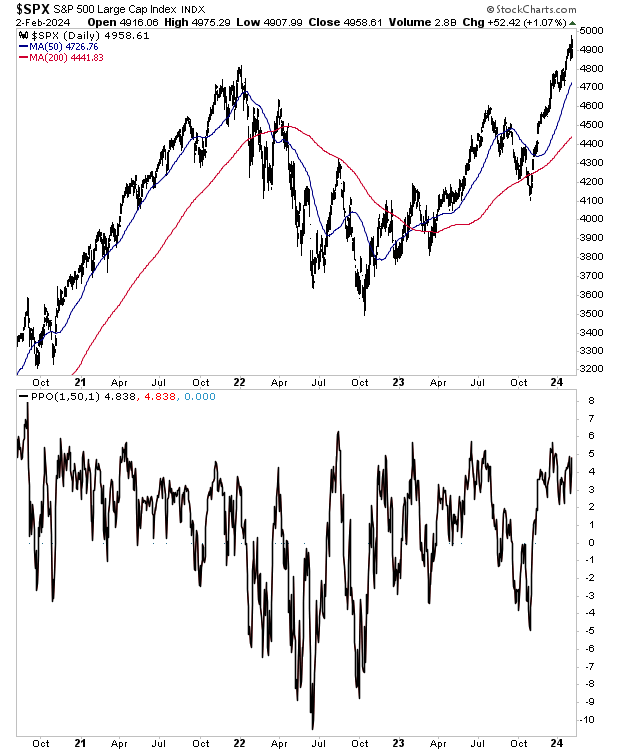
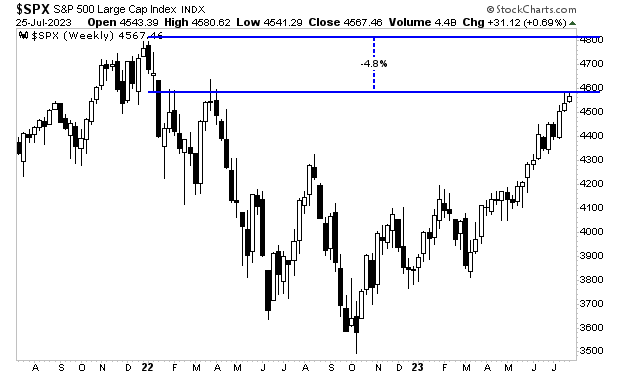
We’ve already gotten a taste of this in 2024.
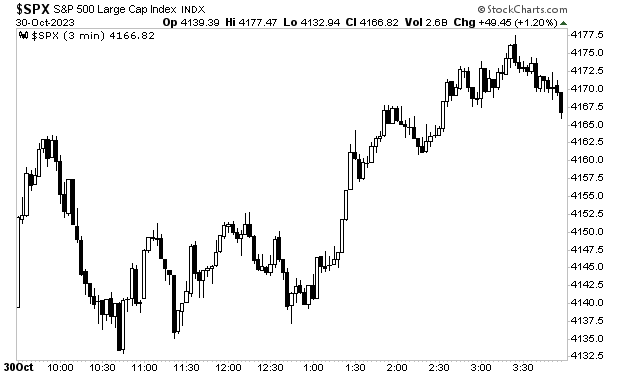
Stocks came into the year roaring higher on hopes of the Fed cutting rates. Then inflation began to tick upwards, resulting in stocks falling on fears that the Fed wouldn’t be able to cut rates any time soon.
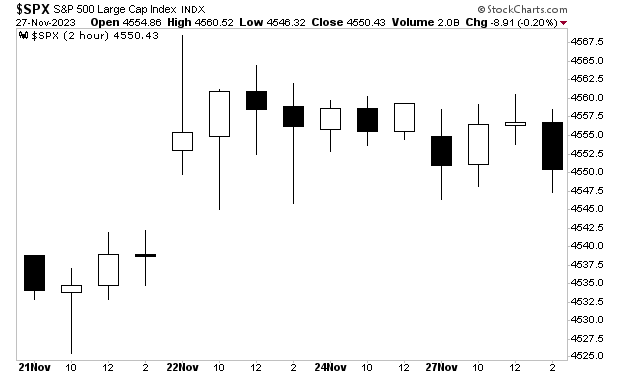
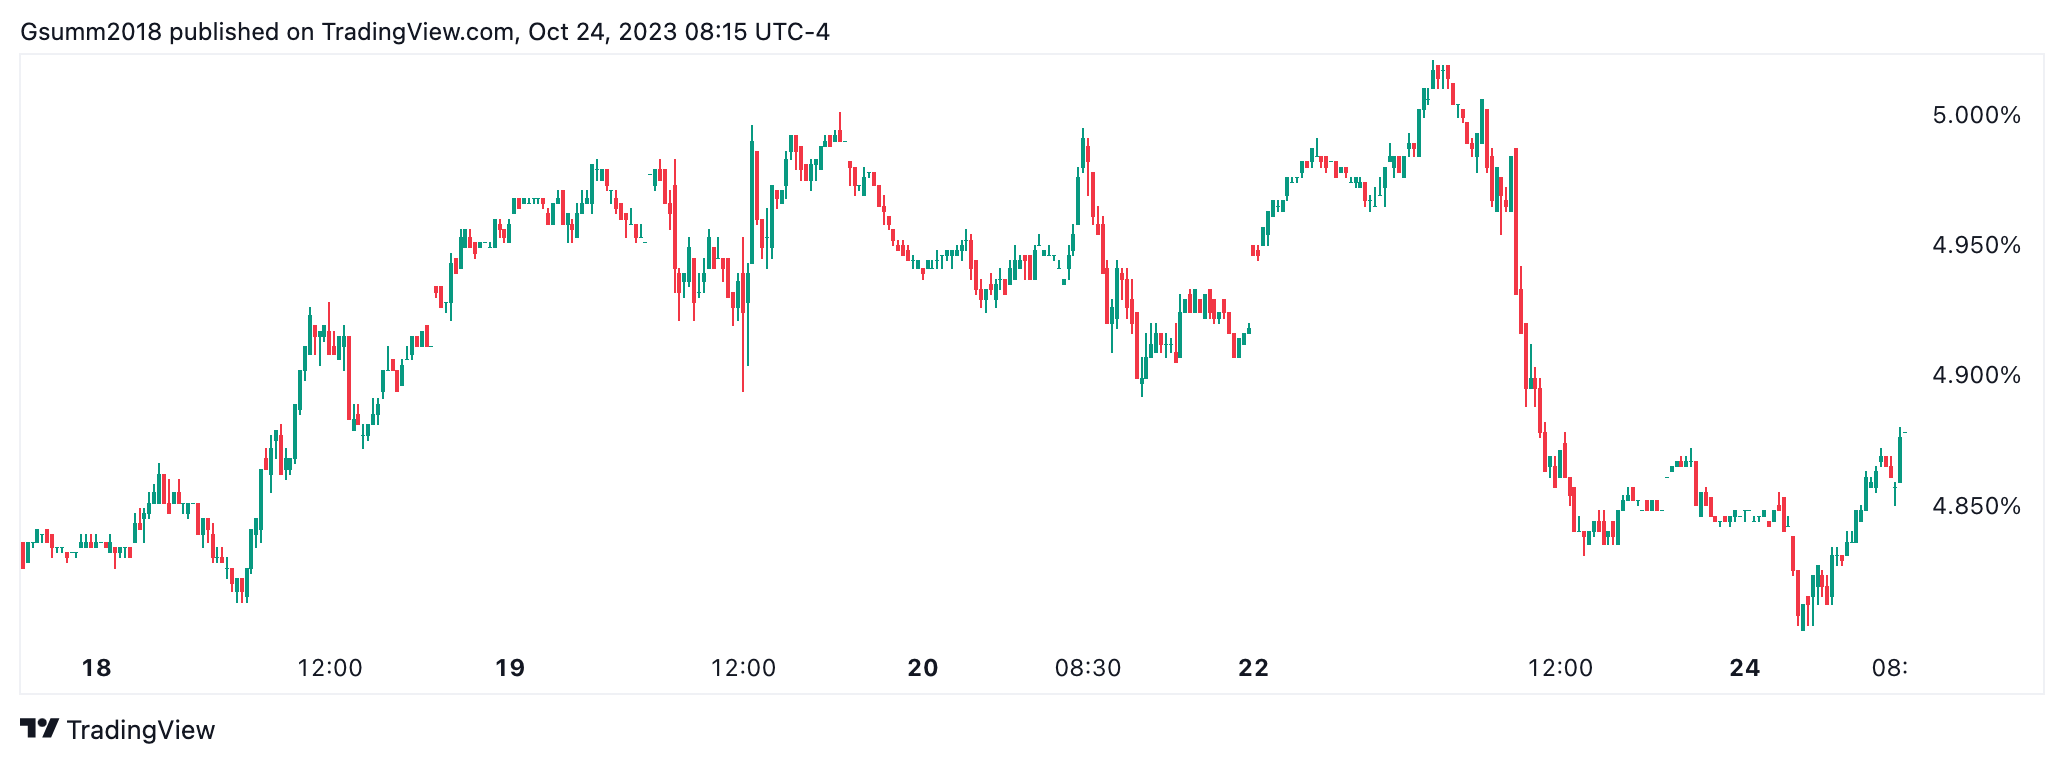
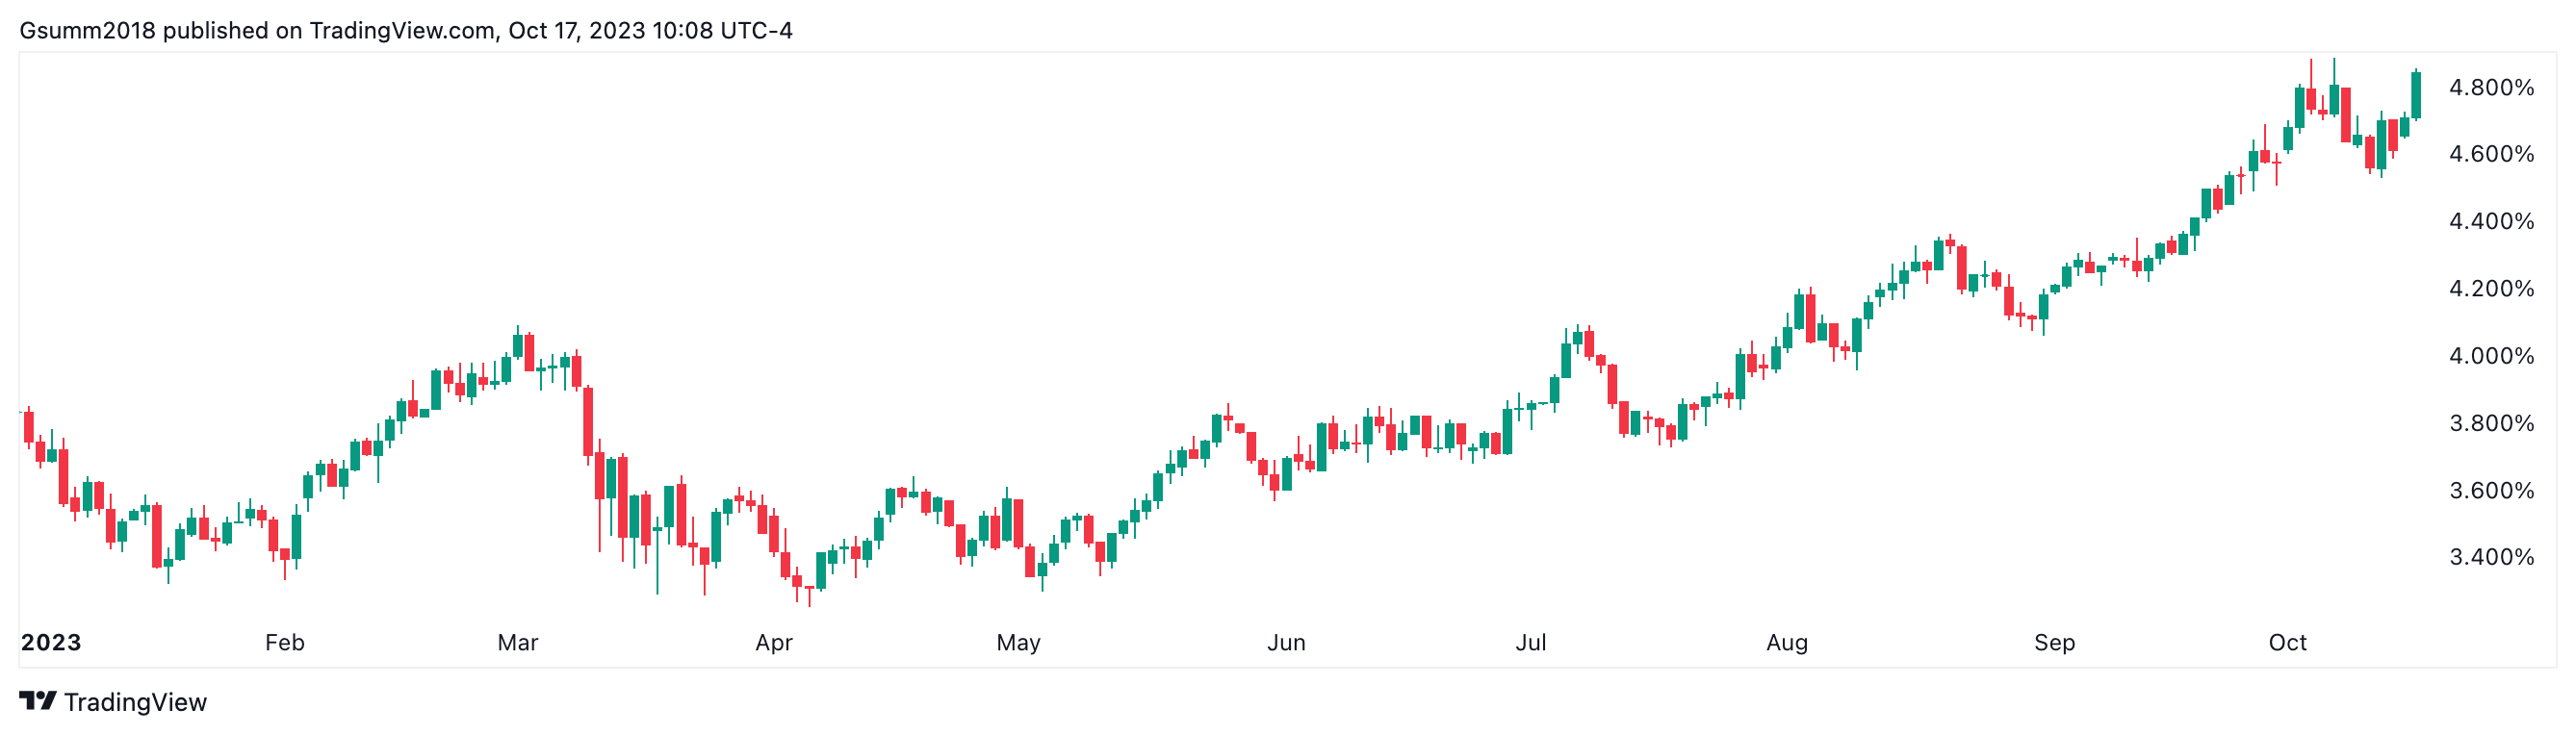
We’re not talking about small price swings either as the below chart illustrates.
What does this mean for investors?
Your best bet is to ride the inflationary impulse into the election. After that, everything hinges on who wins.
What investments will profit the most from this situation?
To answer that, we recently published a Special Investment Report detailing three investments that will profit from the Fed’s inflationary mistakes. As I write this, all three of them are exploding higher.
Normally this report would cost $499, but we are giving copies FREE to anyone who joins our daily market commentary.
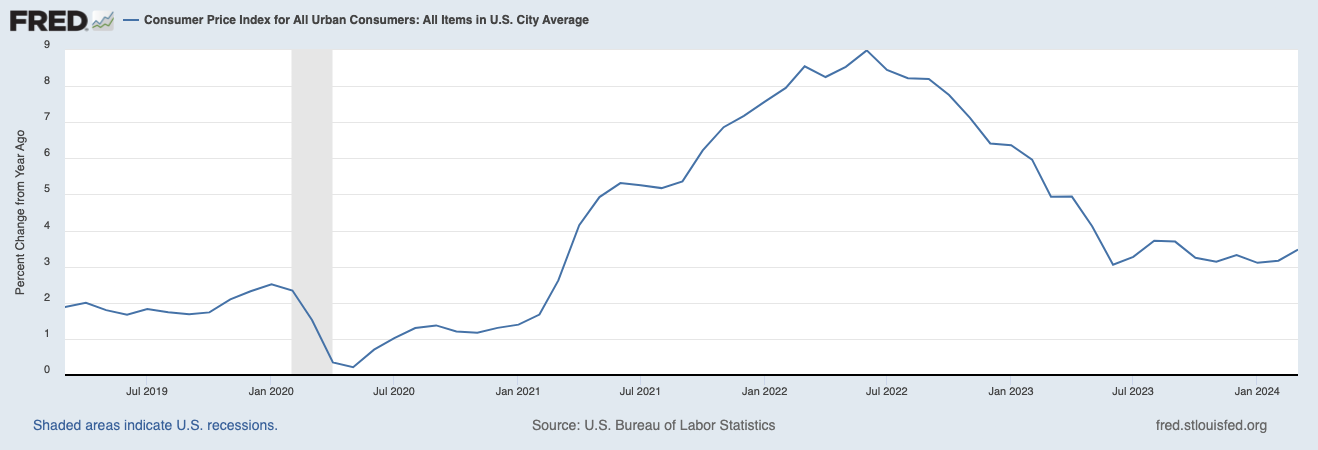
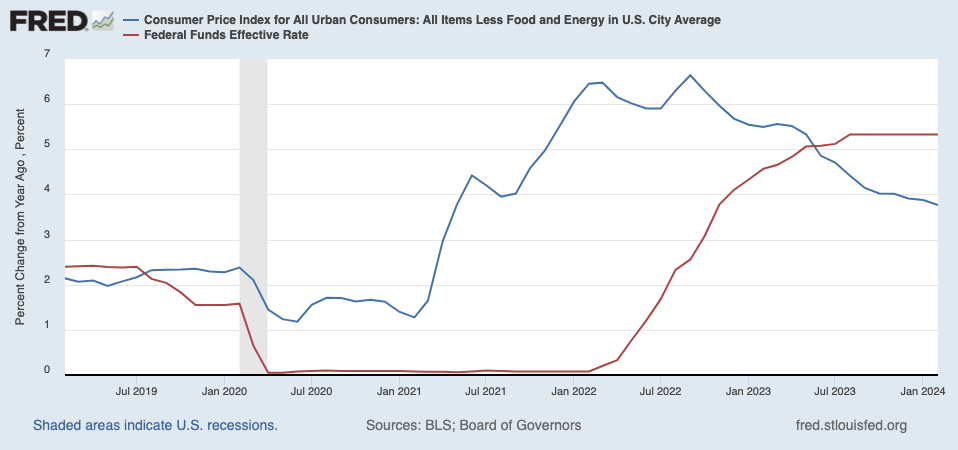
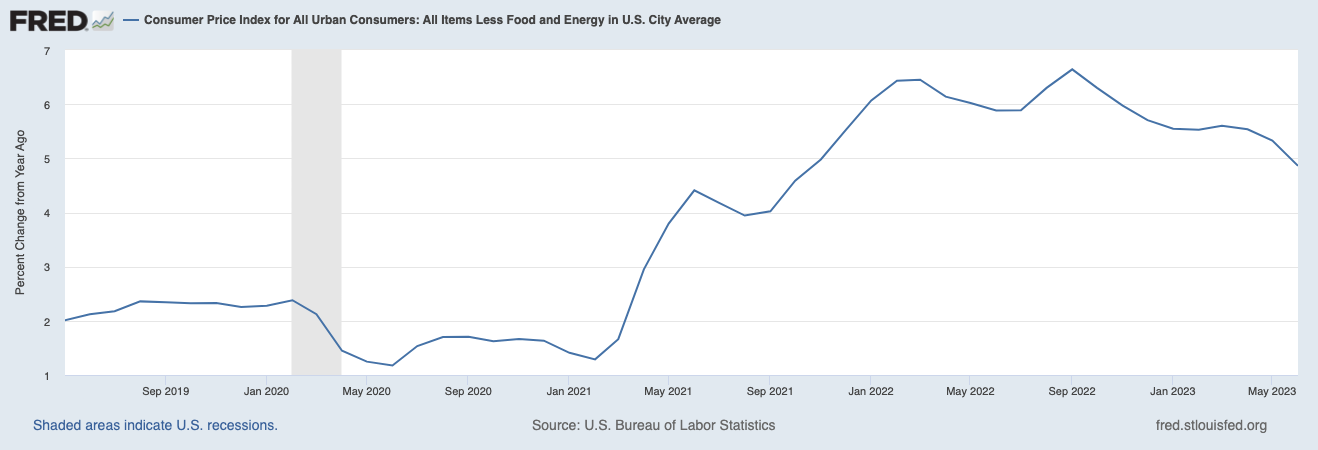
Because, its efforts to loosen monetary policy to juice stocks and real estate higher to aid the Biden administration with its re-election campaign have unleashed another round of inflation.
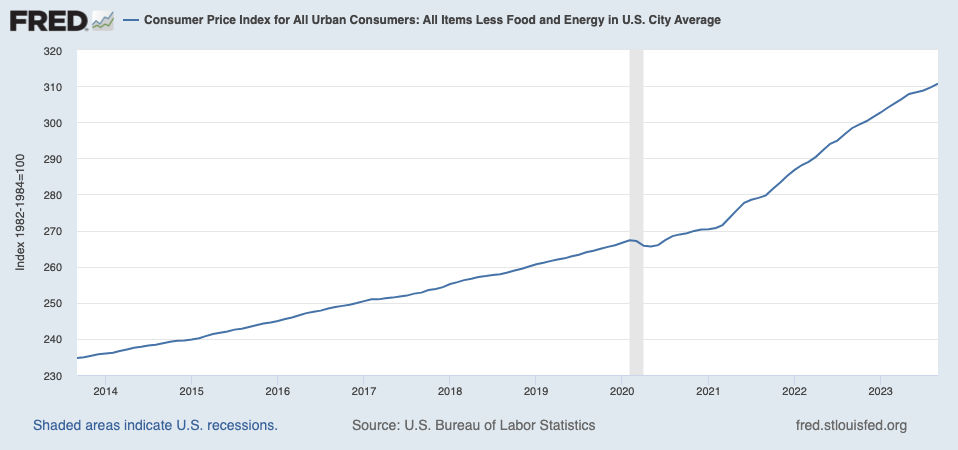
Don’t believe me? See for yourself.
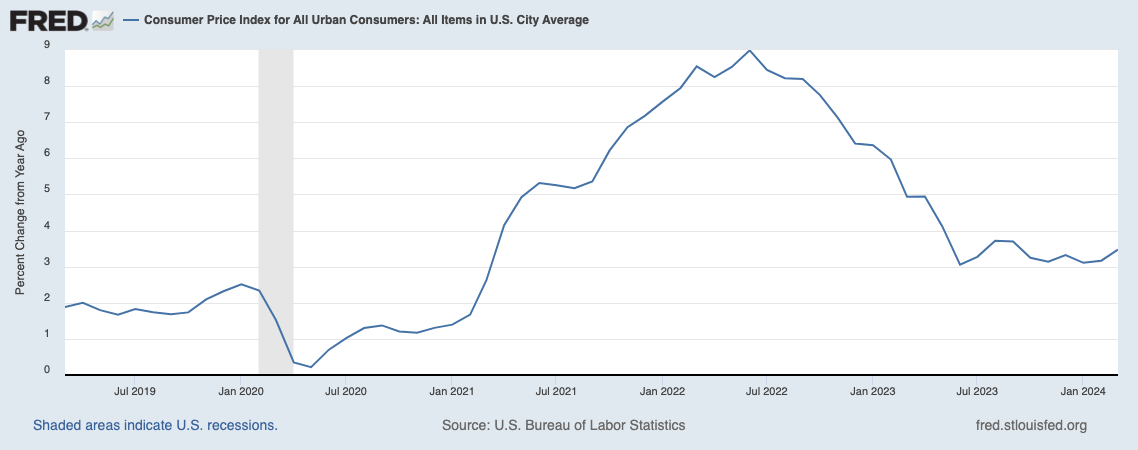
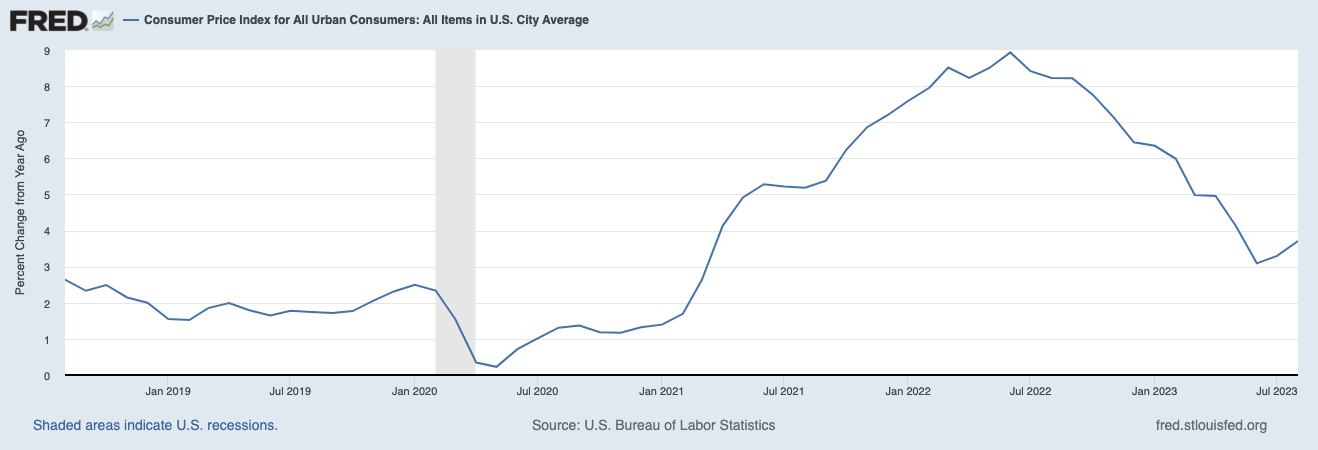
The Consumer Price Index (CPI) bottomed right around the time the Fed stopped raising rates. It has since flat-lined and is now turning back up.
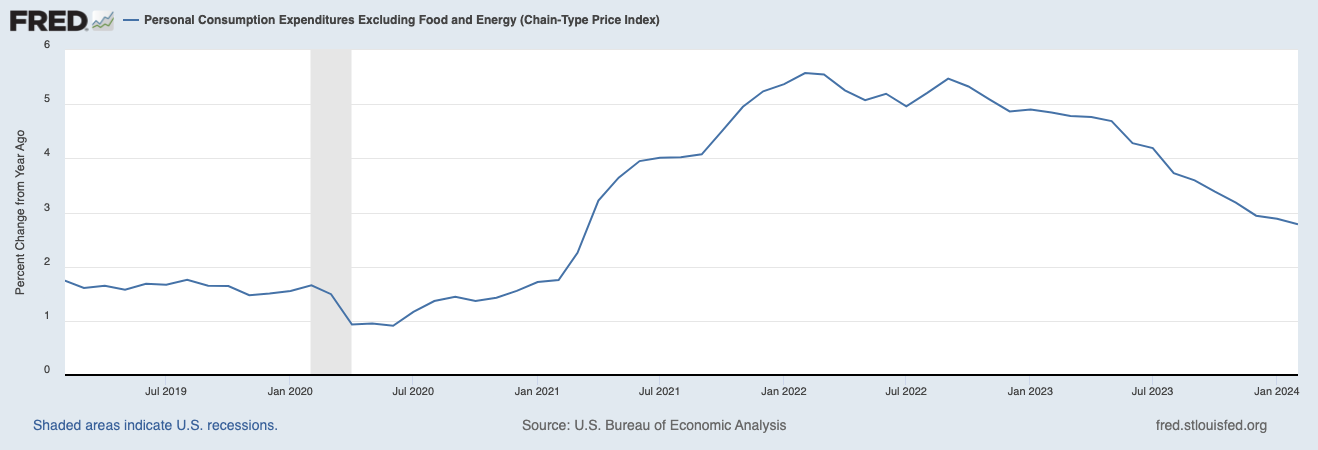
The same is true for the Fed’s preferred inflation measure, core-Personal Consumption Expenditures or core-PCE.
That little uptick doesn’t look like much, but as economist Jason Furman notes, if you annualize the 1-month and 3-month changes in core-PCE, the situation the second wave of inflation becomes clear.
Annualizing the 1-month MoM rate of change in Core-PCE gives you inflation of 3.9%.
Annualizing the 3-month MoM rate of change in Core-PCE gives you inflation of 4.4%.
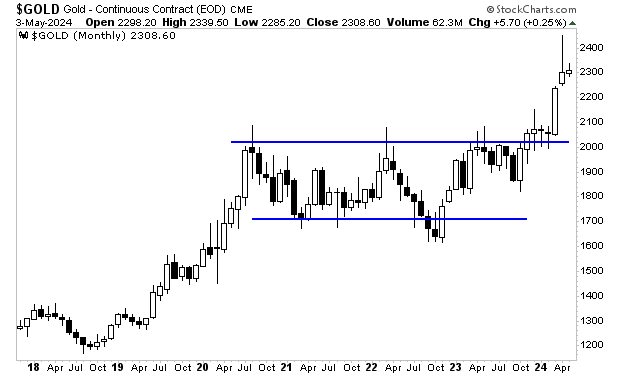
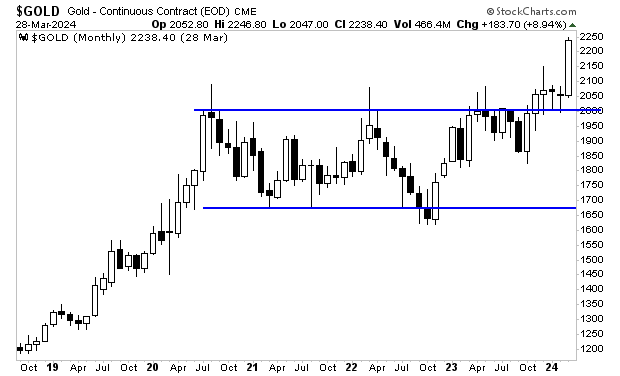
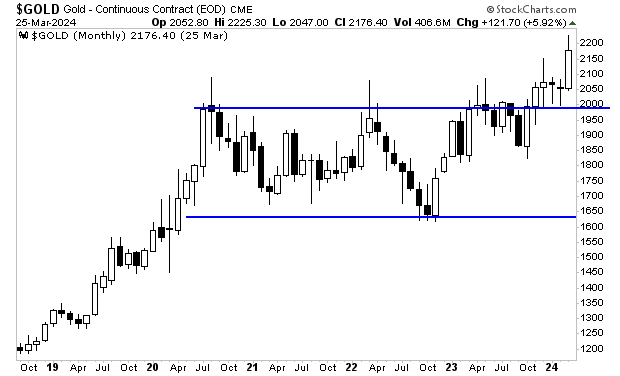
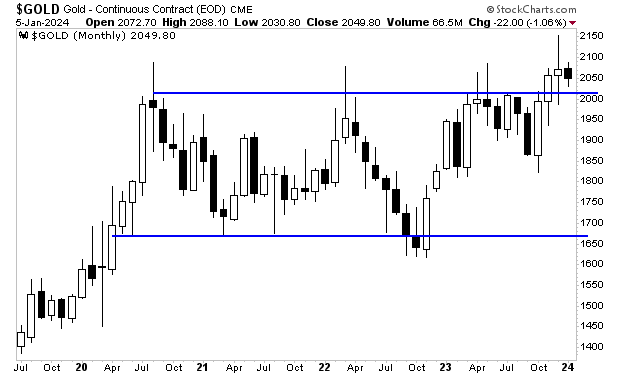
Still not convinced? Take a look at what gold is doing.
As a general rule, Americans vote with their pocketbooks. And this spike in inflation is TOXIC for the Biden administration.
Former President Trump is one of the most unlikeable candidates in history… and yet, he’s been gaining on President Biden in the polls ever since inflation started ticking back up again in September 2023 (see for yourself)
So what will the Fed do? Its monetary easing boost stocks and real estate, but it also worsens inflation, which increases the odds of former-President Trump taking the White House. And what investments will profit the most from this situation?
To answer that, we recently published a Special Investment Report detailing three investments that will profit from the Fed’s inflationary mistakes. As I write this, all three of them are exploding higher.
Normally this report would cost $499, but we are giving copies FREE to anyone who joins our daily market commentary.
On the one hand, the economic data ranges from good to great, with GDP growth clocking in at an annualized rate of 3.9%, and the economy adding ~300,000 jobs per month.
On the other hand, President Biden has the worst job approval rating in 70 years with just 38.7% of Americans approving of his efforts. And always remember, Americans vote with their wallets.
How are these two items possible? How can the economy be doing so well and President Biden be so unpopular?
The answer is quite simple: Bidenomics is actually Bubble-nomics through which the Federal Reserve juices the stock and real estate markets to levels that have no real connection to reality.
Those Americans who make up the top 20%, and especially the top 1% of the economy (the ones who own a lot of stocks and real estate) are doing GREAT. Everyone else? Not so much.
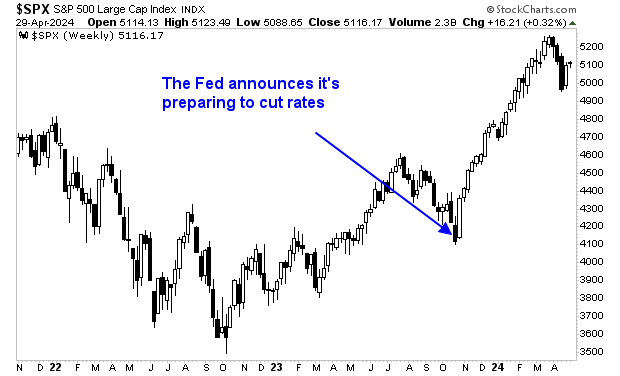
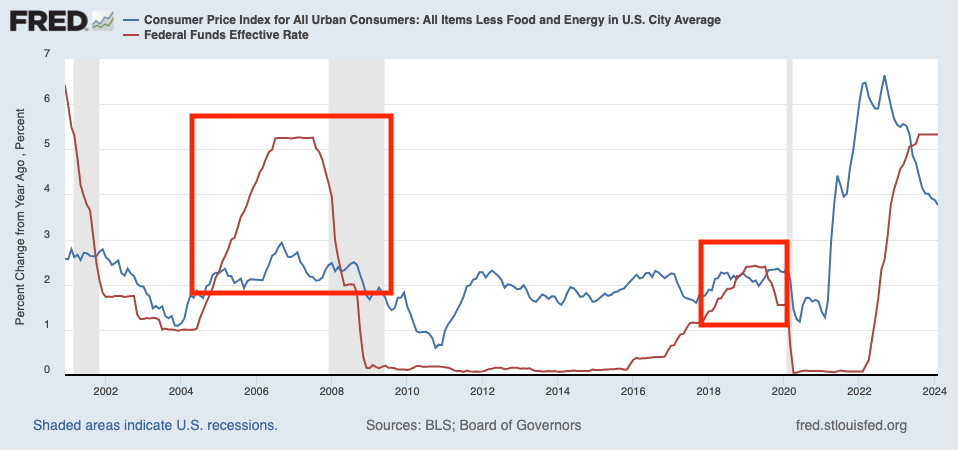
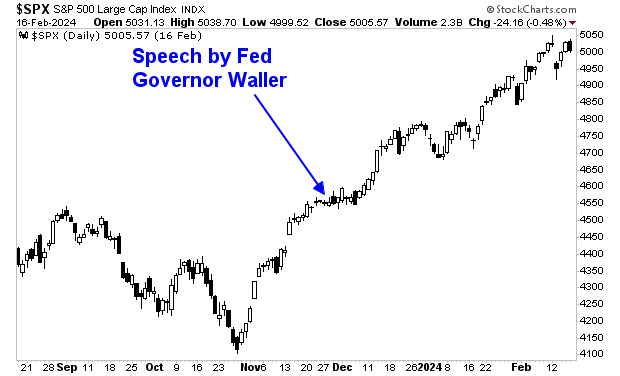
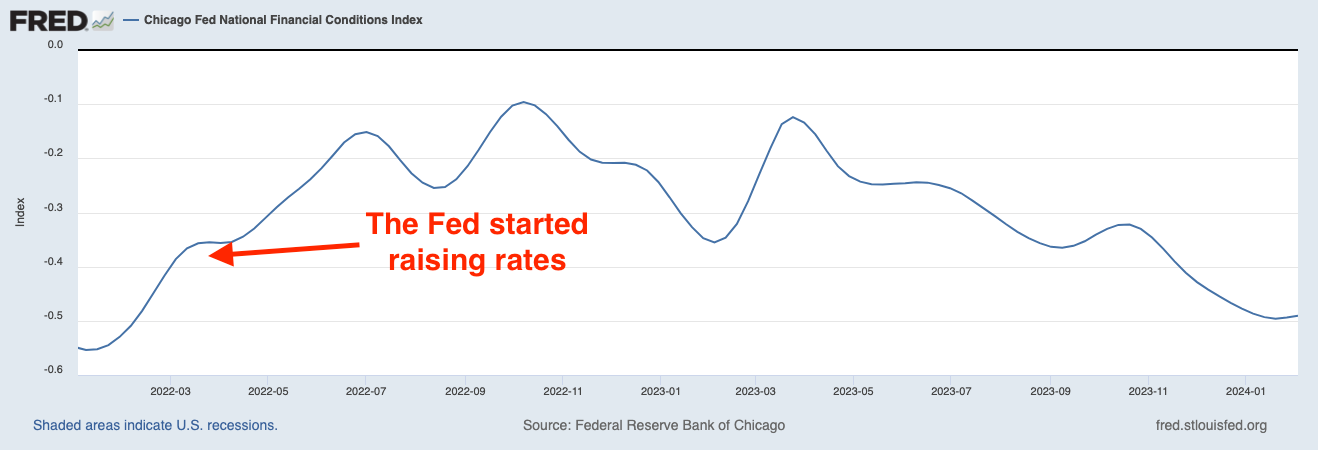
It all started in November of last year. At that time, the Fed announced that it was getting ready to start cutting interest rates despite the fact that inflation was still well above 3% and financial conditions were actually looser than they were before the Fed started tightening monetary policy to end inflation!
Stocks literally EXPLODED higher on the announcement and haven’t looked back.
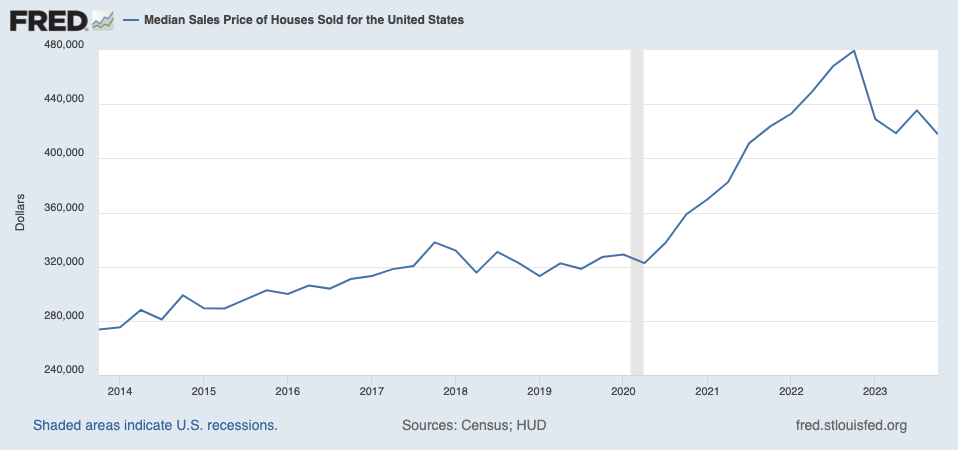
As for real estate, the Fed effectively cornered the Mortgage-Backed Securities (MBS) market during the pandemic, sending home prices through the roof. Even with this market cooling in the last year or so, prices are WAY higher than they were before the Fed intervened.
By the way, once the Fed starts cutting rates, this market will also explode higher as two-years of pent up demand (mortgage rates were prohibitively high for most of the last two years) comes to market.
The top 20% of the country, particularly the top 1%, who own more assets that the entire Middle Class (the mid-60% in income brackets) have seen their net worth EXPLODE higher during President Biden’s first term.
These individuals comprise an extreme amount of the consumer spending/ economic drivers that are masking how the other 99% of the country are doing.
What does this mean for the markets?
I’ll detail that in tomorrow’s article.
On that note, we recently published a Special Investment Report detailing three investments that will profit from the inflationary effects of Bidenomics. Normally this report would cost $499, but we are giving copies FREE to anyone who joins our daily market commentary.
The stock market has finally woken up to what I’ve been warning about for weeks… namely that inflation is rebounding.
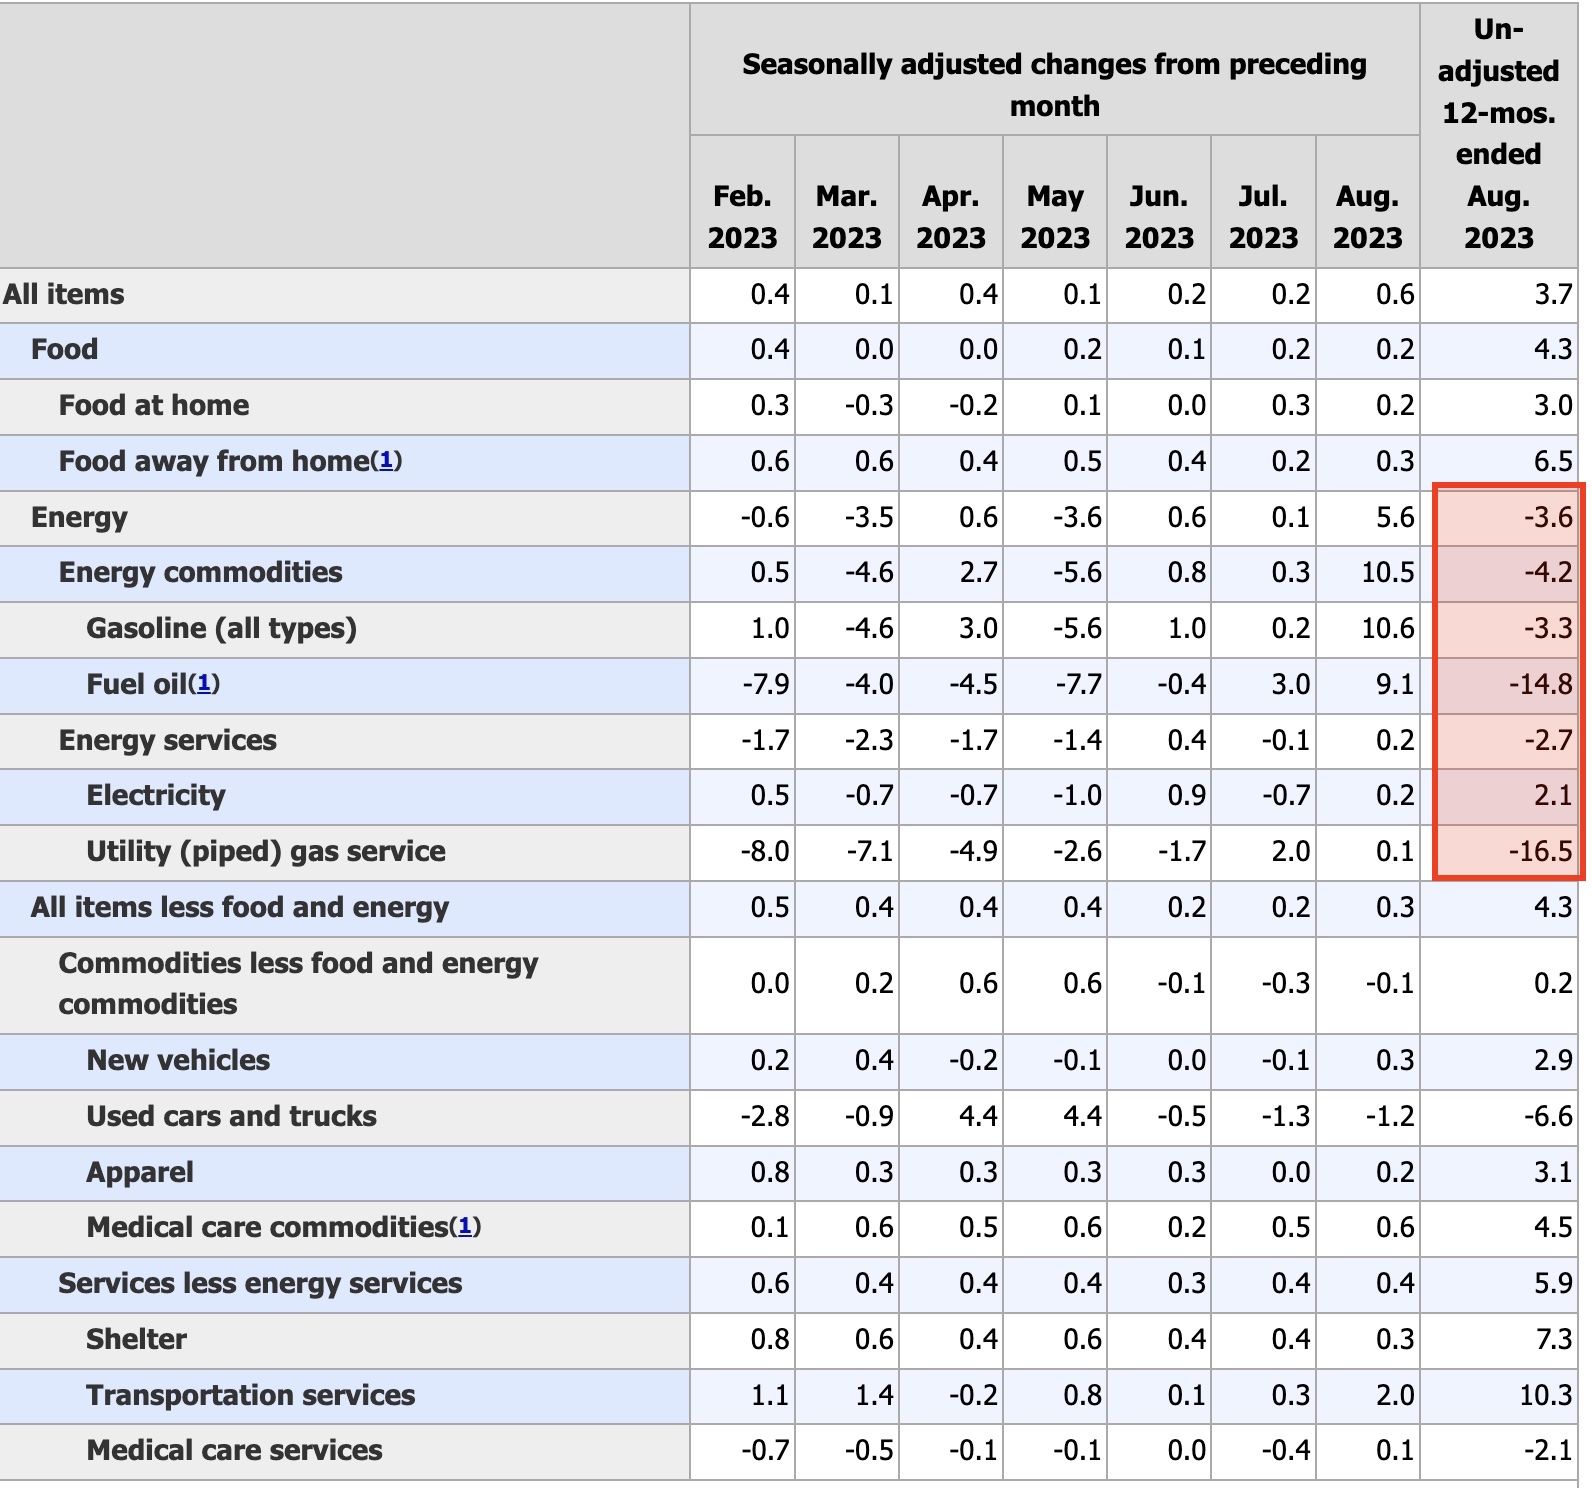
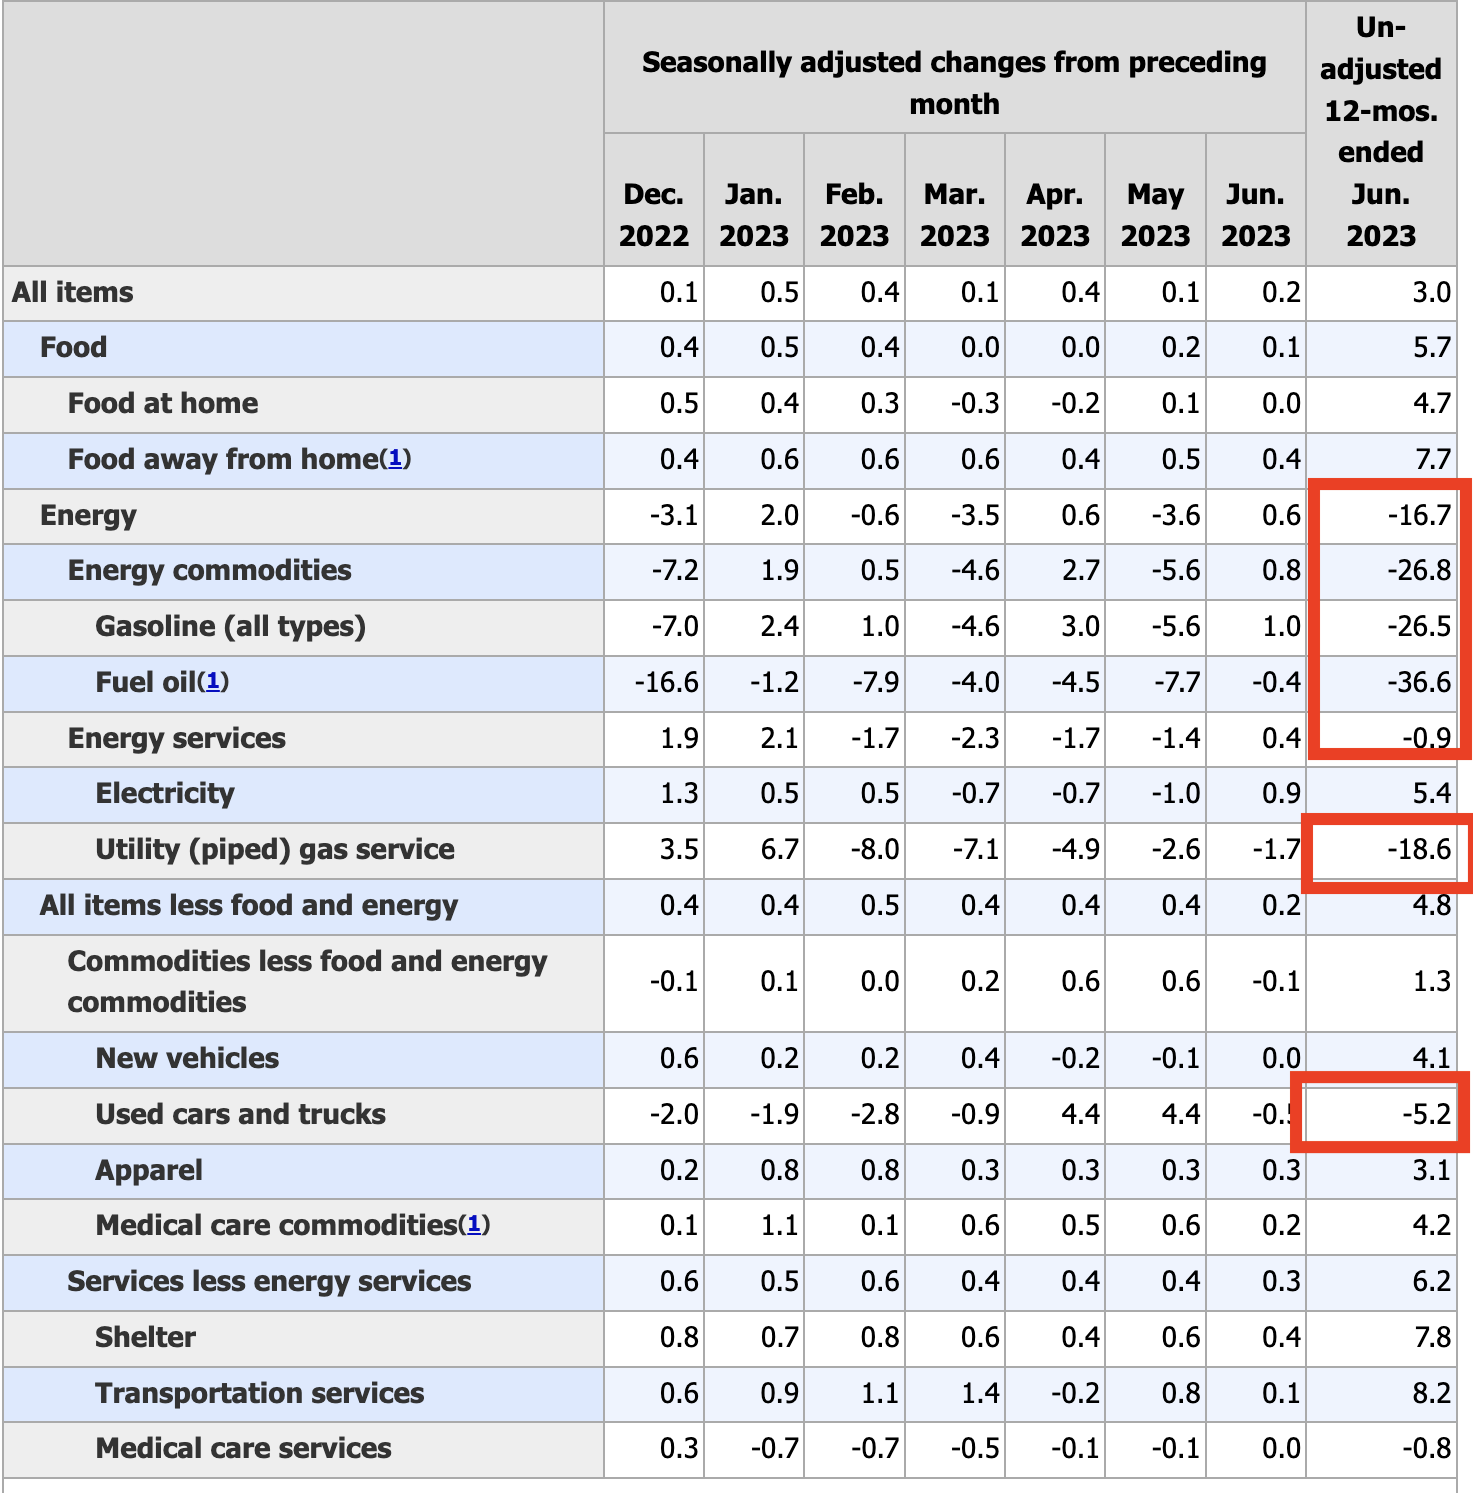
By quick way of review, the Fed stopped raising interest rates in July 2023. It then started talking about cutting interest rates in November. And it did this despite the clear evidence that Energy prices were the only part of the inflation data that had turned negative. Put another way, every other segment of the inflation data was still rising… albeit at a slower pace.
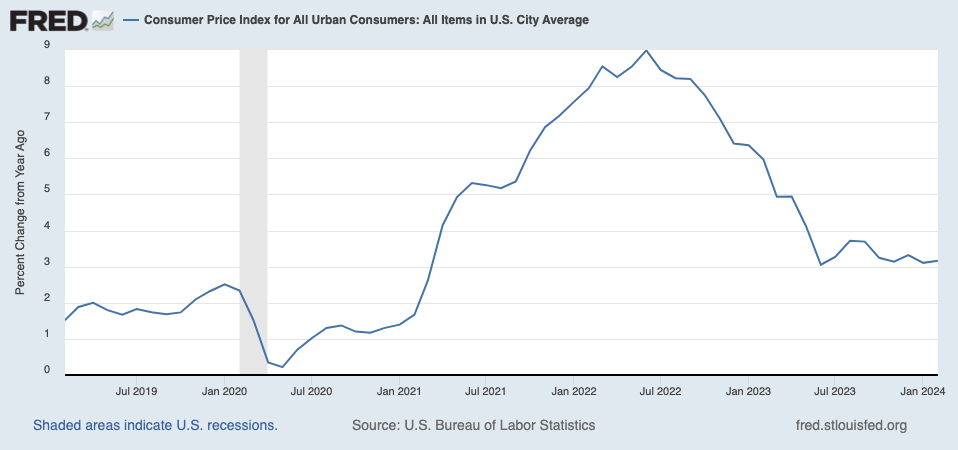
Fast forward to today, and the official inflation measure, the Consumer Price Index or CPI for short has bottomed and is beginning to rebound.
With inflation doing this, there is NO WAY the Fed can cut rates three times this year. The bond market has realized this and is now discounting maybe one rate cut of 0.25% this year.
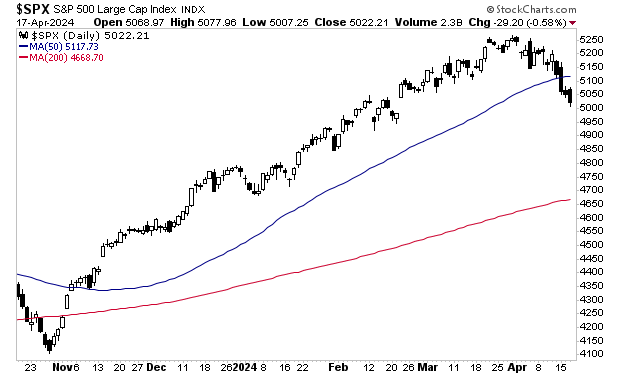
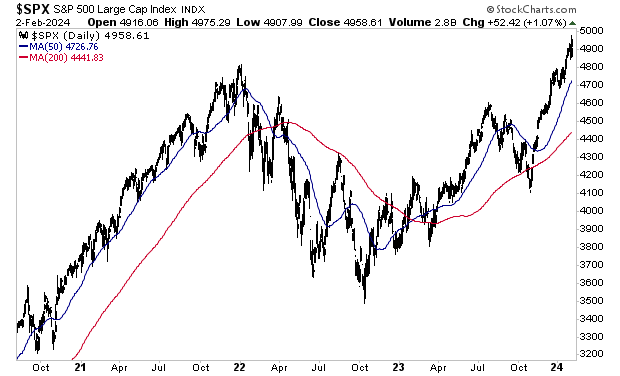
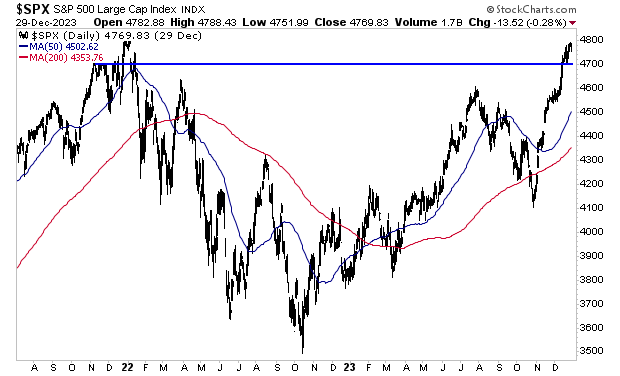
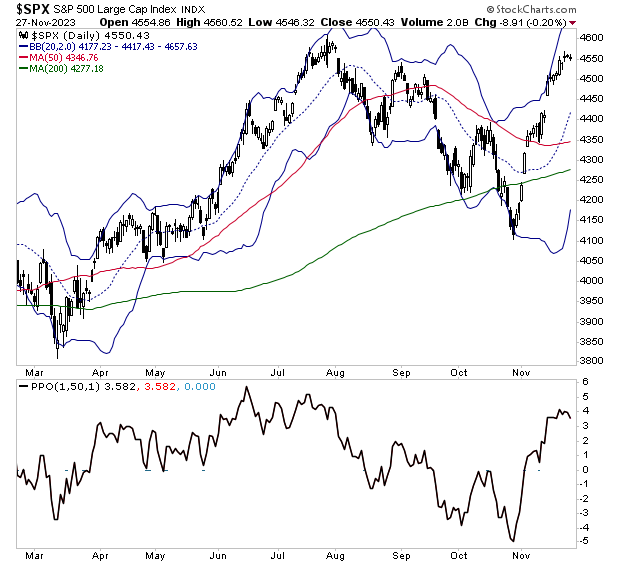
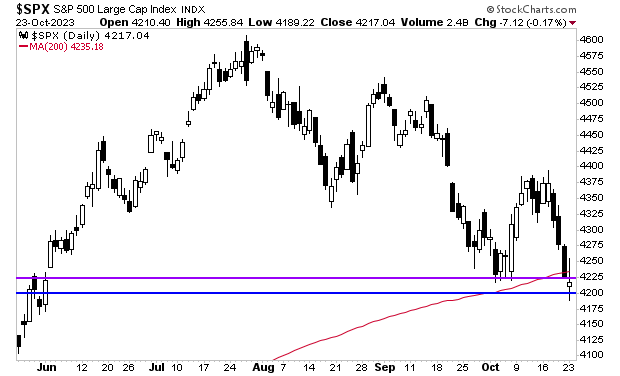
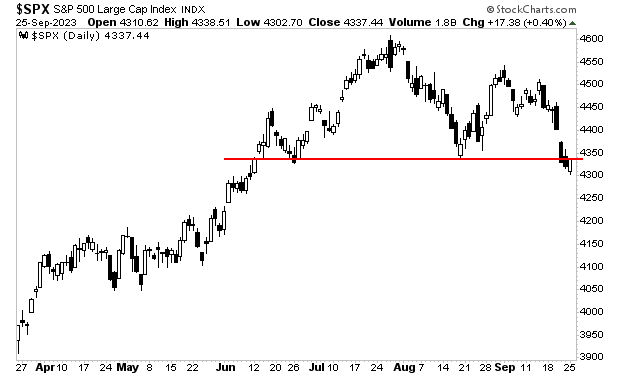
Stocks didn’t like that. The S&P 500 has now dropped 4% and is below its 50-day moving average (DMA) for the first time since November 2023.
Bottomline: this move was entirely predictable, and those investors who were prepared for it are seeing EXTRAORDINARY returns in their portfolios.
On that note, we recently published a Special Investment Report detailing three investments that will profit from this rampant government spending. Normally this report would cost $499, but we are giving copies FREE to anyone who joins our daily market commentary.
I warned time and again that the Fed was making a massive policy mistake that would unleash another round of inflation.
By quick way of review, the Fed stopped raising interest rates in July 2023. It then started talking about cutting interest rates in November. This was a MASSIVE mistake as inflation has NOT been defeated.
Indeed, ever since the Fed started talking about cutting rates, the official inflation measure, the Consumer Price Index (CPI) has bottomed and is now turning back up.
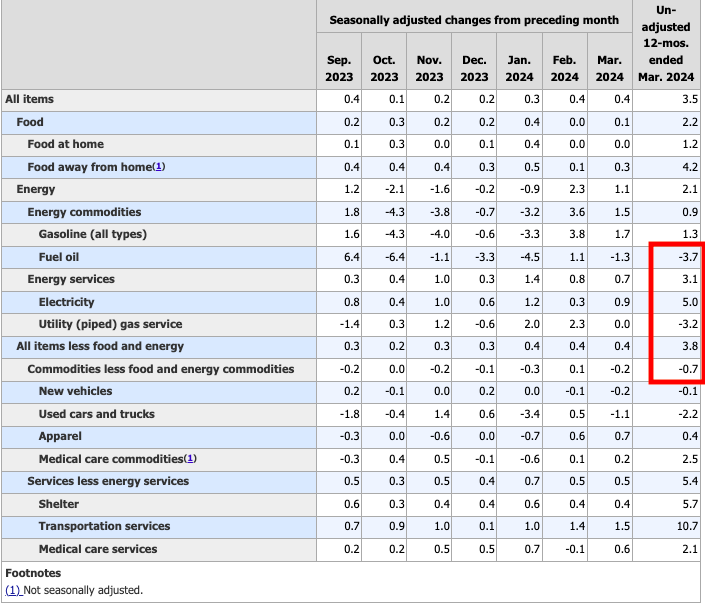
This trend continues. Yesterday, the Bureau of Labor Statistics (BLS) revealed that CPI rose 0.4% Month-over-Month (MoM) and 3.5% Year-over-Year (YoY) in March 2024.
This represents the FOURTH straight month of CPI coming in hotter than expected. The fact it surprised Wall Street and most investment strategists confirms that NONE of these people are paying attention to the data.
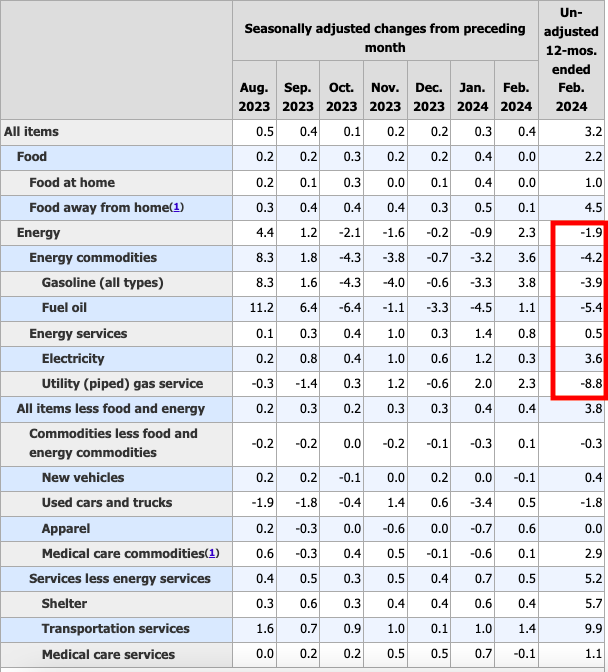
The only part of the inflation data that is down is energy prices (and used cars which receives almost no weight). Every other segment of the CPI continues to rise.
See for yourself:
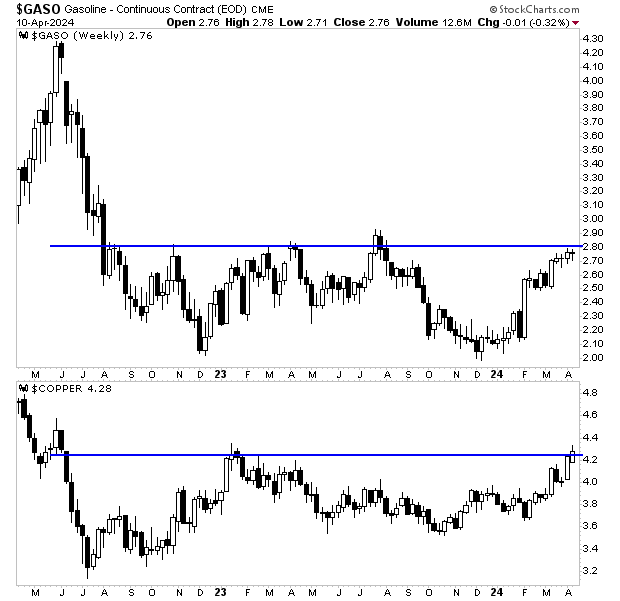
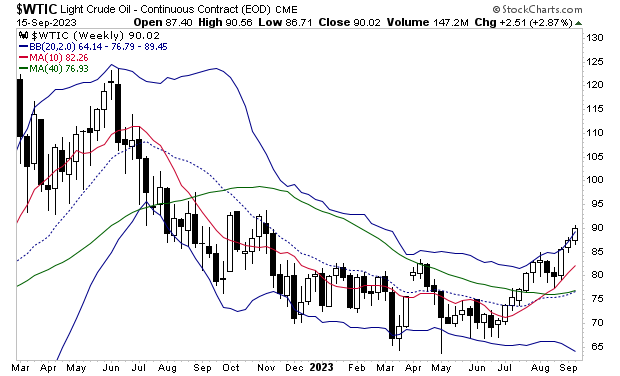
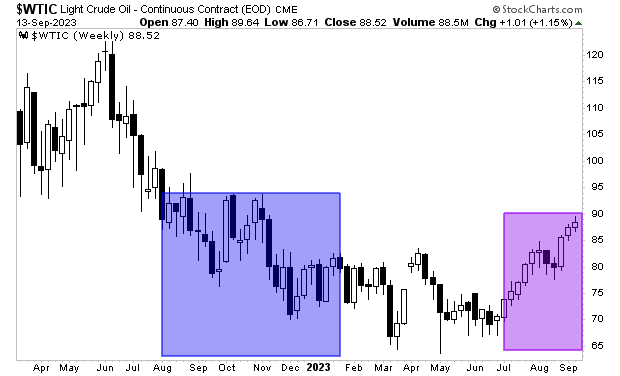
However, even Energy prices will begin turning up again… as are commodities in general. Both gasoline prices and copper prices are on the rise and about to break out of multi-year consolidation periods.
This is going to catch most investors offsides… but the good news is that with the right investments, you could see EXTRAORDINARY returns from what’s coming.
On that note, we recently published a Special Investment Report detailing three investments that will profit from this rampant government spending. Normally this report would cost $499, but we are giving copies FREE to anyone who joins our daily market commentary.
Over the last week, we’ve warned investors that the Fed’s actions are unleashing another round of inflation in the U.S. financial system.
By quick way of review.
The only part of the inflation data that is declining year over year is Energy prices. Every other segment of the Consumer Price Index (CPI) continues to rise.
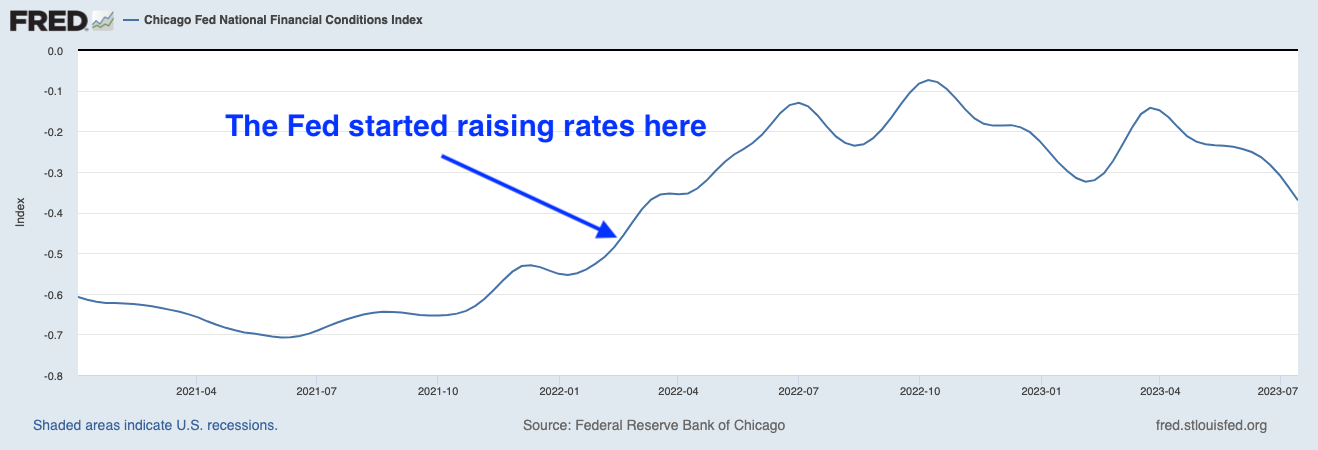
Financial conditions are as loose today as they were when the Fed first started raising interest rates in March 2022. And yet, the Fed is preparing to cut rates instead of raising them.
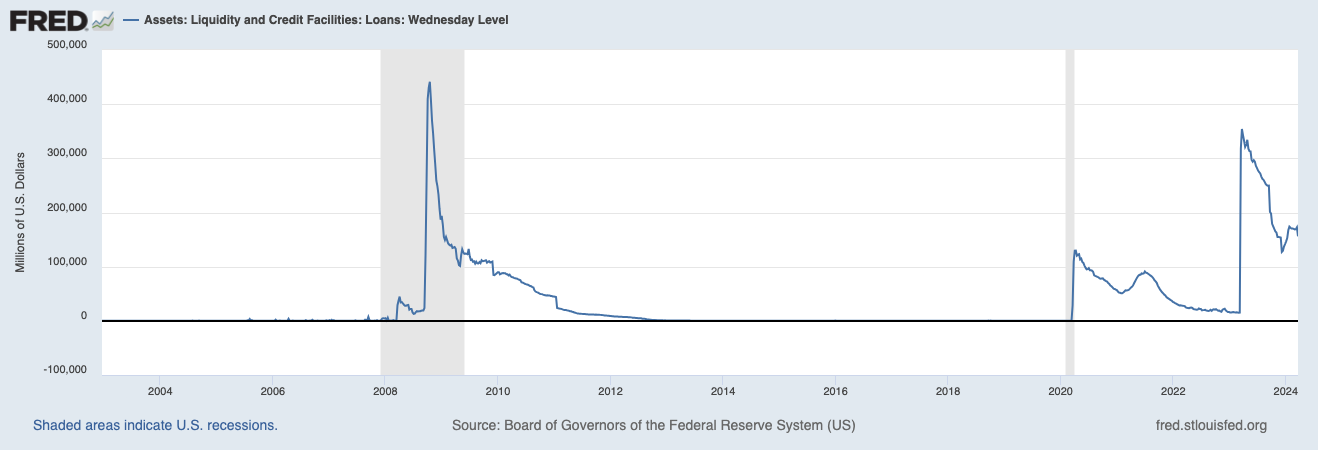
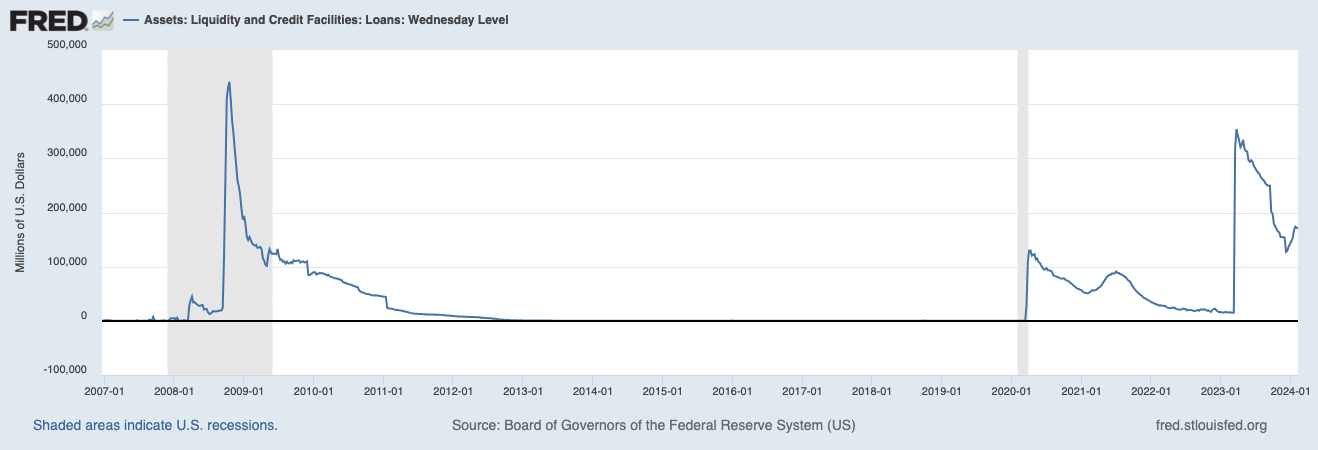
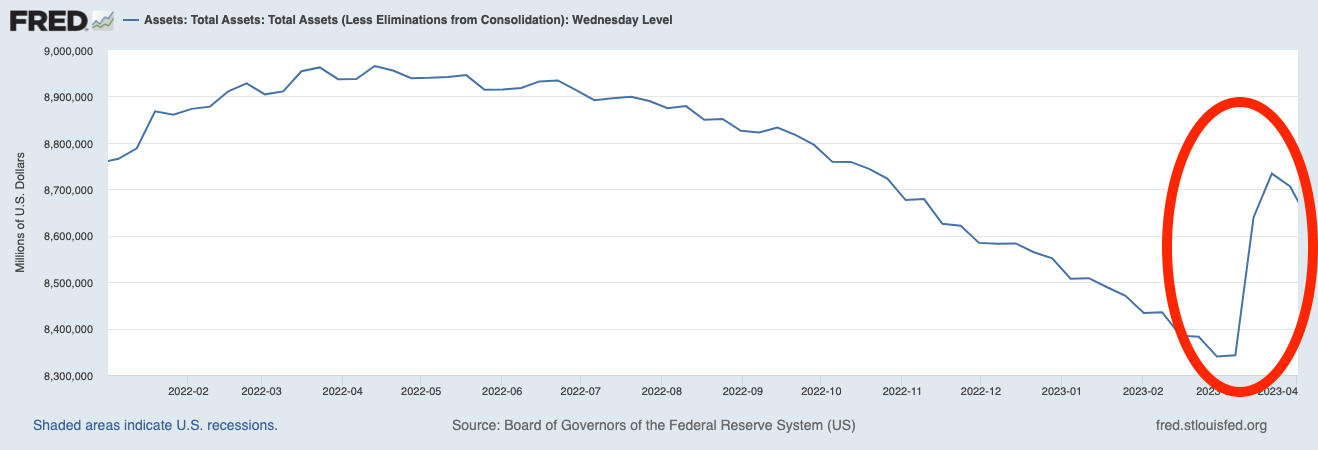
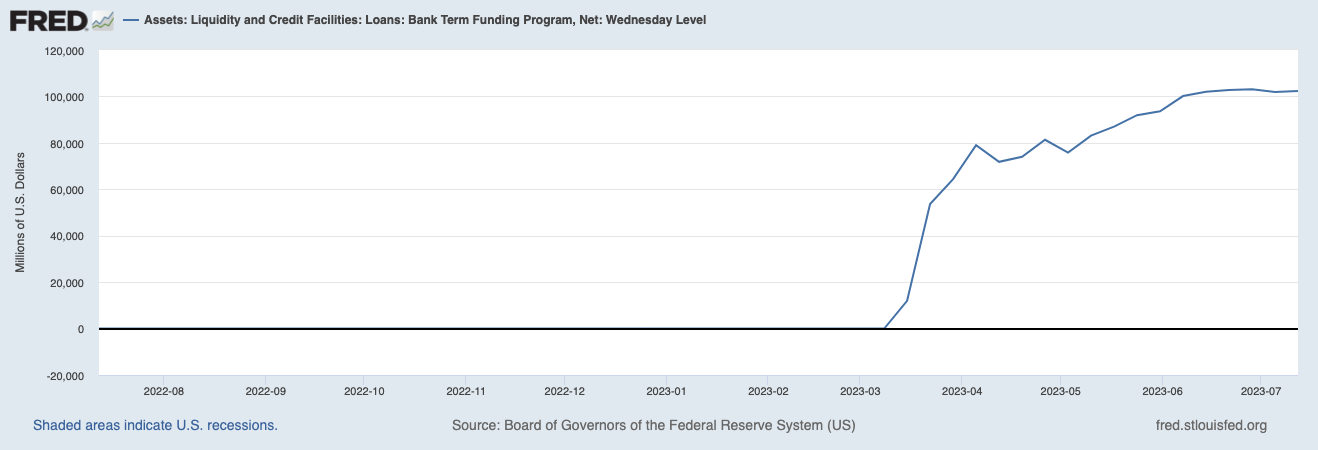
The Fed is still providing hundreds of billions of dollars in liquidity to the financial system via credit facilities.
The Fed’s own research indicates that food inflation is the best predictor of future inflation. And agricultural commodities are skyrocketing to new highs.
Unfortunately for Americans, the Fed isn’t the only entity that is engaged in inflationary policies. The Biden administration is currently engaged in truly extraordinary levels of money printing.
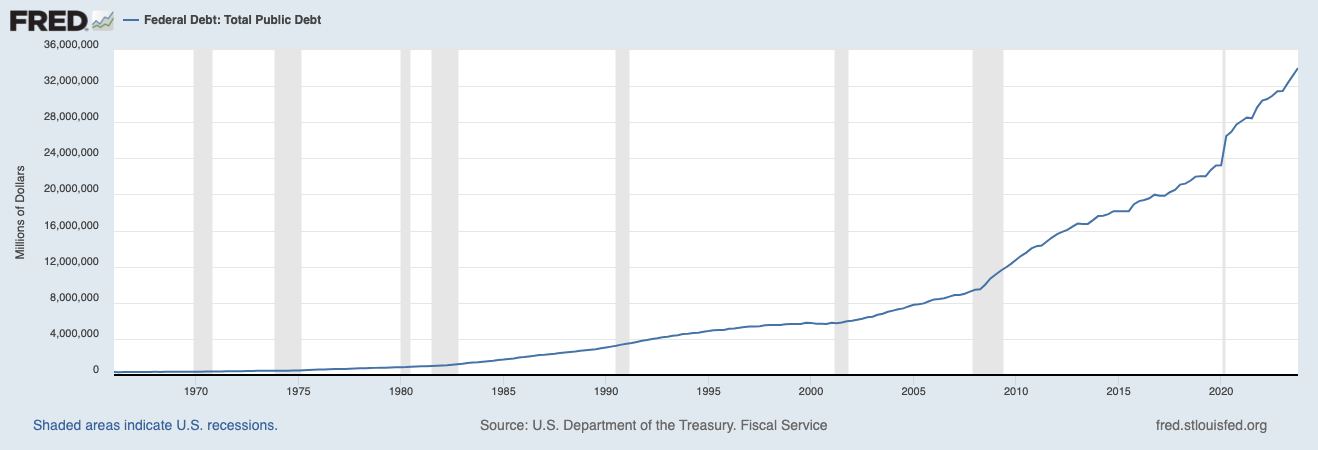
The Biden administration has added $6 trillion to the national debt since taking office. Bear in mind, this is happening at a time when the U.S. is collecting a record amount in taxes. So, the Biden administration is not only spending all of the tax dollars collected, it’s spending so much money that the U.S. is having to issue record amounts of debt!
The below chart needs no explanation. This is simply not sustainable.
Indeed, the pace of debt issuance is speeding up not slowing. The Biden admin issued $3 trillion in new debt in between 2021 and 2023. It added another $4 trillion in new debt in 2023 alone. At this pace. the U.S. will hit $40 trillion in debt some time in mid-2025.
Indeed, the pace of debt issuance is speeding up not slowing. The Biden admin issued $3 trillion in new debt in between 2021 and 2023. It added another $4 trillion in new debt in 2023 alone. At this pace. the U.S. will hit $40 trillion in debt some time in mid-2025.
The good news is that those investors who are properly positioned for this stand to generate truly EXTRAORDINARY returns in the coming months.
On that note, we recently published a Special Investment Report detailing three investments that will profit from this rampant government spending. Normally this report would cost $499, but we are giving copies FREE to anyone who joins our daily market commentary.
As I keep emphasizing, another round of inflation is coming.
And the worst part?
The Fed knows it, but is playing political games to boost the economy/ stock market for the Biden Administration.
“But wait a minute, Graham,” you’re no doubt thinking, “the Fed’s preferred inflation measure is core-Personal Consumption Expenditures and that is trending down to the Fed’s 2% target.”
Let me let you in on a little secret… PCE is a terrible predictor of future inflation… and the Fed knows it.
The Fed is the largest employer of economics PhDs in the world. All told, the Fed has over 400 economics PhDs and 150 research assistants on payroll. As a result of this, the Fed is constantly doing research on various issues.
Back in 2001, the Fed had several researchers dive into the subject of inflation. Their goal was the analyze whether the Fed’s preferred measures of inflation (the CPI and the Personal Consumption Expenditures or PCE) are decent predictors of future inflation. The Fed also investigated a whole slew of other inflation measures for comparison purposes.
The results?
The Fed found that food inflation, NOT CPI or PCE, is the best predictor of future inflation. Fed researchers wrote the following:
We see that past inflation in food prices has been a better forecaster of future inflation than has the popular core measure [CPI and PCE]…Comparing the past year’s inflation in food prices to the prices of other components that comprise the PCEPI (as in Table 1), we find that the food component still ranks the best among them all…
Source: St Louis Fed (emphasis added).
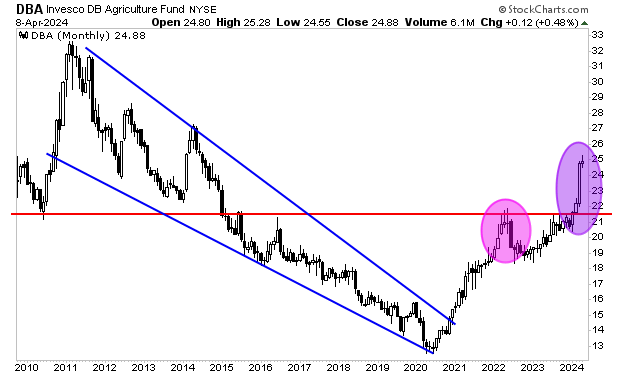
Now, food is derived from agricultural commodities. And what have agricultural commodities been doing in the last few months?
The first round of inflation is highlighted with a pink oval. The current price move is significantly larger. According to the Fed’s own research, this indicates a second wave of inflation is about to hit the US.
The good news is that those investors who are properly positioned for this stand to generate truly EXTRAORDINARY returns in the coming months.
On that note, the FREE copies of our Special Investment Report detailing three investments that will profit from the next round of inflation are rapidly being reserved. So if you want reserve one, you better move fast!
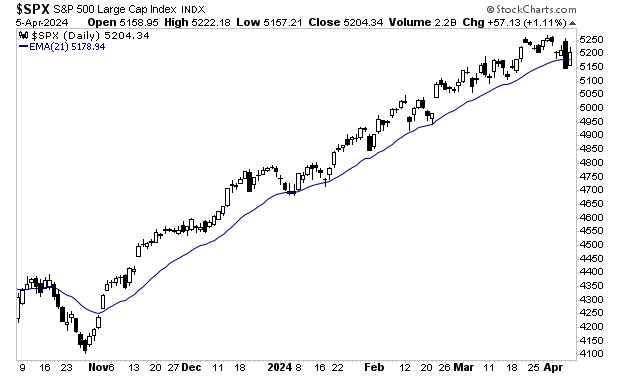
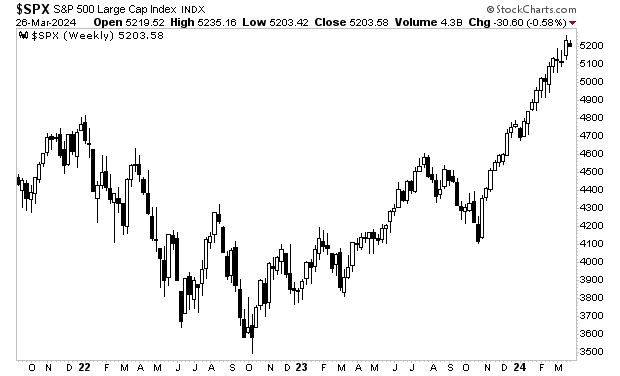
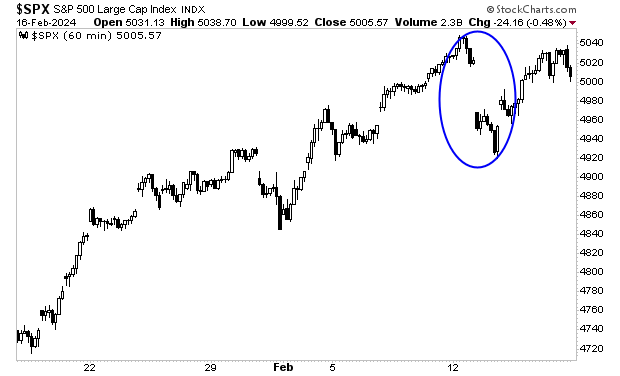
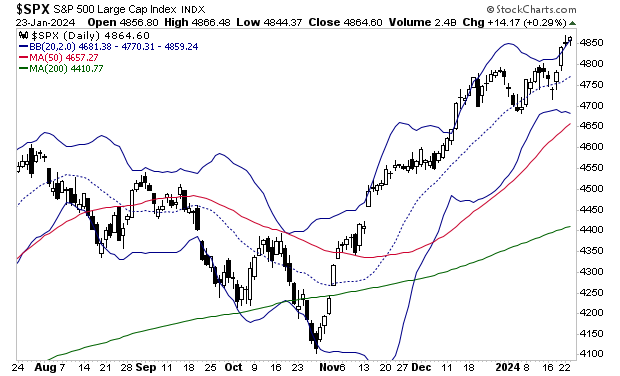
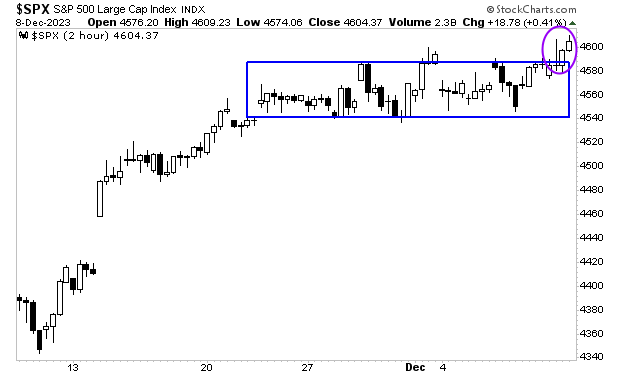
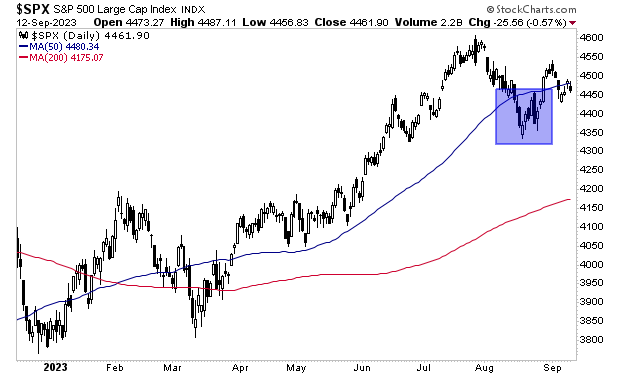
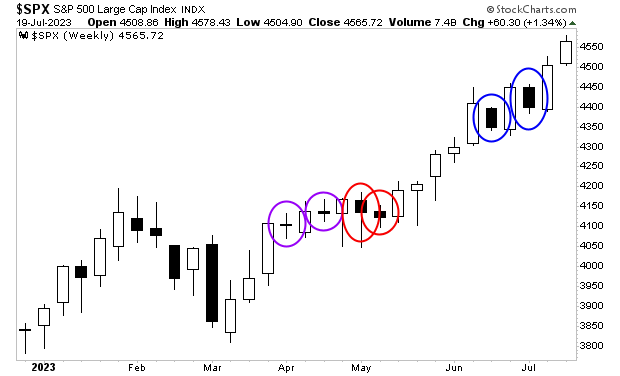
Ever since the S&P 500 bottomed in late October/ early November 2023, the 21-day exponential moving average (EMA) has served a major “trend line.” Put simply, whenever stocks fell to test this line, they “bounced” soon after and the rally continued.
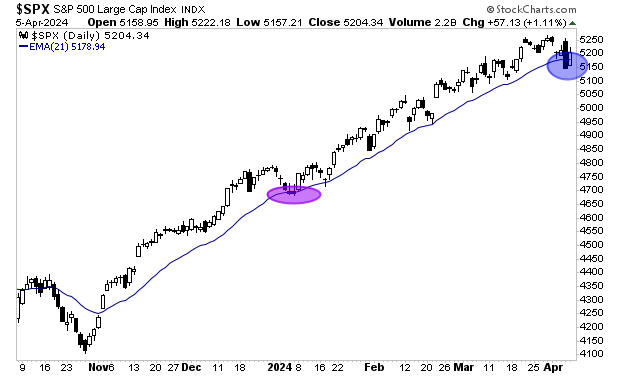
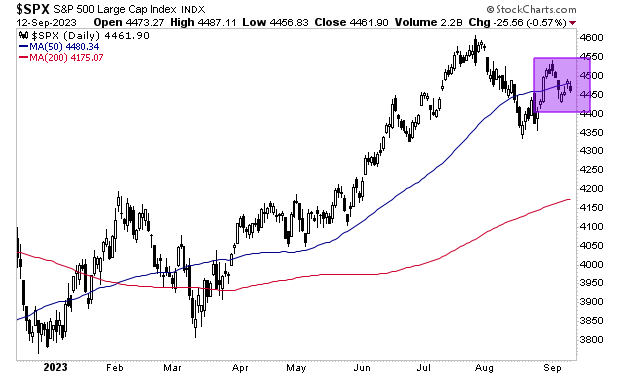
Last week’s price action featured a different dynamic. Stocks fell to test the 21-EMA and struggled to reclaim it for two sessions (blue oval in the chart below). The only other time this happened was during the brief market pullback in early January 2024. At that time, the market rebounded sharply on the third trading session (purple oval in the chart below).
In this context, today’s price action is key. If the S&P 500 rallies hard and reclaims the 21-EMA, then it’s likely stocks will rally to new highs. However, if stocks cannot reclaim the 21-EMA with conviction today, then we’re likely to see more downside for stocks.
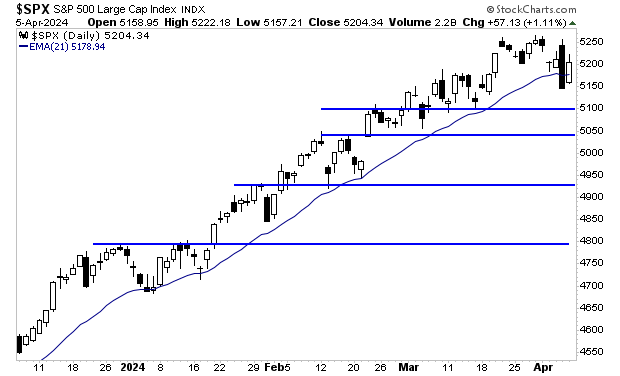
I’ve illustrated the S&P 500’s support lines in the chart below.
If you’re interested in taking advantage of a unique situation in the stock market today, the FREE copies of our Special Investment Report detailing three investments that can profit from inflation are rapidly being reserved. So if you want reserve one, you better move fast!
Our latest theme is that the U.S. Central Bank, called the Federal Reserve, or the Fed for short, is NOT politically independent, but is in fact a highly partisan organization that leans left.
The above items are not some conspiracy theory. The Fed’s own actions support this view.
By quick way of review…
1) The Bernanke-led Fed launched QE 3 just three months before the 2012 Presidential election. At the time, the economy was growing, unemployment was falling, and there were no signs of systemic duress in the financial system. So this was a clear intervention to aid the Obama Administration’s 2012 re-election bid.
2) The Fed kept rates at zero for seven of the eight years President Obama was in office. Once it finally got around to raising rates, it engaged in one of the feeblest hiking schedules in history, raising them only once in 2015
and once in 2016.
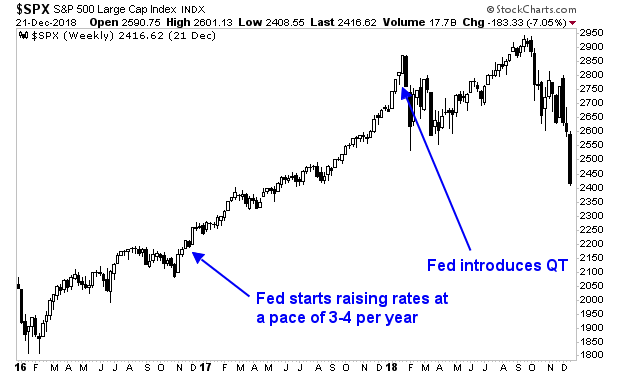
3) Donald Trump won the 2016 Presidential election in a major upset to the political establishment. At that point the Fed suddenly began raising rates three to four times per year while simultaneously draining $500 billion in liquidity from the financial system.
4) Today, the Fed is actively juicing the stock market via multiple credit facilities designed to provide liquidity to help the Biden administration with its re-election bid. The Fed is also promising to cut rates despite the fact it’s an election year and inflation has not fallen to its 2% target.
I wish this was the end of this disturbing exercise, but it’s not: the Fed is also letting housing bubble up again. The reason? You guessed it, real estate is the single most owned asset class in the U.S. And boosting home prices during an election year is likely to sway voters.
TheS&P CoreLogic Case-Shiller U.S. National Home Price Index rose 6% in January. This is up from 5.6% in December 2023. As HousingWire notes, this represents the seventh consecutive month of annual price growth. It’s also the biggest increase since November 2022.
By the way, inflation was around 6% at that time!
So we’ve got both real estate and stocks bubbling up again, courtesy of the Fed playing political games. In the near-term this is fantastic for Americans, who will see their net worth rise as a result of this.
The bad news is that there’s no such thing as a free lunch. And the Fed’s political shenanigans are unleashing a second wave of inflation.
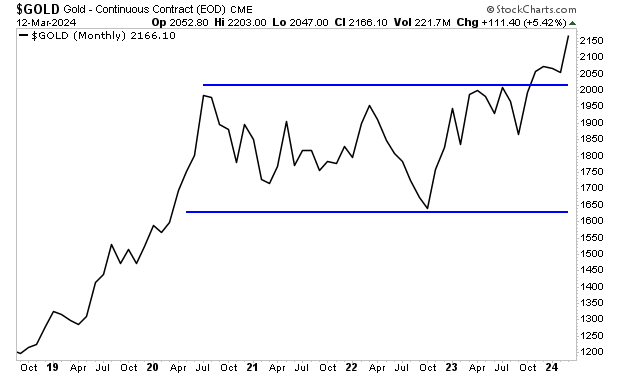
Gold has figured it out. It recently exploded to new all-time highs.
The good news is that those investors who are properly positioned for this stand to generate truly EXTRAORDINARY returns in the coming months.
On that note, the FREE copies of our Special Investment Report detailing three investments that will profit from the next round of inflation are rapidly being reserved. So if you want reserve one, you better move fast!
Yesterday, I detailed how the Fed is a political entity… and it leans left.
By quick way of review…
1) The Bernanke-led Fed launched QE 3 just three months before the 2012 Presidential election. At the time, the economy was growing, unemployment was falling, and there were no signs of systemic duress in the financial system. So this was a clear intervention to aid the Obama Administration’s 2012 re-election bid.
2) The Fed kept rates at zero for seven of the eight years President Obama was in office. Once it finally got around to raising rates, it engaged in one of the feeblest hiking schedules in history, raising them only once in 2015
and once in 2016.
3) Donald Trump won the 2016 Presidential election in a major upset to the political establishment. At that point the Fed suddenly began raising rates three to four times per year while simultaneously draining $500 billion in liquidity from the financial system.
It is possible that the above items are all coincidence. It’s also possible that Bigfoot could actually be Elvis living in disguise in the woods.
So what is the Fed up to now?
It’s trying to help President Biden win the 2024 Presidential election by juicing the two asset classes that have the largest impact on Americans’ net worth (stocks and housing ).
Today we’ll be assessing the stock market.
The Fed is supposed to be draining liquidity from the financial system via its Quantitive Tightening (QT) program. However, the Fed is ALSO providing $155 BILLION in liquidity via its overnight credit facilities. To put that into perspective, it’s more liquidity than the Fed was providing via this facility in MARCH 2009 right after the worst financial crisis in 80 years!
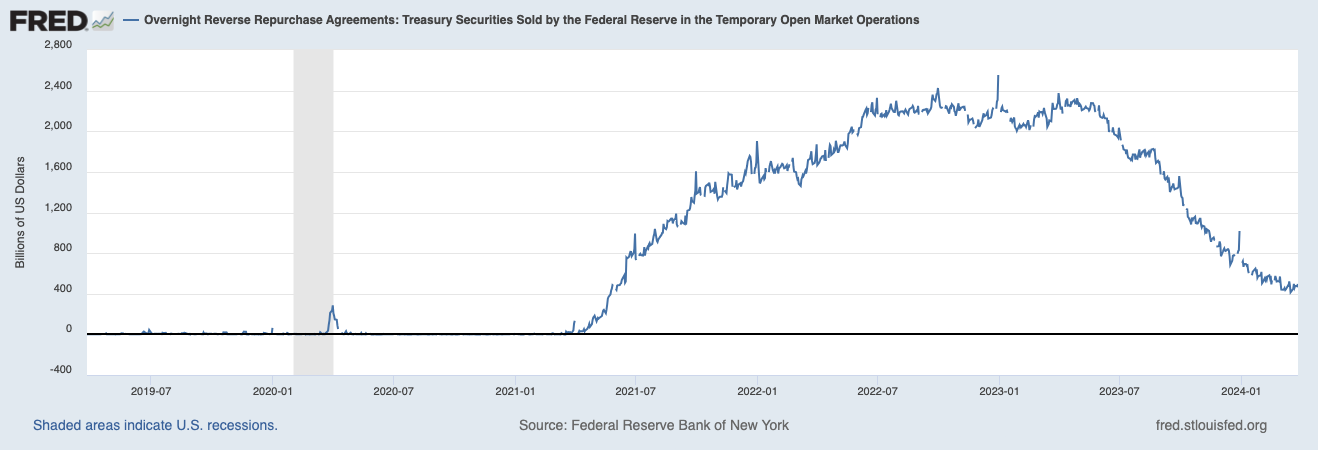
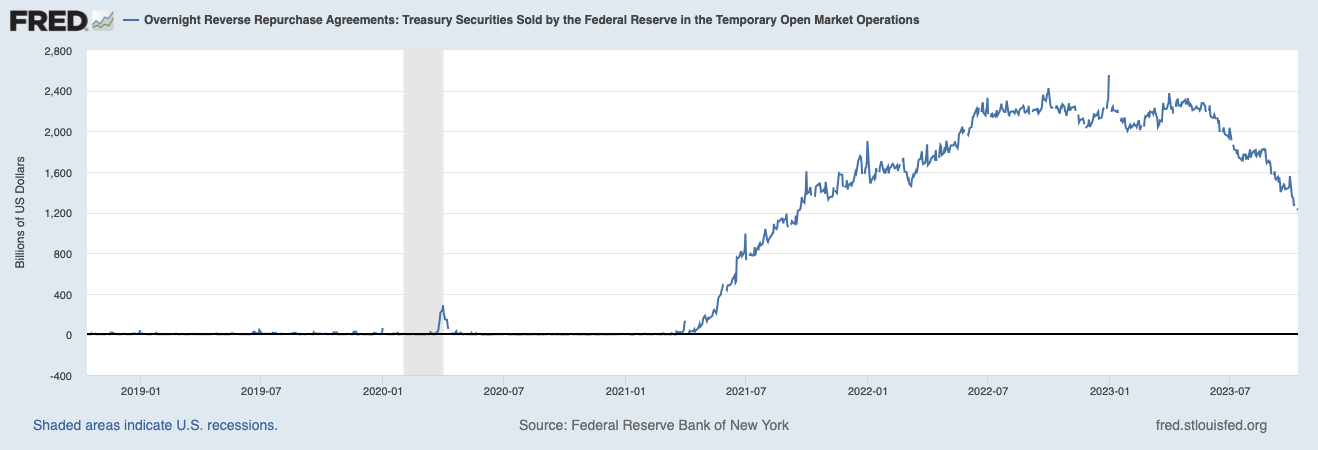
As if that’s not egregious enough, the Fed is ALSO providing nearly $500 billion in liquidity via a process called Reverse Repurchase Agreements.
Small wonder then that the stock market has been roaring higher. The Fed is providing EMERGENCY levels of liquidity to the financial system at a time when the economy is growing! So much for QT!
In the very simplest of terms, the Fed is juicing stocks higher to boost the Biden Administration’s 2024 re-election bid. And rest assured, I’ll detail how the Fed is doing the same thing with housing in tomorrow’s article.
The good news is that those investors who are properly positioned for this stand to see extraordinary gains.
On that note, the FREE copies of our Special Investment Report detailing three investments that will profit from the next round of inflation are rapidly being reserved. So if you want reserve one, you better move fast!
It’s time to tell the truth when it comes to Fed political interventions.
One of the biggest myths concerning the Fed is that it is politically independent. This is laughably false to anyone who has paid attention during the last 25 years.
Consider that in 2012, the Bernanke-led Fed announced QE 3, its largest QE program in history at the time (an $80 billion per month, open-ended program), a mere THREE MONTHS before the U.S. Presidential election.
Bear in mind, the U.S. economy was growing and the U.S. financial system wasn’t under significant duress at the time. So this was blatant political interference to aid the Obama Administration’s re-election bid by boosting the stock market and economy.
A second major example of Fed political bias concerns its major shift in monetary policy once Donald Trump became President. To fully grasp this, we need to provide a little historical context.
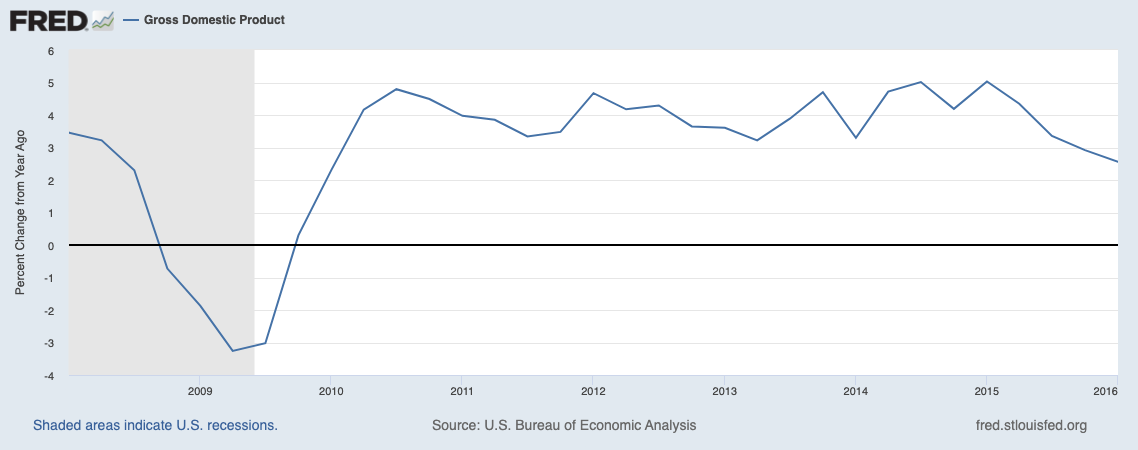
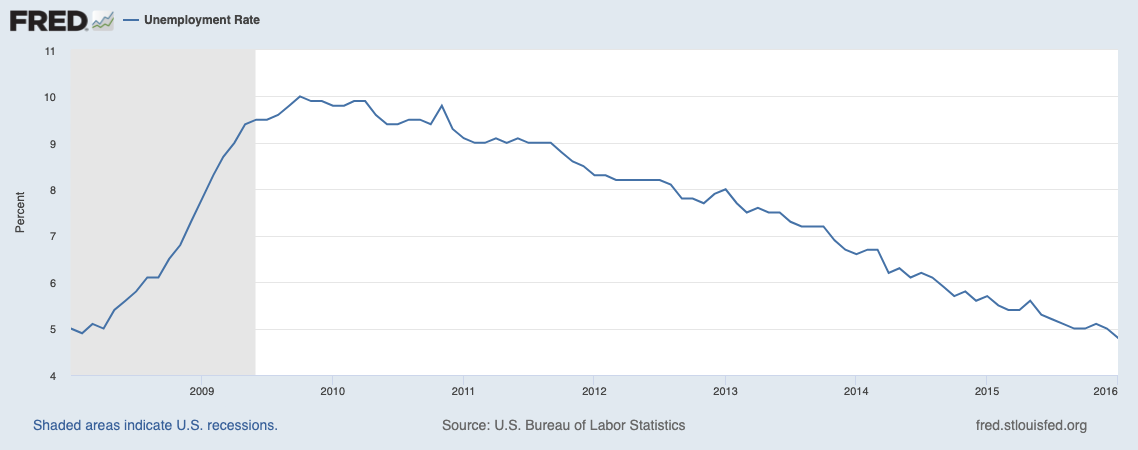
Between 2008 and 2016, the Fed engaged in eight years of extraordinary monetary easing, maintaining interest rates of 0.25% (zero), and engaging in over $3 trillion worth of QE from 2008 to 2015. Bear in mind that throughout this time, the U.S. economy was technically NOT in recession. Economic growth was steady:
And the unemployment rate was in a clear downtrend:
Once the Fed actually ended easing, it embarked on one of the feeblest campaigns of tightening monetary policy in history, raising rates only one time in 2015 and 2016. I would note that all of this took place under the Obama administration.
Then Donald Trump won the 2016 Presidential election, and suddenly the Fed “got religion” about normalizing monetary policy. It raised rates three times in 2017 and another four times in 2018. In 2018 it also began shrinking its balance sheet via a process called Quantitative Tightening or QT. It would ultimately drain $500 billion in liquidity from the financial system via QT in 12 months. That is quite a shift considering the Fed had maintained rates at or close to ZERO for eight years prior to this.
Throughout 2016-2018, the Fed ignored numerous signals that this pace of tightening was placing the financial system under duress, right up until the junk bond market froze and the U.S. stock market crashed 20% during the holidays in December 2018.
For those who would argue that the Fed’s sudden shift from maintaining easy monetary policy for the better part of a decade to aggressively normalizing policy in the span of 20 months had nothing to do with Donald Trump being President, consider that former Fed Vice Chair Stanley Fisher admitted in an interview that the Fed’s raising rates in December 2018 was done specifically to hurt the economy because the Fed was annoyed with President Trump’s constant tweeting about them.
So again… the Fed IS a political entity… and it leans LEFT.
I’ll detail what this means investors as we head into the 2024 President election in tomorrow’s article. But for now, gold is giving us a clue.
The good news is that those investors who are properly positioned for this stand to see extraordinary gains.
On that note, the FREE copies of our Special Investment Report detailing three investments that will profit from the next round of inflation are rapidly being reserved. So if you want reserve one, you better move fast!
Last week, the Fed confirmed that it intends to cut rates three times this year, despite the fact inflation is NOT near its target of 2% and is in fact turning back up.
If you’re scratching your head on this, there’s a very simple answer:
It’s an election year. And the Powell Fed is stacked with political hacks.
It is clear that the Powell Fed is full committed to aiding the Biden administration in its re-election bid. After all, why else would the Fed talk about triggering an easing cycle when:
1) The stock market is at all-time highs.
2) Financial conditions are looser now than they were BEFORE the Fed starting raising rates in 2022.
3) The economy is growing, NOT slowing down.
4) Inflation is turning back up.
These are the sorts of conditions in which the Fed usually RAISES rates. Instead, the Fed is going to start cutting rates AND reducing the pace of its Quantitative Tightening (QT) program.
Both of those are HIGHLY inflationary.
In this context, it is clear the Fed has become a political entity. There is no credible economic/ financial reason for the Fed to commit to these policies. At the very least, the Fed should remove one rate cut from its forecast for 2024.
Instead, it is clear that the Fed is committed to pushing stocks and housing as high as possible going into the 2024 Presidential election. This will be a boon for Americans in the short-term, but the consequences will be devastating in the coming months as inflation eviscerates incomes and investment portfolios.
The good news is that those investors who are properly positioned for this stand to see extraordinary gains.
On that note, the FREE copies of our Special Investment Report detailing three investments that will profit from the next round of inflation are rapidly being reserved. So if you want reserve one, you better move fast!
I’ve previously explained in great detail that the official inflation measure, the Consumer Price Index or CPI, is massaged to the point of being a work of fiction.
Among the more egregious gimmicks employed by the BLS:
Data collection consists of surveys with low response rates.
Those being surveyed are asked to remember what they paid for goods and services (as if anyone keeps an excel spreadsheet of that stuff).
The CPI doesn’t consider food or energy prices.
The CPI doesn’t use real world measures for shelter, instead relying on carefully crafted artificial metrics that have no connection to reality.
And so on.
However, if you’re looking for one simple explanation that the CPI is fiction, you need look no further than the Biden administration’s poll numbers.
President Biden is an historically unpopular President. This is truly astonishing when you consider that his opponent for the 2024 election (former President Trump) is one of the most polarizing and unappealing candidates in history.
Why are Biden’s polls so bad?
Inflation.
Americans vote based on many factors, but ultimately, they tend to vote with their pocket books. And inflation is a MAJOR problem for the bottom four quintiles (lower 80%) of Americans based on net worth/ income.
The media shills and hacks like to argue that Biden is unpopular because Americans are “wrong” or “misguided” due to “disinformation.” But we have to remember that these are the same people who told us inflation was “transitory” for most of 2021 and 2022. Their track record is truly abysmal when it comes to accurately assessing reality.
Bottomline: inflation has NOT come down, no matter what the BLS and media tell you. And those investors who don’t prepare for what’s coming are in for a world of hurt.
I’ll detail what this means for the markets in tomorrow’s article.
If you’ve yet to position your portfolio to profit a resurgence in inflation, we just published a Special Investment Report outlining the clear signals that inflation is back as well as THREE unique investments that could EXPLODE higher as inflation takes hold of the financial system later in 2024.
This report went live just four days ago. And already two of these investments are up.
The Fed is screwing up… again. And investors who don’t prepare for what’s coming are in for a NASTY surprise in the coming months.
To understand what I mean by this, let me provide some context.
Starting in November of 2023, Fed officials began proclaiming that inflation had been tamed. The argument, at the time, was that inflation data was clearly trending down, while rates were much higher, so the Fed would need to start cutting rates soon to avoid crushing the economy.
I realize this is difficult to picture, so I’ve included the below image for you. The Fed Funds Rate is the red line. The official inflation measure, the Consumer Price Index, or CPI for short, is the blue line. As you can see, starting in mid-2023, the red line was much higher than the blue line.
During the last 25 years, any time the Fed Funds Rate has been much higher than inflation for long, something BAD has happened (a recession or crisis). I’ve illustrated this on the below chart with red rectangles.
This is why the Fed started talking about cutting interest rates in November 2023, despite the fact inflation was still well above 3%, while the Fed’s target for inflation was 2%. In the very simplest of terms, the Fed was “betting” that inflation would continue to trend down, therefore giving the Fed the excuse to cut rates.
However, since that time, the CPI has stopped declining as rapidly. The trend, while still down, isn’t nearly as strong.
Indeed, the situation looks much uglier when we include food and energy prices to inflation. As I noted in yesterday’s article, the ONLY reason inflation appears to have declined as much as it has is because energy prices have collapsed year over year. Once you include energy data in the inflation measure, things look like this:
Put simply, the Fed has screwed up… again. The Fed promised it would cut rates base on an assumption that has proven false. This opens the door to a serious upset for the markets in the coming weeks.
If you’ve yet to take action to profit a resurgence in inflation, we just published a Special Investment Report outlining the clear signals that inflation is back as well as THREE unique investments that could EXPLODE higher as inflation takes hold of the financial system later in 2024.
Throughout 2023, I warned that inflation was not really disappearing from the financial system. Time and again I noted that the ONLY data in the inflation measure that had declined was energy prices.
This trend continues to this day, by the way. See for yourself.
Take out energy prices (and used cars) and the inflationary data is still RISING in every category.
And things are going to get worse soon.
Why?
Energy prices will soon no longer be DOWN year over year. For 12 months, the CPI has been calculated by comparing the prices in the blue rectangle to prices in the purple rectangle. However, in 2024, prices will be compared to the blue rectangle for inflation calculations.
We’ve now had two months of the CPI surprising to the upside. And this is while Energy prices are HELPING the inflation data. What happens when Energy is no longer down on a year over year basis?
Hint: gold has already figured it out. Other asset classes will soon.
If you’ve yet to take action to profit a resurgence in inflation, we just published a Special Investment Report concerning THREE investments you can use to make inflation pay you as it rips through the financial system in the months ahead.
The report is titled How to Profit from Inflation: Three Investments to Make Money”. And it explains in very simply terms how to make inflation PAY YOU.
We’re picking up where we left off our A Deep Dive Into What AI Means For Corporate America investment series. If you missed the first two parts from this series, you can access them hereandhere.
By brief way of review:
Artificial Intelligence (AI) is the dominant theme in the investing world today.
Currently AI is capable of accessing vast swathes of available information and integrating it in such a way that AI appears to be creating something from scratch.
Current AI models are being deployed in practically every sector of the economy from entertainment to marketing, operations and more.
While the areas of the economy that AI is impacting are different, the implications are all the same:
Improving productivity (getting more results for less effort).
This is why AI is so exciting for the economy and investors. In a best-case scenario, AI will lead to a massive increase in profitability as revenues grow and costs decrease. And that is what has triggered a kind of mania for AI-related stocks.
The flipside of this is that AI is currently a kind of Wild West in which “anything goes.” There are no legal, legislative, or societal frameworks for this technology. As a result, advances are being made with few if any ethical considerations.
In this sense, AI is following a pattern we’ve seen with other technological revolutions in the past. That pattern consists of two phases is:
The initial breakthrough phase, which occurs before social/legal frameworks are in place.
The “normalization” phase during which social/legal frameworks are implemented, giving the technology a societal and financial legitimacy.
If you need a real-world example of this, think of the electronic music file or MP3 revolution.
The first phase was Napster in 1999, which featured the sharing of music in what was later deemed as illegal activity (the legal framework was not yet ready for the technology). During this initial phase Napster exploded in popularity particularly among young people. At its peak Napster had tens of millions of users. Then came the lawsuits, Napster went bankrupt, and social/ legal frameworks were introduced for this new technology. During this time Apple introduced iTunes: a version of MP3 technology in which MP3s could be bought and sold in a legally acceptable form.
Napster is still around. Its marketing promotes the fact it is “100% legal.” And it has about five million users. By way of contrast, at its peak, iTunes had 500+ million users and accounted for 63% of all digital music sales. It is now in the process of being converted over to Apple Music, a new service that also offers music streaming and other services in order to compete with Spotify which is the new market leader. So once again, the technology has changed and requires adaption.
AI as it stands today, is in its “Napster” phase. As investors we can profit from this by riding key players in the space, but we need to do so with our eyes open to risks, in particular the risk that at some point, the threat of a regulatory framework for AI will appear. And when it does, much of the “froth” in AI stocks will disappear as hot money/ momentum investors leave the space out of fear.
This doesn’t mean that AI will be “dead” at that time. Indeed, the BIG money will be made as market leaders emerge from the ashes of that collapse.
We’ll delve deeper into this in tomorrow’s article…
In the meantime, if you’re interested in profiting from this technological revolution, we are currently putting the finishing touches on a special investment reporting that outlines some of the larger implications for AI as well as several of the most likely market leaders.
To receive this special report when it’s published later this week, all you need to do is sign up for our FREE daily investment commentary Gains Pains & Capital.
We’re picking up where we left off our A Deep Dive Into What AI Means For Corporate America investment series. If you missed the first part from this series last week, you can access it here.
By brief way of review:
Artificial Intelligence (AI) is the dominant theme in the investing world today.
Currently AI is capable of accessing vast swathes of available information and integrating it in such a way that AI appears to be creating something from scratch.
We’ve already detailed the impact this technology will have on the entertainment industry: creating videos/ movies/ commercials used to require dozens of people (directors, actors, lighting technicians, sound technicians, editors, etc.) Courtesy of AI, ONE person can serve all of those functions.
Today, we’re going to assess the impact AI can have on other industries.
In the corporate world, AI can perform many tasks that previously required several people if not entire departments. AI can write an entire marketing piece and even create a visual advertisement for a product using a few words/ phrases entered by one user.
Interactive Investor recently used to AI to develop an entire online marketing campaign including thousands of ads and keywords. The results saw an increase in account creation and decrease in acquisition costs.
AI can do legal work as well, performing document review, analyzing contracts, and even preparing a deposition. There are now several examples of AI “legal assistants” located online.
AI can even alter business operations. Whole Foods has begun introducing “Just Walk Out” stores in which you simply walk in, take whatever you want from the shelves, and walk out. Sensors and cameras take care of the payment side of things.
The above examples of AI technology pertain to very different areas of the economy: making movies, performing legal diligence, shopping for groceries, etc. However, for investors, the implications of AI all boil down to just two items:
Improving productivity (getting more results for less effort).
This is why AI is so exciting for the economy and investors. In a best-case scenario, AI will lead to a massive increase in profitability as revenues grow and costs decrease. And that is what has triggered a kind of mania for AI-related stocks: Nvidia, Super Micro Computers, etc.
The flipside of this is that AI is currently a kind of Wild West in which “anything goes.” There are no legal, legislative, or societal frameworks for this technology. As a result, advances are being made with few if any ethical considerations.
We’ll be assessing those in tomorrow’s article.
In the meantime, if you’re interested in profiting from this technological revolution, we are currently putting the finishing touches on a special investment reporting that outlines some of the larger implications for AI as well as several of the most likely market leaders.
To receive this special report when it’s published later this week, all you need to do is sign up for our FREE daily investment commentary Gains Pains & Capital.
Artificial Intelligence (AI) is the dominant theme in the investing world today.
If you’re unfamiliar with AI, the concept is as follows: AI represents technology that can “think for itself.”
That sounds pretty advanced, but the reality is that AI in its current form is something of a misnomer. What I mean by this is that the technology doesn’t actually “think,” rather it accesses vast swathes of available information and integrates it in such a way that AI appears to be creating something from scratch.
The results can be incredible or ridiculous, depending on your perception.
For example, below is a screenshot from a video that was generated by an AI technology called “Sora.” The image on the left is a photo of a real person. The image on the right is a still shot from a video that was generated by AI to show the woman singing the lyrics to a pop song. AI took the fixed image from the left and generated a full 90 seconds of facial movements to make it appear as if the woman was singing a song. It’s astonishing.
H/T Min Choi
The obvious implication here is that AI will be highly disruptive for the entertainment industry. Previously, creating movies required dozens of people (directors, actors, lighting technicians, sound technicians, editors, etc.) Courtesy of AI, ONE person can serve all of those functions. This is why the Writers Guild of America (screenwriters) writers went on strike last year: many if not ALL of these people are in danger of losing their jobs as AI progresses.
The entertainment industry isn’t the only part of the economy at risk of disruption by AI.
I’ll detail what AI means for other industries tomorrow. But in the meantime, if you’re interested in profiting from this technological revolution, we are currently putting the finishing touches on a special investment reporting that outlines some of the larger implications for AI as well as several of the most likely market leaders.
To receive this special report when it’s published, all you need to do is sign up for our FREE daily investment commentary Gains Pains & Capital.
I’m about to share the single most important thing about investing in Artificial Intelligence (AI) today…
If you keep this in mind, you’ll avoid the basic mistake that 99% of investors are making when they put capital to work in AI.
Are you ready? Here it comes…
Over 99% of commentators have no idea what they’re talking about.
I’m not trying to be rude, nor facetious. There are plenty of brilliant, insightful people commenting about AI today. But investors often act as if strategists and analysts are psychic.
They’re not.
Human innovation is too messy, chaotic, and ever-changing for lots of people to accurately predict. This is especially true when it comes to technological revolutions with far-reaching implications.
If you don’t believe me, let’s consider what happened with search engines, one of the recent technological revolutions that produced incredible profits for investors who played it correctly.
Today, Alphabet (GOOGL) is THE search engine of the world, accounting for over 90% of global searches. At a market cap of $1.7 TRILLION company, it is one of the 10 largest companies in the world. It routinely produces tens of billions of dollars in profits. In fact, its 2023 profits were greater than the market capitalizations of Ford (F) and U.S. Steel (X) combined.
However, back in the 1990s when search engine technology first came to market, Alphabet (then Google) wasn’t a market leader. Rather, the company was competing for market share with numerous other firms including Yahoo!, Hot Bot, Excite, Ask Jeeves, AltaVista, AOL Search, MSN Search and others.
Indeed, at that time, Yahoo! was the largest search engine company with a market capitalization of $125 billion. In fact, Yahoo! had a chance to buy the Alphabet for just $1 billion in 2002! Fast forward to 2017, and Yahoo! was sold to Verizon for less than $5 billion… by which point Alphabet was a $730 billion company.
Who saw that coming?
My point here is that, the internet, specifically search engines, represented an incredible revolution that changed the world. However, few if any people were able to accurately predict how it would play out.
And this didn’t just concern picking winners vs. losers… it also concerned the technology as a whole: many investors thought that the Tech Crash of the early ’00s meant that the opportunity for profiting from search engines was over. They couldn’t have been more wrong as the below chart illustrates.
The great news is that those who were able to navigate the markets to profit from search engines made truly STAGGERING amounts of money. And if you could pick the future market leaders in advance… while riding the booms and busts with proper risk management… well, the above chart of Alphabet shows you the kind of returns you could generate.
Thus, the key for investing in AI today is determining who the future leaders will be. That’s where the REAL money will be made.
We are currently putting the finishing touches on a special investment reporting that outlines some of the larger implications for AI as well as several of the most likely market leaders.
To receive this special report when it’s published, all you need to do is sign up for our FREE daily investment commentary Gains Pains & Capital.
Inflation is going in the wrong direction again… and that is BAD news for stocks.
If you’ll recall, the primary driver of the recent rally in stocks was the Fed suggesting that it would soon begin cutting rates. Indeed, it was a speech by Fed Governor Waller concerning that exact topic in late November 2023 that ignited the move from 4,550 to new all time highs for the S&P 500.
However, with the economy still growing at an annualized rate of 3%, stocks at new all-time highs, and financial conditions looser today than they were before the Fed starting raising rates in March 2022, the ONLY way the Fed could cut rates without looking like a group of political activists is if inflation is at or close to target.
It’s not. In fact, the latest inflation data is going the WRONG way for the Fed.
The Consumer Price Index (CPI) for January was supposed to show a month over month (MoM) increase of just 0.2% and a year over year (YoY) increase of 2.9%. Instead it showed a MoM of 0.3% and a YoY of 2.9%).
That 0.1% difference in MoM and 0.2% difference in YoY don’t sound like a big deal, but this was the reason the market dropped like a brick last week on Tuesday.
Then, on Friday, January’s Core Producer Price Index (PPI) came in at 0.5% MoM vs. expectations of 0.1%. Now that is a legitimately big deal as Core PPI is the Fed’s PREFERRED inflation measure.
This means there will be NO rate cuts in March. And investors will be lucky if they get a rate cut in April/ May.
This sets the stage for a significant stock market correction. I’ve warned repeatedly that stocks are quite stretched above their primary trend. I believe the S&P 500 will be working its way down to 4,800 and then eventually 4,600 in the coming weeks. I’ve illustrated those levels on the chart below.
If you’re looking to take your trading to the next level, we’ve identified a simple strategy for riding rallies, avoiding corrections, and potentially beating the market by a wide margin. And best of all, it only takes about five minutes a day to use it! And despite this simplicity, it is INCREDIBLY profitable.
To find out what it is and how it works, and what it is saying about the markets today, all you need to do is join our FREE daily investment commentary GAINS PAINS & CAPITAL. You’ll immediately be given access to an investment report detailing this trading strategy so you can start using it today!
The S&P 500 looks primed for a correction of sorts.
As I’ve noted previously, the S&P 500 is quite extended above both its 10-week moving average (same as the 50-DMA) as well as the 40-week moving average (same as the 200-DMA). Historically, this degree of extension above both trendlines has marked a temporary top as the below chart illustrates.
Beyond this, NO sector is outperforming the S&P 500 at this time (maybe with the exception of Communication Services).
Below are three charts showing the ratio performance between each sector in the S&P 500 and the broader index. When the individual sector outperforms, the line rises. When the individual sector underperforms, the line falls. As you’ll note, NO SECTOR is leading the market higher right now.
Tech, Healthcare, Consumer Discretionary and Financials:
Communication Services, Industrials, Consumer Staples, and Energy.
Utilities, Real Estate and Materials:
Looking at the above ratios, we note that Tech, Consumer Discretionary, Financials and Real Estate lead the market higher during the rally from early November until the end of 2023. However, today, not one single sector is leading the overall market higher (maybe with the exception of Communication Services). Even the Tech sector, which usually is a market leader has been underperforming the broader index since January.
So how has the market held up despite every sector underperforming?
A handful of stocks have pulled the overall market higher. Specifically, Nvidia (NVDA), Amazon (AMZN), Meta (META), and Eli Lilly & CO (LLY). Remove those companies from the S&P 500 and stocks are effectively flat.
Add it all up, and the above analysis suggests that “under the surface” the S&P 500 could see a decent correction of 5% or more in the coming weeks. Only a small handful of stocks are holding everything up. This combined with our overbought and overextended the market is suggests the momentum for the next market move will be DOWN.
If you’re looking to take your trading to the next level, we’ve identified a simple strategy for profiting from the market that is on par with anything before.
If you’re looking to take your trading to the next level, we’ve identified a simple strategy for catching rallies, avoiding corrections, and potentially beating the market by a wide margin. And best of all, it only takes about five minutes a day to use it! And yet, despite this simplicity, it is INCREDIBLY profitable.
To find out what it is and how it works, all you need to do is join our FREE daily investment commentary GAINS PAINS & CAPITAL. You’ll immediately be given access to an investment report detailing this trading strategy so you can start using it today!
Yesterday, I outlined how the Fed and the Treasury are actively working to juice the financial system to aid the Biden administration’s re-election bid.
By quick way of review:
1) The Fed will soon begin cutting interest rates while stocks are at all time highs, the economy is still growing, and financial conditions are in fact looser than they were before the Fed raised rates for the first time in March 2022.
2) The U.S. is running emergency levels of social spending at a time when the economy is still growing. It’s added $5 trillion in debt since President Biden took office. And the pace of debt issuance is speeding up, not slowing down: the U.S. has added $2 trillion in debt in the last 12 months alone. You can thank Treasury Secretary Janet Yellen for signing off on this insanity.
Today, I’d like to delve a bit more into one of the more nefarious schemes the Fed is using to juice stocks higher. To fully grasp this, we need to wind the clock back to March 2023, when the U.S. regional banking system was on the verge of collapse.
At that time, a number of large regional banks collapsed due to:
1) Bad risk management: their leadership teams failed to appropriately hedge their interest rate risk while the Fed was raising rates.
2) Banks were only paying 0.1% on deposits, while money market funds and short-term Treasuries were yielding 4% or more. As a result of this, depositors were pulling funds out of the banks, resulting in the banks having to sell large portions of their loan portfolios at a loss (banks must maintain certain capital requirements based on deposits).
The Fed took action to stop a crisis from unfolding, pumping $400 billion in liquidity into the financial system in just three weeks. Prior to that, the Fed’s balance sheet was falling due to its Quantitative Tightening (QT) program. The Fed reversed NINE months worth of that program in just three weeks!
That staved off a crisis from hitting. But the Fed then began a back-door bailout of the banks through which it gave them additional access to credit and liquidity. And not just a little… but a LOT.
The below chart shows this facility’s use running back to 2005. And no, you’re not imagining things: the Fed’s use of this facility to juice the financial system in 2023 was greater than what it did during the pandemic, and almost as great as that used during the Great Financial Crisis of 2008! In fact, today it’s higher than it was during the absolute depth of the pandemic in March 2020!
We’re now almost a year out from the regional banking issues and the Fed continues using this facility to the tune of over $200 BILLION. So again, the Fed is juicing the financial system for political purposes. It’s abhorrent and corrupt, but it’s reality. And well prepared investors can take steps to insure they profit from what’s happening with the right investments.
I’ll address how to profit from this in tomorrow’s article. If you’d like it delivered to your inbox, all you have to do is join our FREE daily investment commentary GAINS PAINS & CAPITAL.
The Fed and the Treasury are juicing the markets to help the Biden administration with its 2024 re-election bid. And their actions are going to result in a massive crisis hitting some time in 2025.
The Fed is supposed to be politically independent, but everyone knows that is a fairytale. The Bernanke-led Fed introduced QE 3 a mere two months before the 2012 election to help the Obama administration. Moreover, former Fed Vice-Chair Stanley Fisher admitted that the Powell-led Fed intentionally raised rates in December 2018 (triggering a stock market crash) to hurt the economy under former President Trump.
Put simply, anyone who tells you that the Fed doesn’t play politics hasn’t been paying attention. And it is clear that today’s Fed led by Jerome Powell and today’s Treasury led by Janet Yellen are actively juicing the markets and economy to help the Biden administration with its claims that the economy is booming and everything is great.
Case in point, the Fed is talking about easing monetary conditions at a time when the stock market is at all-time highs and financial conditions are LOOSER than they were when the Fed first started raising rates! Why do this? To keep stocks higher for the election.
The Fed is not the only one in on this scheme.
The Treasury is pulling out all the stops to help the Biden administration. Typically, the U.S. runs a massive deficit during recessions in order to cushion the economic contraction. Today the U.S. economy is technically still growing… and the Biden administration is running the U.S.’s largest deficit as as percentage of GDP in history (outside of World War II).
Put another way, the U.S. is running emergency levels of social spending at a time when the economy is still growing. And this is adding trillions of dollars in new debt to the U.S.’s liabilities every year.
The U.S. owed $28 trillion in debt when Joe Biden was sworn into office in 2021. It owes $33 trillion today. And the pace of debt issuance is speeding up, not slowing down: the U.S. has added $2 trillion in debt in the last 12 months alone. You can thank Treasury Secretary Janet Yellen for signing off on this insanity.
Worst of all, the above items are happening for political purposes. There are ZERO fundamental reasons for the Fed and the Treasury to be implementing the above policies. But in today’s world of political corruption and systemic abuse of power, it’s simply how things are.
I’ll address how to profit from this in tomorrow’s article. If you’d like it delivered to your inbox, all you have to do is join our FREE daily investment commentary GAINS PAINS & CAPITAL.
Who are you going to believe… the mainstream shills, or your own eyes and wallets?
The economic data in the US is telling us that the economy is booming. GDP growth is roaring at annualized rate of over 4%. Unemployment is collapsing, with over 300,000 new jobs being created last month. And inflation has been tackled, falling from a peak of nearly 9% to 3% where is sits today.
The mainstream media parrots these data points as if they were facts. There’s only one problem… if any of this were true, the Biden administration’s approval rating would not have just hit a new low of 37%. You can’t argue that the economy is doing great, but the President is doing an awful job at the same time. So one of these items (the economic data or the President’s approval ratings) is false.
It’s not the approval ratings.
The economic data in the U.S., particularly any economic data that is politically important (GDP growth, inflation, employment) is now largely fiction. And I don’t mean “fiction” as in there are honest mistakes being made because things are complicated; I mean fiction as in the bulk of the data is invented in a spreadsheet by a government beancounter.
Case in point, we are told that in January the economy added 353,000 jobs. As ZeroHedge notes this happened in a month in which the economy actually LOST 63,000 full time jobs and gained 96,000 part-time jobs. Yes, somehow the economy “created” 353,000 jobs while losing 96,000 full time jobs.
Some added food for thought about the true state of the economy. As I write this, the U.S. is adding over $2 trillion in debt every year. The below chart needs no explanation. This is obviously NOT going to end well.
Why is the U.S. adding so much debt?
Because the Biden administration is running the largest deficit as a percentage of GDP outside of WWII. Yes, the deficit is larger today than it’s been during any recession in the last 100 years. Surely this must be because the economy is roaring!
If all of the above items make your head hurt, consider the added insanity that financial institutions and fund managers actually invest trillions of dollars based on this stuff. And people wonder why no one ever sees a crisis coming in advance!?!?
Don’t fall for this stuff. There’s a lot of money to be made in the markets based on these lies, but it takes a lot of work and insight!
To start receiving our daily market insights every weekday before the market’s open (9:30AM EST), use the link below. There is no fee or cost to GAINS PAINS & CAPITAL. Access is free to the public.
Having juiced the markets higher with the promises of rates cuts, the Fed now finds itself in the absurd position of walking back these promises as A) stocks are at all time highs, B) the BLS continues to release manipulated jobs data to aid the Biden administration and C) the economy is allegedly growing at annualized rate of 4%+.
Regarding the jobs data…
It has become a running joke that the beancounters in Washington DC release absurdly positive economic data to aid the Biden administration, only to revise the data downward multiple times after the fact. Perhaps the single most ridiculous example of this occurred in 2022 when the Philadelphia Fed revealed that the BLS had overstated job growth in first half of the year by one million jobs.
I bring this up because the BLS was up to its usual shenanigans with the January jobs report released on Friday. In it the BLS claimed that the economy added 353,000 jobs in January 2024 instead of the expected 185,000. Let’s be blunt here, if the economy was even close to as strong as the gimmicked data the BLS issues, the Biden administration’s approval ratings wouldn’t be in the toilet.
Politics aside, the issue with this jobs report is that it makes it impossible for the Fed to cut rates any time soon. After all, how can the Fed start easing monetary conditions when the economy is supposedly adding over 300,000 jobs per month and GDP is supposedly growing at 4.2%?!
And so the markets are in a kind of limbo. Everyone is bullish based on hopes of Fed rate cuts… but the Fed can’t cut rates with the data this strong. This opens the door to a market correction to take some of the “froth” out of stocks.
The S&P 500 hasn’t touched its 50-day moving average (DMA) in three months. The 50-DMA is represented by the blue line in the chart below. As you can see, it’s unusual for the S&P 500 NOT to touch this line for such a long period of time.
I would also add that the S&P 500 is ~5% above the 50-DMA. Historically, this degree of extension has market a top of sorts.
With all of this in mind, the odds favor a correction to the 50-DMA (upper 4700s) some time in the next few weeks. After that, we’ll revisit our market forecast to see what’s next.
As I keep stating, you CAN outperform the overall market, but it takes a lot of work and insight!
To start receiving our daily market insights every weekday before the market’s open (9:30AM EST), use the link below. There is no fee or cost to GAINS PAINS & CAPITAL. Access is free to the public.
The most critical companies to monitor are the MAG 7/ big tech plays. These are the largest companies in the S&P 500. Because of their size, they account for ~30% of the index’s weight.
Thus far, Tesla (TSLA), Microsoft (MSFT), and Alphabet (GOOGL) have reported. The results have been interesting.
TSLA reported on 1/24/24. The stock was down 10% on its results.
Last night, MSFT and GOOGL reported. MSFT is down about 0.5% while GOOGL is down over 5%.
So, thus far two of the three MAG 7 have seen their stocks collapse a LOT on earnings results while one of is effectively flat.
This doesn’t bode well for the broader market. It is VERY difficult for the S&P 500 to rally much at all if the MAG 7 plays are weak. Remember, these companies account for 30% of the market’s weight.
Apple (AAPL), Amazon (AMZN) and Meta (META) report on Thursday. Nvidia (NVDA) reports on 2/21/24. If AAPL and META also sell-off on their results, it’s safe to assume the market will experience a decent correction.
From a technical analysis perspective, the S&P 500 has support just below 4,800. After that is CRITICAL support at 4,595. Given how the MAG 7 plays are responding to earnings, I wouldn’t be surprised to see a correction to 4,595 in the next two months.
This would represent a back-test of the Cup and Handle formation I showed yesterday. Bear in mind, a correction like this would NOT negate our longer term forecast for the S&P 500 to go to 6,000 before 2025. Rather, this correction is a short-term development and would present a fantastic buying opportunity.
If you’re looking for someone to guide your investing to insure you crush the market, you can sign up for our FREE daily market commentary, GAINS PAINS & CAPITAL.
As an added bonus, I’ll throw in a special report Billionaire’s “Green Gold” concerning a unique “off the radar” investment that could EXPLODE higher in the coming months. It details the actions of a family of billionaires who literally made their fortunes investing in inflationary assets. And they just became involved in a mid-cap company that has the potential to TRIPLE in value in the coming months.
The S&P 500 is up nearly 150 points in just five sessions. This has been quite a move. And what’s truly extraordinary is that every intraday dip is being bought aggressively.
However, a word of caution here.
The S&P 500 is now 4% above its 50-Day Moving Average (DMA) and 9.8% above its 200-DMA. Over these last 18 months, any time the index has become this extended above its trend has resulted in a short term peak. So, it wouldn’t be surprising to see the S&P 500 correct down to back-test the recent breakout at 4,790.
After that, the door is open to 5,000 on the S&P 500. The Cup and Handle formation I outlined a few weeks ago has broken to the upside. Long-term (later in 2024) we are likely going MUCH higher.
For more market insights swing by https://gainspainscapital.com/
On November 28th, 2023, I predicted that stocks would hit new all-time highs before February 1, 2024.
Bear in mind, the S&P 500 was at 4,550 when I wrote this. So my prediction meant that the index would have to rally to over 4,818 (the former all-time high established January 3, 2022) in eight weeks’ time.
On Friday this happened, a full two weeks ahead of schedule. Anyone who followed our prediction made a killing!
So what happens now?
Stocks are now quite stretched to the upside. I anticipate we’ll see a drop to backtest this recent breakout at 4,800 sometime in the next 10 days. But after that, the door is open to a run to 4,920 by the end of 1Q24. That’s the upside target for the inverse Head and Shoulders pattern the S&P 500 has established in the last four weeks.
So, in the last seven months, we’ve predicted:
1) The S&P 500 to decline to 4,100s (when it was at 4,500).
2) The S&P 500 to rally from the 4,100s to 4,600 (when it was at 4,200).
3) The S&P 500 to hit new all-time highs before February 1st 2024(when it was at 4,550).
As I keep stating, you CAN outperform the overall market, but it takes a lot of work and insight!
If you’re looking for someone to guide your investing to insure you crush the market, you can sign up for our FREE daily market commentary, GAINS PAINS & CAPITAL.
As an added bonus, I’ll throw in a special report Billionaire’s “Green Gold” concerning a unique “off the radar” investment that could EXPLODE higher in the coming months. It details the actions of a family of billionaires who literally made their fortunes investing in inflationary assets. And they just became involved in a mid-cap company that has the potential to TRIPLE in value in the coming months.
On December 20th 2023, I predicted that stocks would hit new all-time highs before February 2024. Despite all the drama in Washington as well as the geopolitical risk in the world, stocks are within spitting distance of doing this… and we’re only halfway through January.
The S&P 500 bounced hard off of support at 4,700. If the index closes this week even marginally higher, it will be at new all-time highs.
This is not our first accurate prediction for stocks.
Throughout September and October of 2023, we warned clients that the S&P 500 was due for a pull back down to the 4,100s. Time and again, we warned our readers not to buy into the rally and to preserve their capital for an incredible buying opportunity that would soon hit.
And hit it did! And our readers “backed up the truck.”
Then, on November 2, when the S&P 500 was still at 4,200, we told clients to buy aggressively because the S&P 500 was going to 4,600 before year end. Remember, the S&P 500 had only just bottomed at 4,100 and we were predicting a 400 point move to hit in the span of eight weeks. So this was an EXTREMELY aggressive forecast. But our research backed it up and we trust our work!
The market then rallied to 4,600 in just four weeks! Those clients who followed our recommendation and loaded up on stocks at 4,100 made an absolute killing!
So, in the last seven months, we’ve predicted:
1) The S&P 500 to decline to 4,100s (when it was at 4,500).
2) The S&P 500 to rally from the 4,100s to 4,600 (when it was at 4,200).
3) The S&P 500 to hit new all-time highs before February (when it was at 4,600).
As I keep stating, you CAN outperform the overall market, but it takes a lot of work and insight!
If you’re looking for someone to guide your investing to insure you crush the market, you can sign up for our FREE daily market commentary, GAINS PAINS & CAPITAL.
As an added bonus, I’ll throw in a special report Billionaire’s “Green Gold” concerning a unique “off the radar” investment that could EXPLODE higher in the coming months. It details the actions of a family of billionaires who literally made their fortunes investing in inflationary assets. And they just became involved in a mid-cap company that has the potential to TRIPLE in value in the coming months.
Governments around the world are issuing staggering amounts of debt to “paper over” any weakness in the private sector with public spending. As Bloomberg notes, collectively, the U.S., U.K., E.U., and Japan will issue $2 trillion in new debt this year.
This is keeping the world from entering a recession, while simultaneously setting the stage for the next round of inflation. Remember that the first wave of inflation (2021-2023) was triggering by egregious levels of public spending/ stimulus during a time of private sector weakness.
In the U.S., it is clear the Biden administration is implementing policies to prop up the economy and financial markets for the 2024 election regardless of the consequences the policies will bring down the road.
Case in point, the U.S. is running the levels of deficit you usually see during a recession, at a time when the economy is technically still growing. Indeed, the only periods in which the U.S. was running a larger deficit as a percentage of GDP in the last 100 years during World War II, and the Great Financial Crisis.
As you likely know, deficits are financed via the issuance of debt. And because the U.S. is constantly having to roll over old debt into new debt while also issuing new debt to finance its deficit, the country has added some $2 TRILLION in debt in the last seven months alone!
My question to policymakers: what if all this spending brings back higher inflation when the U.S. finally rolls over into recession? What’s the plan, then?
Gold has figured it out already. Other asset classes will soon, too.
If you’re looking for someone to guide your investing to insure you crush the market, you can sign up for our FREE daily market commentary, GAINS PAINS & CAPITAL.
As an added bonus, I’ll throw in a special report Billionaire’s “Green Gold” concerning a unique “off the radar” investment that could EXPLODE higher in the coming months. It details the actions of a family of billionaires who literally made their fortunes investing in inflationary assets. And they just became involved in a mid-cap company that has the potential to TRIPLE in value in the coming months.
The U.S. passed a debt ceiling resolution in May of 2023. Both the GOP and the Democrats claimed victory for the deal, but the reality is the government won and Americans were screwed.
How do I know this?
It took the U.S. 232 years to generate its first $10 trillion in debt. It added another $10 trillion in debt in just nine years once the Fed pinned interest rates at zero and cornered the bond market with Quantitative Easing (QE) from 2008 to 2017.
The U.S. then added another $10 Trillion in debt in just five years when the Fed reintroduced ZIRP and QE in NUCLEAR fashion in response to the pandemic. Obviously, you’re beginning to see the trend here: the U.S. added $10 trillion in debt in 232 years, nine years, and five years.
But the “debt deal” has really added fuel to the fire.
The U.S. has added another $4 trillion in debt since 2022. But~ $2 trillion of this was added in the seven months since the debt deal was passed! And thanks to the debt deal removing the debt ceiling until 2025, there is little chance that the pace of debt issuance will slow anytime this year.
How will this end? With a debt crisis of some sort. The details, for now, are unclear.
What isn’t unclear is that investors can potentially make a LOT of money from this situation. Those who invested in the right assets at the right times during the last 20 years while the U.S. has engaged in a debt bonanza have seen some truly OBSCENE returns.
And no, I’m not talking about gold. The precious metal has traded sideways for four years, while the U.S. has tacked on another $10 trillion in debt.
If you’re looking for someone to guide your investing to insure you crush the market, you can sign up for our FREE daily market commentary, GAINS PAINS & CAPITAL.
As an added bonus, I’ll throw in a special report Billionaire’s “Green Gold” concerning a unique “off the radar” investment that could EXPLODE higher in the coming months. It details the actions of a family of billionaires who literally made their fortunes investing in inflationary assets. And they just became involved in a mid-cap company that has the potential to TRIPLE in value in the coming months.
Since early 2023, numerous pundits and gurus have been calling for a recession. And despite numerous indicators flashing that one is coming… the recession has yet to arrive.
Why?
This:
The U.S. is running a GARGANTUAN deficit equal to 5.5% of GDP.
To put this into perspective, it’s larger than the deficit the U.S. ran during EVERY recession in the last 100 years except for the Great Financial Crisis and when the economy was shutdown in 2020.
Put simply, the U.S. is running the kind of spending that we usually see during periods in which the private sector is in a total free-fall… at a time when the private sector is weak, but not yet collapsing.
This has managed to keep the economy positive. But it’s a short-term fix.
Ultimately, the U.S. cannot stay out of recession forever as no amount of government spending can replace the economic impact of the private sector (we learned this during the shutdowns when the Fed and Uncle Sam spent $8 trillion in 12 months but the economy still collapsed).
Moreover… this situation presents us with a MAJOR problem down the road: if the U.S. is already spending at a pace usually associated with recessions while the economy is still growing, what is going to happen when the economy finally does roll over into recession? How much spending will it be doing then? 8% of GDOP? 10% of GDP? More?
And bear in mind, this spending is being funded by debt (it is a deficit after all). What happens to the bond market if the U.S. cranks up its spending to 8% or more of GDP when the actual recession hits?
Gold has started to figure it out. Other assets will figure it out soon.
As I keep stating, you CAN outperform the overall market, but it takes a lot of work and insight!
If you’re looking for someone to guide your investing to insure you crush the market, you can sign up for our FREE daily market commentary, GAINS PAINS & CAPITAL.
As an added bonus, I’ll throw in a special report Billionaire’s “Green Gold” concerning a unique “off the radar” investment that could EXPLODE higher in the coming months. It details the actions of a family of billionaires who literally made their fortunes investing in inflationary assets. And they just became involved in a mid-cap company that has the potential to TRIPLE in value in the coming months.
As I keep telling you, it IS possible to time the market. The key is to put in the work to do so.
For me, one of the best means of predicting stock market moves is to focus on “market leading” indicators, or assets that typically lead stocks to the upside and the downside during market turns.
One of my favorite such indicators is high yield credit, or junk bonds.
Bonds/ credit are senior to stockholders. If a company goes bust and needs to liquidate its assets, bond/ credit holders will be paid out long before stockholders see a dime. And generally speaking, bond investing is more sophisticated than stock investing largely due to bonds’ greater sensitivity to Fed policy, the economy, and more.
As a result of this, credit, particularly high yield credit, or credit for companies that are at a greater risk of going bust, typically leads stocks when it comes to pricing future risk on or risk off moves.
You can see this clearly in the following charts which depict the High Yield Corporate Bond ETF (red line) and the S&P 500 (black line). Sometimes the two assets move in tandem, but other times, credit leads stocks clearly to the point that you can accurately predict the next market move for stocks.
The first chart concerns the risk on move in assets that occurred from late 2022/ early 2023. At that time, HYG lead the market to the upside, rallying aggressively even when stocks would dip for a day or two. I’ve illustrated this with a purple rectangle below. Throughout that time period, the ongoing strength in HYG was a reliable indicator that the stock market would continue to rally.
Another example concerns the risk off move in assets that occurred from July 2023 through November 2023. During that period, high yield credit failed to confirm any rally in stocks, with the red line (credit) rolling over quickly even when the black line (stocks) bounced aggressively. I’ve illustrated this with a blue rectangle in the chart below.
So, what is high yield credit telling us about the future of the stock market today?
HYG is leading stocks to the downside, though it is doing so in a very controlled manner. Right now, HYG is suggesting that the S&P 500 will drop to 4,700 or so. Obviously this can change as things develop, but for now, HYG is telling us that any stock pullback should be relatively shallow.
As I keep stating, you CAN outperform the overall market, but it takes a lot of work and insight!
If you’re looking for someone to guide your investing to insure you crush the market, you can sign up for our FREE daily market commentary, GAINS PAINS & CAPITAL.
As an added bonus, I’ll throw in a special report Billionaire’s “Green Gold” concerning a unique “off the radar” investment that could EXPLODE higher in the coming months. It details the actions of a family of billionaires who literally made their fortunes investing in inflationary assets. And they just became involved in a mid-cap company that has the potential to TRIPLE in value in the coming months.
The S&P 500 is ~5% above its 50-Day Moving Average. Historically, this degree of extension above the primary trend has marked a temporary top. It doesn’t mean that stocks will collapse, rather is suggests the upside is limited and consolidation/ correction is the high probability scenario.
The question now is how deep the correction will be…
For that analysis we turn to bonds and the Fed.
The yield on the 2-Year U.S. Treasury has declined from 5.25% to 4.2% where it is now. This decline has been driven by the Fed pivot, in that the Fed will no longer be raising rates, but instead will begin cutting them in the near future.
This will be a boon for stocks as this declining yield means:
1) Stocks will be priced at a higher future Earnings Per Share (EPS) multiple.
2) Money will begin to flow out of bonds and money market accounts into stocks as yields have peaked.
All of the above suggests that any and all dips in stocks will be relatively shallow. Put simply the coming decline is an opportunity to “buy the dip” in a new bull market.
In terms of specific price points, the S&P 500 has major support at 4,700. I would be very surprised to see the market drop much below that level. The S&P 500 might decline into the upper 4,600s to “run the stops” for stock bulls, but a drop below 4,680 is unlikely.
For more market insights and analysis, join our free daily market commentary Gains Pains & Capital. You’ll immediately start receiving our Chief Market Strategist Graham Summers, MBA’s briefings to your inbox every morning before the market’s open.
And if you sign up today, you’ll also receive a special investment report How to Time a Market Bottomthat the market set-up that has caught the bottoms after the Tech Crash, Housing Bust, and even the 2020 pandemic lows.
Even more importantly, you’ll find out what this trigger says about the market today!
This report usually costs $249, but if you join Gains Pains & Capital today, you’ll receive your copy for FREE.
On Monday I told you that the S&P 500 was headed for 4,700. At that time, the market was hovering around 4,600. And given all the risks in the world (turmoil in the Middle East, slowing economic data in the U.S.), I’m sure many people thought I was bonkers to predict that stocks would continue higher.
Fast forward 48 hours and it looks as if the S&P 500 will hit my target before the week ends. As I write this, the S&P 500 futures are at 4,656.
The gains won’t stop there either. I believe the market will reach new all-time highs before February 1 2024. The former high was 4,818 set in October of 2022. I believe we’ll break that within six weeks’ time.
The long-term chart is clear… I’ll tell you what it portends tomorrow. But for now, here’s a hint.
As I keep stating, you CAN outperform the overall market, but it takes a lot of work and insight!
If you’re looking for someone to guide your investing to insure you crush the market, I’m your guy. Since 2015, subscribers of my Private Wealth Advisory have maintained a win rate of 74%.
Yes, we made money on three out of every four trades we closed.
Throughout this time, we completely OBLITERATED the S&P 500, returning over 200% compared the market’s 125%.
So you are looking for someone to help you profit from the markets… few analysts have the ability to navigate volatile markets like I do.
And I believe 2023 is going to be our best year yet!
To join us in turning the coming roller coaster into a source of life-changing profits, all you NEED to do is take out a 30-day $3.99 trial subscription to Private Wealth Advisory.
A full SIX (6) MONTH subscription to Private Wealth Advisory includes:
Frankly, this is a ridiculous amount of material to offer for just $3.99…
Heck, the book alone is worth $9.99, and you’re getting FREE shipping on it!
So technically, you’re getting the weekly market updates, the weekly podcast, and the trades and trade alerts FREE OF CHARGE.
The doors close on this offer soon… don’t delay taking advantage of it!
The S&P 500 has been trading in a 40-point range since mid-November. I know that sounds difficult to believe, but it’s true. For all the issues in the world (conflict in the Middle East, the ongoing war between Russia and Ukraine, economic data weakening in the U.S., political issues/ potential impeachment for the Biden administration), the stock market has gone nowhere.
See for yourself. I’ve illustrated this with a blue rectangle in the chart below.
Having said that, the market DID reveal something MAJOR in the last month… but it’s what DIDN’T happen as opposed to what happened.
What didn’t happen?
Stocks didn’t break down.
In spite of all the issues and potential risks in the world right now, the bears couldn’t generate enough selling pressure to push stocks down more than 1%. And considering the market was EXTREMELY overbought going into this period, it REALLY suggests the bears are weak right now.
Which means…
The Santa rally is about to hit. Indeed, just last week, the market managed to break out of its trading range and stay there. I’ve illustrated this development with a purple circle in the chart below.
If stocks hold this today, then the door opens to a Santa rally that sees the S&P 500 hit 4,700 before year-end. Take out 4,600 on a weekly basis and you’ve got an opening to 100 points higher relatively quickly.
For more market insights and analysis, join our free daily market commentary Gains Pains & Capital. You’ll immediately start receiving our Chief Market Strategist Graham Summers, MBA’s briefings to your inbox every morning before the market’s open.
And if you sign up today, you’ll also receive a special investment report How to Time a Market Bottomthat the market set-up that has caught the bottoms after the Tech Crash, Housing Bust, and even the 2020 pandemic lows.Even more importantly, you’ll find out what this trigger says about the market today!This report usually costs $249, but if you join Gains Pains & Capital today, you’ll receive your copy for FREE. To do so…
Yesterday’s market action could not have illustrated the current market rotation any better.
As I recently outlined:
1) The S&P 500 is currently consolidating after one of its best monthly performances in 30 years.
2) This consolidation has consisted of large tech correcting while laggard sectors and indices (small caps/ the Russell 2000, industrials/ the Dow Jones Industrial Average) catch a bid.
Yesterday’s price action illustrated this perfectly: microcaps (the Russell 2000) caught a major bid relative to tech (the NASDAQ) as the Russell 2000 ROSE over 1% while the NASDAQ fell nearly 0.9%.
If you heeded yesterday’s missive you did quite well! Again, you CAN outperform the overall market, but it takes a lot of work and insight!
This trend is likely to play out over the next two weeks until the Russell 2000/ NASDAQ ratio reaches its 200-day moving average (DMA) sometime around the Fed’s next FOMC (December 12th-13th).
At that point the overall market should complete its consolidation/ correction and begin its next leg up. I’ve said previously that the S&P 500 will hit 5,000 sometime in the 1Q24. The setup is clear in the longer-term Cup and Handle formation.
For more market insights and analysis, join our free daily market commentary Gains Pains & Capital. You’ll immediately start receiving our Chief Market Strategist Graham Summers, MBA’s briefings to your inbox every morning before the market’s open.
And if you sign up today, you’ll also receive a special investment report How to Time a Market Bottomthat the market set-up that has caught the bottoms after the Tech Crash, Housing Bust, and even the 2020 pandemic lows.Even more importantly, you’ll find out what this trigger says about the market today!This report usually costs $249, but if you join Gains Pains & Capital today, you’ll receive your copy for FREE.To do so…https://phoenixcapitalmarketing.com/TMB.html
The S&P 500’s performance for the month of November 2023 was one of the best single month performances for stocks in the last 30 years. Stocks finished the month up 9.5%, a truly incredible return.
The big question is “what’s next for the markets?”
The answer is “rotation.”
Tech led the rally as Big Tech blasted higher throughout November while much of the rest of the market lagged behind. We are now seeing capital flowing into some of of the laggards, specifically small caps.
The ratio between the NASDAQ and the Russell 2000 has been in a downtrend for most of 2023 as Tech stocks outperform small caps. We are now seeing a break of this downtrend to the upside as small caps finally catch a bid and Tech consolidates
This rotation is allowing overall breadth to improve as non-Tech stocks catch up to Tech leaders. You can see this clearly in the chart below in which breadth (red line) is catching up to the Tech sector (XLK).
After this rotation/ catch up is finished, stocks go to new all time highs. The Cup and Handle formation in the long-term chart for the S&P 500 is clear.
For more market insights and analysis, join our free daily market commentary Gains Pains & Capital. You’ll immediately start receiving our Chief Market Strategist Graham Summers, MBA’s briefings to your inbox every morning before the market’s open.
And if you sign up today, you’ll also receive a special investment report How to Time a Market Bottomthat the market set-up that has caught the bottoms after the Tech Crash, Housing Bust, and even the 2020 pandemic lows.Even more importantly, you’ll find out what this trigger says about the market today!This report usually costs $249, but if you join Gains Pains & Capital today, you’ll receive your copy for FREE.To do so…
The S&P 500 is consolidating after one of its best monthly performances in the last 30 years.
Thus far in November, the S&P 500 is up 8.5%. If the month ended today, it would be one of the top 10 monthly returns for the S&P 500 in the last 30 years. We rode this rally the entire way up, having told our clients to buy stocks aggressively when the S&P 500 was down at 4,200. Suffice to say, they’re quite happy.
And their #1 question today is: so what’s next for stocks?
The S&P 500 is quite overextended, having rallied to a level that is 4% above its 50-day moving average (DMA). Throughout the last 12 months, an extension of this magnitude above the 50-DMA has marked a temporary top for stocks.
The big question now is if stocks correct… or if they simply consolidate here, thereby allowing the 50-DMA to catch up to price, before the market make its next push higher.
Thus far the market is opting for #2: consolidating.
The S&P 500 has traded within a 20 point range since November 22nd. The key issue here as far as I’m concerned is that the bears have failed to push stocks down in any significant way, even though there was very low trading volume due to the Thanksgiving holiday.
Think of it this way… stocks are finalizing one of their most aggressive single month rallies in 30 years, and the bears can’t even generate enough selling pressure to push the S&P 500 down 1%.
This suggests that the next move for stocks will be up once this consolidation is over. And given that the market is less than 5% from its all-time highs, I believe we’ll see the S&P 500 hit NEW all-time highs some time in the first quarter of 2025, likely before February 1st, 2024.
For more market insights and analysis, join our free daily market commentary Gains Pains & Capital. You’ll immediately start receiving our Chief Market Strategist Graham Summers, MBA’s briefings to your inbox every morning before the market’s open.
And if you sign up today, you’ll also receive a special investment report How to Time a Market Bottomthat the market set-up that has caught the bottoms after the Tech Crash, Housing Bust, and even the 2020 pandemic lows.
Even more importantly, you’ll find out what this trigger says about the market today!
This report usually costs $249, but if you join Gains Pains & Capital today, you’ll receive your copy for FREE.
It is widely believed that you cannot time the market. This is a myth. You can time the market, but it takes a lot of work and knowledge.
Case in point, as I outlined in yesterday’s article, I accurately called for the S&P 500 to run to 4,600 back on November 2, 2023 when the market was still just at 4,200.
The S&P 500 hit a high an intraday high of 4,557 yesterday. Modesty aside, this was an incredible call, made within a few days of the market hitting its absolute lows before the rally.
This wasn’t luck either.
Prior to this call, I had been warning clients for weeks that stocks would break down to the 4,100s on the S&P 500 and that this would be a MAJOR buying opportunity. Heck, the literal title to a research note to private clients on October 5th was “Bonds Stabilize… But I Expect a Final Flush for Stocks.”
What happened next is illustrated in the chart chart. Again, I called for the S&P 500 to drop to the 4,100s weeks in advance, then predicted the S&P 500 would run to 4,600 weeks within days of the market bottom in late October.
So my point remains the same: you CAN time the market, but it takes a lot of work and knowledge.
For more market insights and analysis, join our free daily market commentary Gains Pains & Capital. You’ll immediately start receiving our Chief Market Strategist Graham Summers, MBA’s briefings to your inbox every morning before the market’s open.
And if you sign up today, you’ll also receive a special investment report How to Time a Market Bottomthat the market set-up that has caught the bottoms after the Tech Crash, Housing Bust, and even the 2020 pandemic lows.
Even more importantly, you’ll find out what this trigger says about the market today!
This report usually costs $249, but if you join Gains Pains & Capital today, you’ll receive your copy for FREE.
The following are excerpts from my Private Wealth Advisory market update to private clients written on 11-2-23. At that time the S&P 500 was trading in the 4,200s. It’s at 4,531 today.
The door is open to a Santa Rally to 4,600 or even higher on the S&P 500.
Why?
The Treasury just removed the single largest concern for stocks for the remainder of the year.
As I’ve noted previously, one of the most difficult aspects of stock market investing is that the market is a discounting mechanism for millions, if not billions, of pieces of information. The stock market represents the collective decisions of millions of individuals all of whom are thinking about a myriad of data points/ issues… and all of whom have literal money on the line.
However, out of all the millions or billions of pieces of information that the market is discounting at any given time, it typically only really cares about two or three issues at a time.
Sometimes it’s inflation. Other times it’s what the President is doing (or tweeting). Other times it’s China. Other times it’s what the Fed is doing or about to do. Other times it’s the economy. And so on and so forth.
What makes things even more difficult is the fact that the market changes its focus all the time. It might be really focused on inflation for a few weeks only to then ignore inflation for months on end. Similarly, the market might go weeks without acknowledging anything Fed officials say, only to then care a great deal about a single statement made by a single Fed official during an hour-long Q&A session.
I bring all of this up, because since late-July/ early-August 2023, the #1 thing the market has cared about has been the size of the Treasury’s long-duration debt issuance…
On July 31st 2023, the Treasury announced its financing needs for the third quarter (July through September). The Treasury announced it would:
1) Need to borrow $274 billion more than previously expected.
2) Increase its issuance of longer duration Treasury bonds for the first time since 2021.
Regarding #2, the actual increase in dollar terms of long duration bonds that the Treasury needed to issue was relatively small ($102 billion vs. $96 billion). However, the fact that there was increase in long duration issuance, combined with the increase in total debt issuance ($274 billion) was a surprise.
And the bond markets HATE surprises.
Since that time, bond investors have been dumping ALL long duration bonds. This has resulted in long-term Treasury yields rising (bond yields rise when bond prices fall). And because the stock market is priced based on long-duration Treasury yields, this has meant a sell-off in stocks.
The chart bel shows the yield on the 10-Year U.S. Treasury and the S&P 500 from the last QRA announcement on July 31st 2023 until last week. As you can see, the two items have been moving in lockstep.
Which brings us to this week (week of 10-30-23).
On Monday the 30th of October, the Treasury issued its QRA for the fourth quarter of 2023. It surprised the markets (in a good way) by stating that it would borrow only $776 billion (this was $76 billion less than previously expected).
Then, on Wednesday (11-1-3), the Treasury released its Report to the Secretary of the Treasury from the Treasury Borrowing Advisory Committee.
In it, the Treasury Borrowing Advisory Committee wrote the following (emphasis added)
The Committee supported meaningful deviation from the historical recommendation for 15-20% T-Bill share.While most members supported a return to within the recommended band over time, the Committee noted that the work Treasury has done to meaningfully increase WAM over the past 15 years affords them increased flexibility with T-Bill share in the medium term.
Source: Treasury.gov
As I explained to clients in the remainder of this market update, the decision of the Treasury to rely extensively on short-term T-bills to finance the deficit would ignite a “risk on” rally that will likely last into year-end.
Since that time, the S&P 500 has done this:
For more market insights and analysis, join our free daily market commentary Gains Pains & Capital. You’ll immediately start receiving our Chief Market Strategist Graham Summers, MBA’s briefings to your inbox every morning before the market’s open.
And if you sign up today, you’ll also receive a special investment report How to Time a Market Bottomthat the market set-up that has caught the bottoms after the Tech Crash, Housing Bust, and even the 2020 pandemic lows.
Even more importantly, you’ll find out what this trigger says about the market today!
This report usually costs $249, but if you join Gains Pains & Capital today, you’ll receive your copy for FREE.
Treasury Secretary Yellen wants stocks and bonds higher.
The reason is simple.
Next year 2024 is an election year. And Yellen is a playing politics for the Biden Administration. After all, it’s hard to convince voters to re-elect someone when their 401(k)s are shrinking by the week.
This is why Secretary Yellen chose to have the Treasury shift its issuance from its traditional breakdown of 15%-20% short-term debt/ 80%-85% long-term debt to favor issuing more short-term debt for the foreseeable future.
Doing this alleviates some of the pressure on long-term Treasuries as well as stocks which are priced based on the former’s yields. This is THE reason why both assets (stocks and bonds) erupted higher last week after declining for most of the last three months.
The BIG problem with this is that Secretary Yellen is choosing to rely heavily on short-term debt at a time when the Biden Administration is running its largest deficit as a percentage of GDP outside of WWII.
The U.S. has added nearly $2 TRILLION to the debt in the last 12 months alone. This is happening at a time when the Treasury is ALSO rolling over trillions of dollars worth of debt.
By relying on short-term debt (12 months of less in duration), Secretary Yellen is setting the stage for an absolute disaster in late 2024/ early 2025.
Why?
All of this short-term debt will be coming due between now and then. By late 2024, the U.S. will have nearly $35 trillion in debt. And if inflation hasn’t collapsed by then, all of the new short-term debt will need to be rolled over when rates are HIGH.
Interest payments on the debt are already at $800 billion. What do you think will happen to them when the U.S. has $35 trillion in debt and needs to roll over a large amount of this while rates are still in the 4% range or higher?
The long-term end of the bond market has figured it out. Stocks will too eventually.
As I keep warning, the Great Debt Crisis of our lifetimes is fast approaching.
In 2000, the Tech Bubble burst.
In 2007, the Housing Bubble burst.
The Great Debt Bubble burst in 2022. And the crisis is now approaching.
If you’ve yet to take steps to prepare for what’s coming, we just published a new exclusive special report How to Invest During This Bear Market.
It details the #1 investment to own during the bear market as well as how to invest to potentially generate life changing wealth when it ends.
Normally this report would be sold for $249. But we are making it FREE to anyone who joins our Daily Market Commentary Gains Pains & Capital.To pick up your copy, swing by:
Both stocks and bonds caught a bid mid-week on announcements that the Treasury has decided to issue less long duration bonds that previously expected.
This is GREAT news for risk assets in the short-term. It’s EXTRAORDINARILY BAD NEWS for EVERYTHING in the long-term.
Let’s me explain.
The recent sell-off in both bonds and stocks was driven by one primary concern: that the Treasury would need to issue a gargantuan amount of long-term debt to fund the Biden administration’s profligate spending.
In its simplest rendering:
1) The Biden administration is running the largest fiscal deficit as a percentage of GDP outside of WWII.
2) All of this spending requires the Treasury to issue massive amounts of debt.
Historically, the Treasury’s debt issuance consisted of 15%-20% short-term debt, and 80%-85% long-term debt. The reason for this was to avoid a rate shock should rates change dramatically in a 12-month period (all the short-term debt would come due at a time when rates were much higher).
It was this heavy reliance on long-term debt issuance that resulted in the 10-Year U.S. Treasury collapsing from late July through late October. And since stocks are generally a long-duration asset class, this pulled stocks down as well.
The below chart shows the 10-Year U.S. Treasury (red line) plotted against the S&P 500 (black line). As you can see, the two were trading in lock-step as soon as the Treasury announced its long duration debt issuance needs for the third quarter of 2023 on July 31st.
The Treasury took note of this collapse, which is why it announced a shift in focus for its 4Q23 debt issuance from long-term debt to short-term debt.
In its very simplest rendering, the Treasury intentionally removed the #1 concern for the stock market… thereby opening the door to a Santa Rally into year-end. Unfortunately, the cost of this is that the U.S. debt markets will be in VERY serious trouble a year from now.
Why?
Because this is a “one time” trick that cannot be repeated. Sure, it puts a floor under bonds for the time being, but unless the government cuts spending in a BIG WAY, sometime in the next 6-12 months all of this short-term debt will come due and the Treasury will once again need to issue long-term debt.
Mind you, the U.S. is currently adding debt at a pace of nearly $2 TRILLION per year. So you can only imagine the yield investors will require to lend money to Uncle Sam for any time period a year from now when our debt is over $35 trillion and we’re still running a ~$1 TRILLION deficit.
The below chart needs no explanation. Long-term Treasuries have broken their multi-decade trendline. They are now sitting on CRITICAL support. Once that green line goes, the debt crisis begins.
As I keep warning, the Great Debt Crisis of our lifetimes is fast approaching.
In 2000, the Tech Bubble burst.
In 2007, the Housing Bubble burst.
The Great Debt Bubble burst in 2022. And the crisis is now approaching.
If you’ve yet to take steps to prepare for what’s coming, we just published a new exclusive special report How to Invest During This Bear Market.
It details the #1 investment to own during the bear market as well as how to invest to potentially generate life changing wealth when it ends.
Normally this report would be sold for $249. But we are making it FREE to anyone who joins our Daily Market Commentary Gains Pains & Capital.To pick up your copy, swing by:
Japan’s central bank, the Bank of Japan (or BoJ for short) is currently engaged in an open-ended Quantitative Easing (QE) program. In its simplest rendering, the BoJ starts buying the 10-Year Japanese Government Bond any time that bond’s yield rises to 1% or higher.
It’s possibly the boldest QE program in history: a definitive “line in the sand” drawn by a major central bank as far as bonds are concerned. Again, this is an open-ended, unlimited QE program through which a MAJOR central bank does whatever it takes to keep is country’s bond yields from rising.
However, even this program is proving inadequate.
The BoJ has had to engage in previously unscheduled bond market interventions SIX TIMES in the last four weeks. And yesterday, it finally gave in and announced that its “line in the sand” of 1% for the yield on the 10-Year Japanese Government bond is now a “loose upper bound” instead of a definitive cap.
The below chart needs little explanation.
In response to this announcement, Japan’s currency, the Yen, broke to new lows. The Yen hasn’t traded at this level since the late 1980s!
This is the end game for every major central bank: the gradual losing control of the bond market… and having to sacrifice your currency in order to stave off a debt crisis. But even that won’t work eventually as the weaker the currency, the less value bonds will have.
As I keep warning, the Great Debt Crisis of our lifetimes is fast approaching.
In 2000, the Tech Bubble burst.
In 2007, the Housing Bubble burst.
The Great Debt Bubble burst in 2022. And the crisis is now approaching.
If you’ve yet to take steps to prepare for what’s coming, we just published a new exclusive special report How to Invest During This Bear Market.
It details the #1 investment to own during the bear market as well as how to invest to potentially generate life changing wealth when it ends.
Normally this report would be sold for $249. But we are making it FREE to anyone who joins our Daily Market Commentary Gains Pains & Capital.To pick up your copy, swing by:
Yesterday, the Treasury announced that it would “only” need $775 billion to fund the budget for the fourth quarter of 2023.
This was considered to be good news.
Back in July, the Treasury had announced it would need $852 billion for the fourth quarter. So the fact the Treasury surprised the markets by needing less was used as an excuse for traders to gun the markets higher.
There’s just one small problem with this…
The Treasury QRA was an obvious lie. There is no way on earth the Treasury only needs $775 billion in refunding for 4Q23. Heck, it needed $500 billion in the last month alone!
Moreover, it’s not as if the government is suddenly becoming careful about spending. The Biden Administration has added $4.6 trillion in debt since taking office. And the pace is actually INCREASING, not decreasing: they added almost $1 TRILLION in new debt between 1Q23 and 2Q23.
So again, the idea that the Treasury can somehow fund everything with just $775 billion in refunding needs in the 4Q23 is a joke. The real amount will be MUCH larger than that.
As I keep warning, the Great Debt Crisis of our lifetimes is fast approaching.
In 2000, the Tech Bubble burst.
In 2007, the Housing Bubble burst.
The Great Debt Bubble burst in 2022. And the crisis is now approaching.
If you’ve yet to take steps to prepare for what’s coming, we just published a new exclusive special report How to Invest During This Bear Market.
It details the #1 investment to own during the bear market as well as how to invest to potentially generate life changing wealth when it ends.
Normally this report would be sold for $249. But we are making it FREE to anyone who joins our Daily Market Commentary Gains Pains & Capital.To pick up your copy, swing by:
Japan is slowing losing control of its bond market.
The Bank of Japan (BoJ) is currently engaged in an open-ended Quantitative Easing (QE) program. In its simplest rendering, the BoJ starts buying the 10-Year Japanese Government Bond any time that bond’s yield rises to 1% or higher.
It’s possibly the boldest QE program in history: a definitive “line in the sand” drawn by a major central bank as far as bonds are concerned. Again, this is an open-ended, unlimited QE program through which a MAJOR central bank does whatever it takes to keep is country’s bond yields from rising.
However, even this program is proving inadequate.
The BoJ has had to engage in previously unscheduled bond market interventions SIX TIMES in the last month. The below chart needs little explanation. You can see that yields broke above critical resistance in mid-2023 and have gone vertical ever since.
At this point, the BoJ is now having to engage in direct interventions in its bond market more than once a week. And this is happening at a time when the Japanese currency (the Yen) is about to break to new lows.
As I keep warning, the Great Debt Crisis of our lifetimes is fast approaching.
In 2000, the Tech Bubble burst.
In 2007, the Housing Bubble burst.
The Great Debt Bubble burst in 2022. And the crisis is now approaching.
If you’ve yet to take steps to prepare for what’s coming, we just published a new exclusive special report How to Invest During This Bear Market.
It details the #1 investment to own during the bear market as well as how to invest to potentially generate life changing wealth when it ends.
Normally this report would be sold for $249. But we are making it FREE to anyone who joins our Daily Market Commentary Gains Pains & Capital.To pick up your copy, swing by:
2) The October lows at 4,223 (purple line in the chart below).
3) CRITICAL support at 4,200 (blue line in the chart below).
This happened as the yield on the 10-Year U.S. Treasury breached 5% for the first time since 2007. As I’ve noted before, a close above this level would induce a collapse in risk assets, including stocks.
That’s when “someone” or “someones” MANIPULATED the stock market, by PANIC buying stocks, forcing the ENTIRE MARKET up by 35 pts in the span of 40 minutes. From that point until 1PM, every single dip was bought with PANIC buying.
How do we know this was manipulation or an intervention?
NO ONE panic buys stocks the moment they break below critical thresholds. There isn’t a single trading shop or trading team in the world in which the head screams “GO ALL IN ON STOCKS” as soon as the market violates a critical level of support.
In the simplest of terms, the manipulators staved off a crisis… for now. But the fact remains that the U.S. Treasury bubble burst in 2022. And the crisis is now approaching.
If you’ve yet to take steps to prepare for what’s coming, we just published a new exclusive special report How to Invest During This Bear Market.
It details the #1 investment to own during the bear market as well as how to invest to potentially generate life changing wealth when it ends.
Normally this report would be sold for $249. But we are making it FREE to anyone who joins our Daily Market Commentary Gains Pains & Capital.To pick up your copy, swing by:
The yield on the 10-Year U.S. Treasury is about to break 5%.
As the below chart illustrates, this is a major level. Once we take it out, there’s little if any overhead resistance until 5.25% and then 6%.
The 10-Year U.S Treasury is the single most important bond in the world. It is the bond against which all long duration risk assets (real estate, tech stocks, etc) are priced. So if it collapses in a panic (meaning its yields skyrocket) then the ENTIRE financial system will panic.
Stocks are already completely disconnected from the realities of the bond market. They won’t be for much longer if bonds continue breaking down.
Is the Great U.S. Debt Crisis about to begin?
In 2000, the Tech Bubble burst.
In 2007, the Housing Bubble burst.
The U.S. Treasury bubble burst in 2022. And the crisis is now approaching.
Smart investors are already taking steps to prepare for this.
If you’ve yet to take steps to prepare for what’s coming, we just published a new exclusive special report How to Invest During This Bear Market.
It details the #1 investment to own during the bear market as well as how to invest to potentially generate life changing wealth when it ends.
Normally this report would be sold for $249. But we are making it FREE to anyone who joins our Daily Market Commentary Gains Pains & Capital.To pick up your copy, swing by:
The yield on the 2-Year U.S. Treasury hit a new high yesterday.
Why does this matter?
Because…
1) It indicates the Fed’s fight to tame inflation is NOT done.
2) Stocks are in for a world of hurt in the coming months.
Regarding #1, back in May 2023, the 2-Year U.S. Treasury was anticipating that the Fed would have rates at 3.75% in May of 2025. At the time, this meant the Fed would cut rates at least two times before May of 2025 (rates were at 5.25% in May 2023).
Fast forward to today, and the 2-Year U.S. Treasury has just broken out to new highs of 5.20%. This means the market is now anticipating that the Fed will have cut rates possibly ONCE by October of 2025. Moreover, the idea that rates will be ABOVE 5% instead of BELOW 4% in late 2025 is a HECK of a shift.
Put simply, the bond market is figuring out that the Fed will need to keep rates MUCH higher for MUCH longer. And this brings us to #2 in our list above.
Stocks are in for a world of hurt.
Stocks are priced based on Treasury yields. This is one of the primary reasons why stocks remain down almost 10% from their all-time highs despite the fact the economy is growing. After all, if you can earn 5.25% risk free in bonds for two years, why risk putting your money into much riskier stocks where both the earnings yield AND the dividend yield are lower (4.07% and 1.62%, respectively).
The great crisis of our lifetimes is fast approaching.
In 2000, the Tech Bubble burst.
In 2007, the Housing Bubble burst.
The long term U.S. Treasury bubble burst in 2022. And the crisis is now approaching.
Smart investors are already taking steps to prepare for this.
If you’ve yet to take steps to prepare for what’s coming, we just published a new exclusive special report How to Invest During This Bear Market.
It details the #1 investment to own during the bear market as well as how to invest to potentially generate life changing wealth when it ends.
Normally this report would be sold for $249. But we are making it FREE to anyone who joins our Daily Market Commentary Gains Pains & Capital.To pick up your copy, swing by:
The yield on the all-important 10-Year U.S. Treasury is spiking again. As I write this, it’s about to take out its former highs.
There are no shortage of reasons.
First and foremost, Inflation remains HOT.
Mainstream economists have been high-fiving one another because CPI is now 3.7%. Apparently the fact prices are still rising but at a slower pace is some kind of BIG WIN for the Fed. For those of us who live in the real world, the fact that prices are still rising by this much despite the Fed embarking on its most aggressive monetary tightening in decades is not a good thing.
And bond yields know it.
Bond trade based on many things including inflation expectations. In this light, the fact inflation is proving this difficult to slay is yet another reason bond yields are spiking higher: they know the Fed will have to do more.
The second reason why yields are spiking is that there is still too much excess liquidity in the financial system. Banks are still parking over $1.2 TRILLION at the Fed every night. This is a clear signal banks have too much extra capital/ liquidity lying around.
And finally, there’s the the ENORMOUS deficit that the Biden administration has been running since President Biden took office. Indeed, Bidenomics should be renamed SPEND-onomics as the federal government is running its largest deficit as a percentage of GDP outside of WWII.
All this spending requires the Treasury to issue massive amounts of debt. Basic economics tells us that the more of something there is, the less it’s worth. This is why U.S. Treasuries are worth less and hopefully won’t become worthless.
The below chart is truly horrifying. It tells us that the fuse is lit on a $33 trillion debt bomb.
The great debt crisis of our lifetimes is fast approaching.
In 2000, the Tech Bubble burst.
In 2007, the Housing Bubble burst.
The U.S. Treasury bubble burst in 2022. And the crisis is now approaching.
Smart investors are already taking steps to prepare for this.
If you’ve yet to take steps to prepare for what’s coming, we just published a new exclusive special report How to Invest During This Bear Market.
It details the #1 investment to own during the bear market as well as how to invest to potentially generate life changing wealth when it ends.
Normally this report would be sold for $249. But we are making it FREE to anyone who joins our Daily Market Commentary Gains Pains & Capital.To pick up your copy, swing by:
As I noted yesterday, the great debt crisis of out lifetimes is approaching.
The U.S. is now adding debt at an exponential rate. The U.S. racked up its first $10 trillion in debt over the course of 232 years. Following the Great Financial Crisis, it added another $10 trillion in just nine years. The next $10 trillion took only four years.
And by the look of things, the next $10 trillion will take even less than that. The U.S. has added $2 trillion in debt in the last four months. We’re now adding $1.2 billion in debt per hour.
How will this play out?
Well there are three ways to deal with a major debt problem.
1) Pay it back.
2) Inflate it away.
Guess which one policymakers have opted for?
Why did they spend $8 TRILLION in the span of just 24 months from 2020
Why else is the U.S. running its largest fiscal deficit as a percentage of GDP outside of WWII… despite the fact the economy is still growing!?!
Why else is the Fed providing over $1 TRILLION in reverse repo liquidity schemes to the financial system every single night… despite the fact the financial system isn’t in a crisis?!?
If you’ve yet to take steps to prepare for what’s coming, we just published a new exclusive special report How to Invest During This Bear Market.It details the #1 investment to own during the bear market as well as how to invest to potentially generate life changing wealth when it ends.Normally this report would be sold for $249. But we are making it FREE to anyone who joins our Daily Market Commentary Gains Pains & Capital.To pick up your copy, swing by:https://phoenixcapitalmarketing.com/BM.html
The great debt crisis of out lifetimes is approaching.
The U.S. has now reached the point at which it is adding debt at an exponential rate.
It took the U.S. 232 years to rack up its first $10 trillion in debt. Thanks to the Fed’s egregious monetary policies following the Great Financial Crisis, the U.S. added another $10 trillion in debt in just nine years as the government went on a spending spree.
It’s added another $10 trillion in a little over FOUR years, thanks to the insane spending the U.S. implemented following the pandemic.
And the pace is only accelerating.
In June of this year, the U.S. had $31 trillion in debt. Today, it’s over $33 trillion. So we’ve just added another $2 trillion in a little over FOUR MONTHS.
And the Fed is confused as to why U.S. Treasuries are collapsing!?!
Basic economics tells us that the more of something there is… the less value it holds. Small wonder then that as the U.S. issues more and more debt, the debt is collapsing in value.
Below is a chart of the long-term U.S. Treasury ETF (TLT). It needs no explanation.
Again, the great debt crisis of our lifetimes is fast approaching.
In 2000, the Tech Bubble burst.
In 2007, the Housing Bubble burst.
The U.S. Treasury bubble burst in 2022. And the crisis is now approaching.
Smart investors are already taking steps to prepare for this.
I’ve identified a series of market events that unfold before every crash.
I detail them, along with what they’re currently saying about the market today in a Special Investment Report How to Predict a Crash.
Normally this report would be sold for $249. But we are making it FREE to anyone who joins our Daily Market Commentary Gains Pains & Capital.
As usual, everyone is attempting to have an “expert” take on this situation. The reality is that less than one in 10,000 of the people speaking on this stuff have any idea what they are talking about. And unfortunately this goes for the actual experts with degrees and pedigree.
Before listening to anyone opining on this conflict, ask yourself the following three questions:
1) Does this person know what kind of government the country or countries involved has? (parliament, congress, neither, theocracy, etc).
2) Could this person find the countries in question on a map?
3) Can this person name the leaders of the countries in question?
If the answer to all three of these isn’t YES, then ignore anything else this person has to say. If they’re too lazy to even spend five minutes learning the basics, then they’re just another fake guru trying to act like they’re omniscient.
With that in mind, I’m staying in my lane and focusing on the markets today. I’m doing this not because I don’t care about the people under attack, nor is it because I’m insensitive to the situation… I’m doing this because I’m not an expert on the middle east and have nothing to add in the way of quality insights.
What I did note however was the stock market bounced hard from the initial sell-off yesterday and closed out the day at the highs. This is quite bullish given that the geopolitical situation.
From a purely technical analysis situation, stocks bounced HARD off the 200-day moving average, or DMA, as represented by the green line in the chart below. The door is now open to a run to the 50-DMA as represented by the red line in the chart below.
The key however is what happens to bonds.
The bond market was closed yesterday. So we need to assess how bonds act today now that they’re trading again. If yields break to new highs, then something BAD is coming for the stock market in the next few weeks.
Again, everything hinges on what bonds do. Bonds are the reason stocks rallied from 2020 to 2022. They’re the reason stocks crumbled from March 2022 to October 2022. So whatever happens in bonds will dictate what’s coming for stocks.
For more market insights and analysis, join our free daily market commentary Gains Pains & Capital. You’ll immediately start receiving our Chief Market Strategist Graham Summers, MBA’s briefings to your inbox every morning before the market’s open.
And if you sign up today, you’ll also receive a special investment report How to Time a Market Bottomthat the market set-up that has caught the bottoms after the Tech Crash, Housing Bust, and even the 2020 pandemic lows.
This report usually costs $249, but if you join Gains Pains & Capital today, you’ll receive your copy for FREE.
Try as they might, the bears simply couldn’t get it done last week.
The S&P 500 spent a few days chopping around its 200-day moving average (DMA) before spiking higher on Friday. Much of this late week rally was short covering, but the fact remains that sellers simply didn’t have what it took to push stocks any lower.
Indeed, the biggest news as far as stocks were concerned was the fact that the tech-heavy NASDAQ simply refused to take out support at 13,000.
Tech is a long-duration sector of the market… meaning it is heavily influenced by long duration bonds. The reason for this is that your typical tech start-up will take years before it brings a product or service to market and starts generating cash flow. So when you’re modeling a tech company’s future cash flows, you need to be thinking five years out or more. This means comparing a tech company’s future earnings against what you’d earn from owning a risk-free U.S. Treasury over the same time period.
Simply put, the tech sector is heavily influenced by what long-duration bonds do… which is why it’s truly astonishing that the NASDAQ has refused to break down despite the fact the yield on the 10-year U.S. Treasury spiked to new highs. The fact that stock market bears failed to crush tech is really quite bullish and a significant “tell” for the markets.
With all of this in mind, it’s quite possible stocks bottomed last week or will bottom this one. I remain concerned about a number of risks to the markets, but we have to respect price action. And price action tells us that stocks are strong in spite of many issues.
For more market insights and analysis, join our free daily market commentary Gains Pains & Capital. You’ll immediately start receiving our Chief Market Strategist Graham Summers, MBA’s briefings to your inbox every morning before the market’s open. Since 2015, Graham has shown investors a win rate of 75% meaning they made money on three out of every four positions closed.
And if you sign up today, you’ll also receive a special investment report How to Time a Market Bottomthat the market set-up that has caught the bottoms after the Tech Crash, Housing Bust, and even the 2020 pandemic lows.
This report usually costs $249, but if you join Gains Pains & Capital today, you’ll receive your copy for FREE.
Bonds finally bounced yesterday. However, the bounce was relatively weak and didn’t signal the “all clear.”
Simply put, things stabilized. But they didn’t actually improve much. And market leading indicators suggest this correction isn’t over yet.
High yield credit typically leads stocks both the upside and the downside. It bottomed weeks before stocks did in October 2022. And right now, it’s telling us the S&P 500 could easily go to 4,100.
Breadth is another market leading indicator I watch. And it is also telling us stocks are not finished falling just yet. Again, I don’t trust this bounce in stocks at all.
Again, the long-end of the Treasury market has completely collapsed. Banks and financial entities are sitting on hundreds of billions of dollars worth of losses. As I keep warning, the Great Debt Crisis of our lifetimes is fast approaching. The time to prepare is NOW, before it hits.
As I keep warning, the Great Debt Crisis of our lifetimes is fast approaching. The time to prepare is NOW, before it hits.
I’ve identified a series of market events that unfold before every crash.
I detail them, along with what they’re currently saying about the market today in a Special Investment Report How to Predict a Crash.
Normally this report would be sold for $249. But we are making it FREE to anyone who joins our Daily Market Commentary Gains Pains & Capital.
Everyone is applauding the short-term deal to keep the government open for another 45 days.
Well, everyone except the bond market, that is.
The bond market, specifically, the market in U.S. sovereign bonds or Treasuries is the single most important market in the world. Everyone focuses on stocks, because stocks are “exciting” and the best investment for obtaining wealth.
However, the dirty little secret of the investing world is that MOST if not all of the gains from stocks are the result of the bond market. Remember, Treasuries are the bedrock of our current financial system; the yields they pay are the risk free rate of return against which all risk assets (stocks) are priced.
So if bonds blow up, you can kiss the stock market goodbye.
And thanks the the insane amount of spending the Biden administration is engaged in, bonds are about to blow up. Indeed, Bidenomics should really be retitled “debt-o-nomics” because it’s debt, not any kind of economic know-how from the Biden White House that is driving all of this stuff.
Case in point, the U.S. is currently running its largest deficit as a percentage of GDP in history outside of WWII. Bear in mind, this isn’t during a recession. The Biden White House is spending like this while the economy is technically still growing!
Basic economics tells us that the more of something there is, the less value it has. And thanks to the Biden Administration’s spending insanity, the U.S. is issuing a LOT more Treasuries. And that means… you guessed it… Treasuries are being valued as worth less.
Below is a chart you won’t see on CNN or the Mainstream Media. This is a 40+ year chart of the 30-Year U.S. Treasury. If this were a stock, you’d look at this chart and think “GAME OVER.”
As I keep warning, the Great Debt Crisis of our lifetimes is fast approaching. The time to prepare is NOW, before it hits.
I’ve identified a series of market events that unfold before every crash.
I detail them, along with what they’re currently saying about the market today in a Special Investment Report How to Predict a Crash.
Normally this report would be sold for $249. But we are making it FREE to anyone who joins our Daily Market Commentary Gains Pains & Capital.
The Fed didn’t raise rates yesterday. What it did do was update its projected dot plot for where Fed officials expect rates to be in 2024 and 2025.
The Fed now only expects to cut rates twice in 2024, as opposed to four times. In very simple terms, the Fed sent a message that rates will need to be higher for longer to end inflation.
The markets took the news hard with bonds, stocks, and even oil all selling off simultaneously. The yield on the all-important 10-Year U.S. Treasury spiked to new highs.
This is a HUGE deal. As I mentioned in yesterday’s article, this is the bond yield against which all risk assets, especially Tech stocks, are priced. If this yield keeps rising, it means stocks will need to be repriced lower.
High yield credit has already figured this out. Stocks are next.
And God help us if the S&P 500 FINALLY realizes what the long end of the treasury market has been saying for the last few months.
As I keep warning. The Great Debt Crisis of our lifetimes is fast approaching.
If you’ve yet to take steps to prepare for what’s coming, we just published a new exclusive special report How to Invest During This Bear Market.
It details the #1 investment to own during the bear market as well as how to invest to potentially generate life changing wealth when it ends.
Normally this report would be sold for $249. But we are making it FREE to anyone who joins our Daily Market Commentary Gains Pains & Capital.
The most important bond in the world has just broken to a new low.
Our financial system is backed by debt, specifically, U.S. Government debt or Treasuries. These bonds are the senior-most assets in the world, representing the bedrock of our banking system and financial markets. The yield on these bonds represents the risk-free rate of return against which all risk assets (stocks, real estate, oil, etc.).
Now, when we talk about Treasuries, we are actually talking about a series of bonds of different duration ranging from 4-weeks to 30 years. The total list is below.
Treasury Bill Maturation Periods:
4 Weeks
13 Weeks
26 Weeks
52 Weeks
Treasury Note Maturation Periods
2 Years
3 Years
5 Years
7 Years
10 Years
Treasury Bond Maturation Periods
20 Years
30 Years
Of these bonds, the 10-Year U.S. Treasury is the single most important one. The reason for this is that 10 years usually encompasses an entire economic cycle. This is the bond used to determine mortgage rates as well as pricing all longer duration assets (tech stocks).
I mention all of this because the yield on the 10-Year U.S. Treasury has just broken to new highs.
This is a HUGE deal. The risk free rate of return is rising… which means ALL risk assets will be repriced to lower levels in the near future. Small cap stocks, which are closely aligned with the real economy have already figured this out. The S&P 500 will soon follow.
That’s not the worst of it either. As I wrote in yesterday’s article, the Great Debt Crisis of our Lifetimes is fast approaching. I’ll explain precisely how the 10-Year U.S. Treasury fits into that in tomorrow’s article. In the meantime, if you’re looking to prepare yourself and your family for what’s coming, the time to take action is NOW before it hits.
If you’ve yet to take steps to prepare for what’s coming, we just published a new exclusive special report How to Invest During This Bear Market.
It details the #1 investment to own during the bear market as well as how to invest to potentially generate life changing wealth when it ends.
Normally this report would be sold for $249. But we are making it FREE to anyone who joins our Daily Market Commentary Gains Pains & Capital.
The Great Debt Crisis of our lifetimes is approaching.
As S&P Global recently noted, global debt has just hit $300 TRILLION for the first time in history. As if that wasn’t jaw dropping enough, this amount of debt represents 349% of global GDP. If you were to spread out this debt across the world population each man woman and child would owe over $36,000.
Put simply, this is an incomprehensibly massive debt bomb. And inflation has lit the fuse.
You see, bond yields trade based on inflation among other things. So once inflation entered the financial system in 2021, it was only a matter of time before bonds yields began to rise.
Higher bond yields mean greater debt payments. And greater debt payments mean that it the debt becomes more difficult to service. At a yield of 0.25%, you can service $1,000,000 worth of debt for just $2,500. But at a yield of 5%, that same $1,000,000 in debt now costs $50,000 to service.
Again, inflation lit the fuse of our global debt bomb in 2021. And by the look of things, the fuse has almost burned completely away!
Take a look at the below chart and you’ll see what I mean. This is the Invesco 1-30 Laddered Treasury ETF (GOVI). It’s effectively a proxy for the entirety of the U.S. Treasury market. And as you can see, it is now trading at the same level it first hit in 2015, and just barely clinging to critical support.
Once that line gives way, the great debt crisis of our lifetimes will likely begin.
Smart investors are already taking steps to profit from this.
On that note, we are putting together an Executive Summary outlining how to invest when this Everything Bubble bursts.
It will be available exclusively to our clients. If you’d like to have a copy delivered to your inbox when it’s completed, you can join the wait-list here.
While mainstream economists prance around on television claiming that inflation has been defeated, the real data suggests otherwise.
It’s a well known “secret” on Wall Street that the official inflation measure, the Consumer Price Index, or CPI, is heavily massaged to UNDER-state inflation. However, even the CPI, with all of its gimmicks is showing inflation bottomed in June.
In June of 2023, the CPI was 3.0%. It’s now 3.7%. And with oil now above $90 a barrel again, it’s likely going much higher in the coming months. Again, this chart is going in the WRONG way.
The CPI is not the only inflation metric that has rebounded. The Atlanta Fed’s “sticky inflation” metric tracks parts of inflation that are deeply embedded in the financial system. These items are “sticky” meaning that it’s much more difficult for the Fed to get rid of them. And it’s clocking in at 4.7% after dropping below 3% just a few months ago.
That’s quite a rebound.
Indeed, CPI for August clocked in at 3.7% year over year. That sounds decent until you realize that CPI was 3.0% in June. That’s quite a rebound in just two months. And bear in mind, core inflation is still well over 4%!
Take a look at what oil is doing. Does this look like inflation is under control to you?
On that note, we recently outlined a unique “off the radar” investment that could EXPLODE higher as inflation rebounds. We detail this opportunity in a special report called Billionaire’s “Green Gold.”
It details the actions of a family of billionaires who literally made their fortunes investing in inflationary assets. And they just became involved in a mid-cap company that has the potential to TRIPLE in value in the coming months.
Normally this report would be sold for $249. But we are making it FREE to anyone who joins our Daily Market Commentary Gains Pains & Capital.
As I noted a few weeks ago, inflation likely bottomed in July.
By quick way of review, the official inflation metric, the Consumer Price Index or CPI, is measured on a year over year basis. So, when the CPI is 5.5%, for instance, what it’s saying is that prices are 5.5% higher than they were during the same month the year before.
As many pundits have noted, CPI has been declining. What they are failing to recognize however is that the only part of the CPI data that has been declining in 2023 is energy prices. And the reasons for this are:
1) Oil prices collapsed for most of the last 12 months after spiking higher during Russia’s invasion of Ukraine in 1Q22.
2) The Biden administration has dumped ~292 million barrels of oil from the Strategic Petroleum Reserve (SPR) forcing oil prices lower.
You can see this for yourself in the table below. Again, the ONLY parts of the CPI that has dropped significantly are energy prices (well that and used cars and medical devices).
However, this period is now ending. On a year over year basis, energy prices will no longer be down much if at all because we are comparing prices in the purple rectangle to prices in the blue rectangle on a year over year basis. This should result in CPI moving higher.
Indeed, CPI for August clocked in at 3.7% year over year. That sounds decent until you realize that CPI was 3.0% in June. That’s quite a rebound in just two months. And bear in mind, core inflation is still well over 4%!
So again, inflation has bottomed. Some investors will profit beautifully from this. Others will get taken to the cleaners.
On that note, we recently outlined a unique “off the radar” investment that could EXPLODE higher as inflation rebounds. We detail this opportunity in a special report called Billionaire’s “Green Gold.”
It details the actions of a family of billionaires who literally made their fortunes investing in inflationary assets. And they just became involved in a mid-cap company that has the potential to TRIPLE in value in the coming months.
Normally this report would be sold for $249. But we are making it FREE to anyone who joins our Daily Market Commentary Gains Pains & Capital.
Nearly every market collapse follows a particular pattern.
That pattern?
1) Stocks break down below a critical level of support.
2) Stocks rally to “kiss” this former support, failing to reclaim it.
3) Stocks roll over and the real collapse begins.
This pattern is now playing out with the S&P 500.
The S&P 500 first broke below its 50-day moving average (DMA) in August of 2023. This was a significant development as it was the first time the S&P 500 had lost this support since the March 2023 lows. I’ve illustrated this with a blue rectangle in the chart below.
The market then rallied to retest the 50-DMA from below. It briefly broke above this line in early September, but has failed to hold it.This represents the “kiss” as I mentioned earlier: when stocks try to reclaim critical support but fail to do so. I’ve illustrated this with a purple square in the chart below.
What comes next?
Bonds have been telling us for weeks. It’s just a matter of time before stocks “get it.”
If you’ve yet to take steps to prepare for what’s coming, we just published a new exclusive special report How to Invest During This Bear Market.
It details the #1 investment to own during the bear market as well as how to invest to potentially generate life changing wealth when it ends.
Last week, I noted that the Bureau of Labor Statistics (BLS) and other government agencies have been engaging in a strange scheme.
That scheme?
Releasing economic data that initially suggests the economy is booming, only for that same data to be revised downward multiple times in subsequent months.
Some people think the BLS is massaging the data the make Bidenomics look more successful that it really is. Others simply believe that the BLS is using faulty economic models (after all, how accurate is your model if it needs two or three revisions to be correct?).
Regardless of the reason, this issue continues to happen. And investors keep falling for it!
Case in point, last Friday, the BLS released the non farms payroll numbers for August 2023. And once again, you guessed it, the prior months (June and July) were revised lower. And not by a little: June’s NFP number was revised down by 80,000 jobs, while July’s was revised downward by 30,000 jobs.
Bear in mind, June’s initial NFP number of 209,000 had already been revised downward by 24,000 jobs in July. So with this second downward revision of 80,000 jobs, we now know that HALF of the jobs in the June NFP report were FAKE.
104,000 Fake Jobs / 209,000 Jobs Claimed = 49.7% of the jobs were fake.
As I mentioned a moment ago, the August NFP report also revised July’s job numbers down by 30,000. So when we add this to the 104,000 fake jobs “created” in June, we’re now up to 134,000 FAKE jobs being created in the last two months.
As if that wasn’t bad enough, as Bill King noted in his King Report, seasonal adjustments were boosted to make August’s NFP numbers look better. In 2022, the BLS adjusted August’s NFP numbers upward by 47,000. But for some reason, this very same seasonal adjustment accounted for 117,000 jobs.
Put another way, we already know that 70,000 of the 187,000 jobs the BLS claims the economy generated in August were due to a seasonal adjustment, as opposed to being real jobs created in the economy.
Oh, and bear in mind, July’s numbers have only been revised down once thus far. They will likely be revised down again next month. And we can expect a similar thing to happen for August’s NFP numbers as well.
Indeed, as ZeroHedge recently pointed out, these downward revisions have occurred for every single month in 2023 thus far.
Why does all of this matter?
Because investors are pouring billions of dollars of capital into stocks based on those initial jobs numbers. Check out the below chart and you’ll see what I mean.
These folks are in for a RUDE awakening in the coming weeks. The signs are now clear that the economy is slowing. And this is happening at a time when investors are paying 19 times forward earnings for stocks!
The only time stocks were previously this richly valued was when A) the economy was expanding rapidly and B) the Fed was printing trillions of dollars in new month.
Today the economy is rolling over… and the Fed is DRAINING liquidity from the financial system. So again, investors are buying stocks based on a fantasy.
If you’ve yet to take steps to prepare for what’s coming, we just published a new exclusive special report How to Invest During This Bear Market.
It details the #1 investment to own during the bear market as well as how to invest to potentially generate life changing wealth when it ends.
One of the hallmarks of the Biden Presidency is that economic data is released that looks fantastic at first glance… only to then be revised much lower in subsequent months.
Conspiracy theorists believe this indicates that the Bureau of Labor Statistics (BLS) and other bean-counter agencies are massaging the data to make the economy look better than it is in order to push a narrative that Bidenomics works. Other people simply believe that the reason data is continually being revised lower is because the economic models the BLS and other agencies use are garbage with little value (after all, how great can the model be if it needs to be revised two or three times to get an accurate number).
Regardless of the reason this is happening, the impact is the same: investors are buying stocks based on a fantasy that the economy is booming.
The formula is as follows:
1) The initial data released about jobs or GDP or some other metric looks quite strong.
2) Investors pile into stocks based on the notion that the economy is booming.
3) The data is revised lower, usually more than once.
The key item here is that investors DON’T sell stocks at a later date based on the downward revisions… in fact, few if any investors even bother keeping track of this stuff. And that’s the problem: people are buying based on the illusion of strong economic growth when in reality the growth is much weaker if not indicative of contraction!
As Zerohedge noted a few days ago, the monthly payrolls report has been revised lower every single month in 2023. Again, this is not just one or two months with downward revisions… it’s every. single. month.
Now, you could easily argue that these downward revisions are simply because the BLS’s models are useless, but that’s missing the point: the headline data, or the data that investors use to justify buying stocks at 19 times forward earnings, is WRONG.
In fact, if we dig into less popular data that isn’t broadcast by the financial media, we get a VERY DIFFERENT picture of the U.S. economy.
Take a look at the official job openings data taken from the Federal Reserve. Again, this is official data showing how many jobs are currently available in the U.S. economy. If the economy is booming and businesses are hiring people to expand their operations, why is this number cratering in ways usually associated with a recession.
Meanwhile, investors are bidding stocks higher and higher. As I write this, the stock market is priced at 19 times forward earnings. The only time stocks are this richly valued is when A) the economy is expanding rapidly and B) the Fed is printing trillions of dollars in new month.
Today the economy is rolling over… and the Fed is DRAINING liquidity from the financial system. So again, investors are buying stocks based on a fantasy.
If you’ve yet to take steps to prepare for what’s coming, we just published a new exclusive special report How to Invest During This Bear Market.
It details the #1 investment to own during the bear market as well as how to invest to potentially generate life changing wealth when it ends.
If longer duration Treasury yields continue to drop, then stocks will find a bottom of sorts. But if Treasury yields continue to rise, particularly on the all-important 10-Year U.S. Treasury, then stocks will be repriced to much lower levels.
As the below chart from Dr Ed Yardeni illustrates, the S&P 500 is currently trading at around 19 times forward earnings. This is an extremely RICH valuation given that the yield on the 10-Year U.S. Treasury is around 4.25%.
Consider that the last time stocks were this richly valued was early 2022 BEFORE the Fed started tightening monetary policy. At that time, the yield on the 10-Year U.S. Treasury was around ~2%. Obviously corporate earnings are now much higher, but the point is that the stock market is priced at a VERY high multiple given where the risk-free rate of return is trading right now.
Something has to give. Either Treasury yields are about to drop hard… or stocks will collapse. And smart investors who are properly positioned for this will see extraordinary returns.
If you’ve yet to take steps to prepare for what’s coming, we just published a new exclusive special report How to Invest During This Bear Market.
It details the #1 investment to own during the bear market as well as how to invest to potentially generate life changing wealth when it ends.
Ever since the U.S. abandoned the Gold Standard in 1971, U.S. debt, also called Treasuries have become the bedrock of our financial system.
Put in the very simplest of terms, Treasuries are the senior most asset class, with their yields representing the “risk free” rate of return against which all risk assets (stocks, real estate, commodities, etc.) are priced.
Treasury yields are the reason stocks exploded higher from the April 2020 lows. They are also the reason stocks peaked and began a bear market in March 2022. And they are the reason stocks bottomed in October 2022, igniting one of the best bull runs in recent history.
I mention all of this because the yield on the 10-Year U.S. Treasury, which is the single most important bond in the world, has recently hit new highs. And if it doesn’t stop right here and now, stocks are primed for a major collapse.
How major?
The last time the yield on the 10-Year U.S. Treasury was at its current level, the S&P 500 was trading at 3,600. Today it’s at 4,400.
See for yourself.
Sure, stocks might hold up with Treasury yields at these levels for a time. But the clock is ticking. And it’s only a matter of time before we get a NASTY risk off move.
If you’ve yet to take steps to prepare for what’s coming, we just published a new exclusive special report How to Invest During This Bear Market.
It details the #1 investment to own during the bear market as well as how to invest to potentially generate life changing wealth when it ends.
The Tech ETF (XLK) is at major support at $166. Even if this is not THE low, it’s a decent spot for a bounce as XLK rallies to $175 or so as it carves out a potential right shoulder in a Head and Shoulders pattern.
Moreover, the yield on the 10-Year U.S. Treasury is at major resistance.
Tech is a long-duration play, meaning it is heavily affected by the yield on longer-term Treasuries. The odds of the yield on the 10-Year U.S. Treasury breaking above its current levels right here and now are not high. This suggests the next move for this yield would be down, which would alleviate some of the pressure on tech stocks.
Given that the S&P 500 is heavily weighted towards tech (the sector accounts for 28% of the index’s weight) all of the above items suggest a bounce in tech and the broader market here. Again, this is just a short-term idea.
In the big picture however, my proprietary Bull Market Trigger is about to register its first “buy” in over a decade.
This signal has only registered TWO times in the last 25 years: in 2003 and 2010. And it’s close to registering a new signal today,
If you’ve yet to take steps to prepare for invest accordingly, we have published an exclusive special report How to Time a Market Bottom.
It details the my proprietary bull market trigger, how stocks have performed following prior signals, and what it is stating right now.
Normally this report would be sold for $249. But we are making it FREE to anyone who joins our Daily Market Commentary Gains Pains & Capital.
Nothing has changed in the U.S. in the last month.
The primary framework for investing in the U.S. is as follows:
1) The stock market is bubbling up due to:
a. There being too much liquidity in the financial system.
b. Inflation, particularly core inflation remains elevated (4.8%).
c. Stocks are a better inflation hedge that bonds or cash.
2) The U.S. economy isn’t growing rapidly, but it’s not contracting either.
a. The Atlanta Fed’s GDP Now metric shows economic growth of 2.4%.
b. The Federal government is running its largest deficit as a percentage of GDP in history outside of wartime/ a recession. Much of this deficit is going towards social programs and stimulus measures.
c. Social spending and economic stimulus measures will continue if not increase as we head into the 2024 Presidential election.
d. The recent debt ceiling deal removes all spending caps through the 2024 election.
Put simply we are in a situation in which nothing is going great, but pretty much everything is going OK. Inflation remains high, but it has come down from its peak. The economy is still growing, albeit at a sub-3% pace. And there is ample liquidity in the financial system.
All of this is generally “risk on” for the markets… which means this situation will continue until something significant breaks. This doesn’t mean that stocks won’t correct or ever fall in price again. But it does mean that we are likely in a new bull market and that things will continue to be in “risk on” mode until something major breaks.
Regarding the potential for a recession, the yield curve, particularly the all-important 2s10s (what you get when you subtract the yield of the 2-Year U.S. Treasury from the yield of the 10-Year U.S. Treasury) remains extremely inverted.
This has predicted every recession since 1955. However, the actual recession doesn’t hit until this dis-inverts, meaning it moves back into positive territory. And as the below chart shows, it can take months if not years for the yield curve to dis-invert once it becomes inverted.
Put simply, until this chart moves back into positive territory, this is just a warning that a recession is coming eventually. Nothing more.
So again, there are red flags in the financial system today, but these are warnings not signals that it’s time to get REALLY bearish. The purpose of investing is to make money, not miss out on gains because of a warning. So we ride this bull run for as long as we can until it ends.
Indeed, my proprietary Bull Market Trigger is about to register its first “buy” in over a decade.
This signal has only registered TWO times in the last 25 years: in 2003 and 2010. And it’s close to registering a new signal today,
If you’ve yet to take steps to prepare for invest accordingly, we have published an exclusive special report How to Time a Market Bottom.
It details the my proprietary bull market trigger, how stocks have performed following prior signals, and what it is stating right now.
Normally this report would be sold for $249. But we are making it FREE to anyone who joins our Daily Market Commentary Gains Pains & Capital.
Everything changed for the financial system in March 2023.
What happened then?
The Fed and the Treasury implemented a backdoor bailout of the banking system.
If you’ll recall, in late February/ early March 2023, a number of smaller/ regional banks failed in the U.S. While we say these banks were “small” in comparison to the mega banks like JP Morgan or Wells Fargo, the reality is that when Silicon Valley bank, Signature Bank, and First Republic bank failed, they represented three of the largest bank failures in U.S. history.
Why were these banks failing?
Two reasons:
1) The banks were only paying 0.3% on deposits at a time when depositors could earn 4% or even 5% in a money market fund or short-term Treasuries. So people were pulling their money out of the banks in droves.
2) The banks were sitting on hundreds of billions of dollars’ worth of unrealized losses on their longer-duration assets (mid to long-term treasuries and loans) courtesy of inflation forcing these bonds to collapse.
Now, investor confidence is a strange thing. Both of the above issues were common knowledge as early as November 2022, but for whatever reason, investors chose to ignore them and give regional banks the benefit of the doubt until late February 2023,
Then Silicon Valley bank, Signature Bank, and First Republic failed, and investors began to panic, dumping regional bank shares. Banks’ share prices were falling 10%, 20% even 50% in a single day. And in early March 2023, it appeared as if the U.S. was mere days away from a full-scale banking crisis.
That’s when the Fed and the Treasury jumped in…
The Treasury, acting with the Federal Deposit Insurance Corporation (FDIC) moved to assure depositors that their money was safe, offering to backstop ALL deposits above the usual $250,000 that is insured by the FDIC.
Simultaneously, the Fed pumped nearly $400 billion into the financial system in the span of three weeks.
The Fed also opened a backdoor bailout scheme to funnel nearly $100 billion to the banks.
And that’s when everything changed for the stock market. Stocks bottomed and haven’t looked back.
Below is a weekly chart for the S&P 500 year to date. Each of those candles represent the price action of a given week. White candles represent up weeks and black candles represent down weeks.
As you can see, the last major black candle occurred in late February/ early March 2023 during the regional banks’ issues. Since that time, the market has closed UP for 13 of the last 19 weeks. And of the six down weeks, only two were significant; the other four we all bought aggressively, with stocks reclaiming most of the initial losses by the time the week ended.
I’ve illustrated the two significant down weeks with blue circles in the chart below. Note that the other four down weeks were either down only slightly (purple circles) or saw the market ramp hard off the lows (red circles).
In the simplest of terms, everything changed for stocks in early March 2023. Since that time, the markets are back into “bubble mode” with everything soaring. Companies like Sirius XM Holdings have saw their share price DOUBLE in the span of a week. Meanwhile Carvana is up 700%!
Bearing all of this in mind, smart investors are asking, “what’s next? Will the Fed continue to pump the markets into an even larger bubble, or is this whole mess going to come crashing down?”
I’ll detail my thoughts on this in tomorrow’s article. In the meantime, we recently outlined a unique “of the radar” investment that will could EXPLODE higher as due to the Fed’s money printing. We detail this investment in an investment report called Billionaire’s “Green Gold.”
It details the actions of a family of billionaires who literally made their fortunes investing in inflationary assets. And they just became involved in a mid-cap company that has the potential to TRIPLE in value in the coming months.
Normally this report would be sold for $249. But we are making it FREE to anyone who joins our Daily Market Commentary Gains Pains & Capital.
The Fed has raised interest rates from 0.25% to 5.25% in the span of 16 months.
And yet…inflation has yet to disappear in any significant fashion.
As I noted earlier this week, the ONLY data points in the CPI that are DOWN year over year are energy prices. When you strip out energy and food prices you find that core CPI is only slightly down. As I write this, it’s still clocking in at 4.8%… after fluctuating around 5% for most of 2023.
Moreover, asset inflation is out of control.
Stocks are less than 5% off their all time highs, despite one of the most aggressive rate hike cycles in history!
While financial conditions are roughly as loose as they were BEFORE the Fed started raising rates!
What’s going on here?
What’s going on is that the Fed is repeating the same mistake it initially made during the last major inflationary bout in the U.S. in the 1970s: focusing on rate hikes as opposed to draining excess reserves/ liquidity from the financial system.
During the first round of inflation from 1972-1975, the official inflation measure, the Consumer Price Index or CPI, rose from 3.3% to 11.1%. During this period, the Fed, chaired by Arthur Burns, attempted to rein in inflation using rate hikes. This succeeded in triggering a recession, but failed to end inflation: CPI only fell to 5.7% in 1976 before rebounding and eventually peaking at 13% in 1980.
Burns was replaced William Miller as Fed Chair in 1978, but Miller only lasted a year, as his efforts to end inflation proved similarly futile: the Fed raised rates from 6.75% to 10.5% during Miller’s tenure, but inflation continued to rise from 7.6% to 11.3%
It was only when Paul Volcker took the reins as Fed Chair in August 1979 that things changed. Volcker shifted the Fed’s focus from rate hikes to draining excess reserves/ liquidity from the financial system. The goal was to remove the froth from the financial system, while letting rates move in a wider range in order to tighten policy to the point that inflation finally disappeared.
The effect was a severe recession (July 1981-November 1982), but CPI also came down, eventually falling to ~3% in 1983.
The below chart of CPI in the 1970s is clear: rate hikes didn’t end inflation… but draining excess reserves did.
Unfortunately for us today, the Fed is repeating the EXACT same mistake it made from 1972-1979. And those investors who are properly positioned to profit from this mistake will do extremely well as I’ll outline in tomorrow’s article.
In the meantime, if you’re in the market for someone who can help you profit from the Fed’s blunders, I can help you not only thrive but achieve tremendous financial success.
This opens the door to some VERY inflationary surprises in the near future. And those who are positioned to profit from this could see some absolutely stunning returns.
We recently outlined a unique “of the radar” investment that will could EXPLODE higher as inflation turns back up. We detail this investment in an investment report called Billionaire’s “Green Gold.”
It details the actions of a family of billionaires who literally made their fortunes investing in inflationary assets. And they just became involved in a mid-cap company that has the potential to TRIPLE in value in the coming months.
Normally this report would be sold for $249. But we are making it FREE to anyone who joins our Daily Market Commentary Gains Pains & Capital.
Yesterday, I noted that inflation has very likely bottomed for 2023.
No one in the media is discussing this, but the only parts of the inflation data that is actually falling are energy prices.
See for yourself.
Everything else is still going UP in price, though the pace is slower (this doesn’t stop the media from claiming inflation is falling though).
However, by the look of things, energy prices are bottoming here, particularly in Year over Year comparables.
You see, the inflation data published in the U.S. is based on year over year comparisons. When the Consumer Price Index (CPI) comes out at 5%, what it’s really stating is that a basket of goods and services costs ~5% more currently than it did a year ago.
This is called the base effect: a comparison between two data points in which the current one is expressed as a ratio of the older one. And it can result in some pretty strange circumstances if you’re not careful.
Situations like the one we’re in today.
Let’s wind the clocks back to the first quarter of 2022. Oil prices were rising rapidly due to inflation as the Fed had yet to end its Quantitative Easing (QE) program, let alone raise interest rates. Then Russia invaded Ukraine, and oil spiked even higher to $130 a barrel as the financial world grew terrified of large-scale oil production disruptions.
I’ve illustrated this time period on the below chart of oil prices with a red rectangle.
The rise in oil prices then halted as it became clear that Russia’s war with Ukraine wouldn’t disrupt global oil production by much if at all (Russia would continue selling oil via back-channels to India and other countries). Another factor that stopped oil prices from rising was the fact the Biden administration dumped 292 million barrels of oil on the market by draining the Strategic Petroleum Reserve (SPR).
I’ve been accused of playing politics with this data point, but the chart is clear. President Biden took office in January 2021. At that time the SPR had 638 million barrels of oil. What followed was the largest drop in the SPR’s history, with the SPR declining to 346 million barrels of oil where it sits today. That is a decline of 292 MILLION barrels of oil.
Add it all up, and the end result is that since June 2022, oil prices have declined from $130 a barrel down to the upper $60s/ lower $70s per barrel. The result of this, as far as the CPI is concerned, is that on a year over year basis, for the entirety of 1H23, we have been comparing oil prices in the blue rectangle to oil prices in the red rectangle. As a result of this, energy inflation is down sharply.
This trend is now ending as we work our way into the second half of 2023. Going forward, oil prices on a year over year basis will be compared to the prices in the red rectangle in the chart below.
Put simply, on a year over year basis, the massive drop in energy prices that has lowered overall CPI considerably will be ending. And since energy prices are the ONLY part of the CPI data that has been declining… it is highly likely that the inflation data is bottoming here… or at the very least, won’t be declining much more.
This opens the door to some VERY inflationary surprises in the near future. And those who are positioned to profit from this could see some absolutely stunning returns.
We recently outlined a unique “of the radar” investment that will could EXPLODE higher as inflation turns back up. We detail this investment in an investment report called Billionaire’s “Green Gold.”
It details the actions of a family of billionaires who literally made their fortunes investing in inflationary assets. And they just became involved in a mid-cap company that has the potential to TRIPLE in value in the coming months.
Normally this report would be sold for $249. But we are making it FREE to anyone who joins our Daily Market Commentary Gains Pains & Capital.
The inflation data published in the U.S. is based on year over year comparisons. When the Consumer Price Index (CPI) comes out at 5%, what it’s really stating is that a basket of goods and services costs ~5% more currently than it did a year ago.
This is called the base effect: a comparison between two data points in which the current one is expressed as a ratio of the older one. And it can result in some pretty strange circumstances if you’re not careful.
Situations like the one we’re in today.
For most of the first half of 2023, inflation, as measured by the year over year comparison for the CPI has been trending down. However, as I’ve noted repeatedly, the only part of the inflationary data that is declining is energy prices (well that and used car prices).
See for yourself.
I mention this, because it is increasingly looking as though oil prices have bottomed.
Oil has spent much of the last 18 months in a downtrend. But that downtrend is about to be broke.
If oil prices rip higher from here, then the inflationary data will begin to turn back upwards. Remember, energy prices are the ONLY part of the CPI that are DOWN. The price of everything else continues to RISE, albeit a slower rate.
Many investors will be caught offsides here. Don’t be one of them!
We recently outlined a unique “of the radar” investment that will could EXPLODE higher as inflation turns back up. We detail this investment in an investment report called Billionaire’s “Green Gold.”
It details the actions of a family of billionaires who literally made their fortunes investing in inflationary assets. And they just became involved in a mid-cap company that has the potential to TRIPLE in value in the coming months.
Normally this report would be sold for $249. But we are making it FREE to anyone who joins our Daily Market Commentary Gains Pains & Capital.
The greenback peaked in October 2022. After plunging some 11% from October 2022 to January 2023, the $USD has since been moving in a range or what trader’s would call a “consolidation phase.”
There are a couple key issues to consider when you look at a consolidation phase. They are:
1) How long it lasts.
2) Whether the eventual breakout is a continuation or a reversal of the prior trend.
Regarding #1, the length of a consolidation phase is closely correlated with the significance of the eventual breakout: the longer the consolidation phase, the more significant the breakout.
In the case of the $USD, it’s been in a consolidation phase for SIX MONTHS. That is a significant length of time. And it tells us that the eventual breakout is of major importance.
Regarding #2, it’s critical to note whether an eventual breakout continues the trend the asset was in prior to consolidating or whether it reverses said trend. If the breakout is a continuation, then the asset is in a MAJOR trend, and the consolidation was simply a kind of “breather” between major moves.
That appears to be the case with the $USD today. The trend was down before it began consolidating. And now it is breaking down in a big way. This suggests that the $USD is in a MAJOR downtrend that will last for some time.
Finally, remember we are talking about the $USD here… arguably the most important asset in the world. This breakdown will have a MAJOR impact on the markets, particularly those that benefit from higher inflation/ a weaker $USD.
We recently outlined one such investment that should benefit GREATLY from a weaker $USD in an investment report called Billionaire’s “Green Gold.”
It details the actions of a family of billionaires who literally made their fortunes investing in assets that outperform during this kind of environment. And they just became involved in a mid-cap company that has the potential to TRIPLE in value in the coming months.
Normally this report would be sold for $249. But we are making it FREE to anyone who joins our Daily Market Commentary Gains Pains & Capital.
We continue to receive signals that the U.S. is an emerging market.
One of the hallmarks of emerging markets, particularly banana republics, is that politically connected businesses are treated like royalty while everyone else gets screwed over.
This theme was on full display last week when JP Morgan reported its “outstanding” results. JPM reported record Net Interest Income that was boosted by the fact that the bank was given First Republic’s profitable assets for pennies on the dollar.
But who picked up the losses? After all, First Republic failed!
You did. So did I and the rest of the public.
The Federal Deposit Insurance Corporation (FDIC), which is part of the government that taxpayers fund, absorbed most of First Republic’s losses. Oh, and the FDIC also gave JP Morgan a $50 BILLION line of credit as part of the deal.
How sweet was this deal?
JP Morgan immediately reported a one time gain of $2.6 billion as soon as the deal closed. And it is expected to make $500 million per year from the assets it bought for pennies on the dollar.
These kinds of sweetheart deals that benefit the connected while burdening everyone else are common in emerging markets. To be clear, the U.S. has had them for a long time as well. But they only reached “3rd world banana republic” levels after 2008 once the Wall Street bailouts went from being the exception to the rule.
Indeed, things have become so egregious as far as fraud, waste, and abuse are concerned that the head of the Small Business Administration (SBA) didn’t even bother showing up to a hearing on fraud related to COVID-19 loans.
By the way, the fraud in question is $200 BILLION.
Sweetheart deals that favor the connected and screw everyone else? Administration officials who don’t even bother showing up for meetings concerning hundreds of billions of dollars in government funded fraud?
These are 3rd world, banana republic type issues. The fact that the U.S. can’t go a week without some new example of this stuff tells us just how far down the toilet the system has gotten.
aving said that, this kind of tectonic shift represents a “once in a lifetime” opportunity. Some investments are going to produce fortunes. Others will lose money for years… if not decades. And those investors who are positioned correctly for this will thrive while others struggle.
We recently outlined a unique “of the radar” investment that will outperform in this new economic landscape in an investment report called Billionaire’s “Green Gold.”
It details the actions of a family of billionaires who literally made their fortunes investing in emerging markets. And they just became involved in a mid-cap company that has the potential to TRIPLE in value in the coming months.
Normally this report would be sold for $249. But we are making it FREE to anyone who joins our Daily Market Commentary Gains Pains & Capital.
As I keep emphasizing, the U.S. is becoming an emerging market.
Two of the hallmarks of emerging markets are a weak domestic currency and higher inflation. While neither of these are good for those living in the nation, they do make the performance in the domestic stock market look fantastic.
Case in point, take a look at the South Africa stock market’s performance over the last 20 years.
Nothing special, right? It’s effectively been moving sideways since 2010.
Well, a big reason for that is that the above chart is priced in $USD. Watch what happens when we price South Africa’s stock market in its domestic currency, the Rand.
A similar dynamic is playing out today in the U.S.
The S&P 500 look wonderfully bullish. After all, it bottomed in October 2022 and since been roaring higher ever since.
However, much of this performance stems from the fact that the S&P 500 is priced in our domestic currency, the $USD, which has been extremely weak.
Watch what happens when we price the S&P 500 is another, stronger currency like the Euro.
Not quite some fantastic anymore is it? In fact, the S&P 500 priced in Euros has effectively been trading sideways for most of 2023.
Put simply, a major reason why the S&P 500 has done so well since October 2022 is because it’s priced in $USD. And the $USD has been dropping like a stone.
Again, this is the hallmark of an emerging market.
If you’re an individual investor trying to navigate this market, the framework that worked for investing in the U.S. from 1940 until today is over. You’re no longer investing in a developed nation… you’re investing in an emerging market.
Having said that, this kind of tectonic shift represents a “once in a lifetime” opportunity. Some investments are going to produce fortunes. Others will lose money for years… if not decades. And those investors who are positioned correctly for this will thrive while others struggle.
We recently outlined a unique “of the radar” investment that will outperform in this new economic landscape in an investment report called Billionaire’s “Green Gold.”
It details the actions of a family of billionaires who literally made their fortunes investing in emerging markets. And they just became involved in a mid-cap company that has the potential to TRIPLE in value in the coming months.
Normally this report would be sold for $249. But we are making it FREE to anyone who joins our Daily Market Commentary Gains Pains & Capital.
If you missed it, my main point was this: the U.S. is now an emerging market. And it’s getting downright embarrassing.
Last week our Secretary of the Treasury, Janet Yellen, arguably the most important financial figure in our country, and the person in charge of managing the U.S. dollar/ financial system, groveled in front of China’s Vice Premiere He Lifeng during her visit to China
Ms. Yellen bowed repeatedly to the Vice Premiere, groveling much as an emerging market financial official would kowtow to his or her counterpart from a more developed, superior nation upon which the former’s nation relied for aid/ support/ assistance.
See for yourself. And mind you, this is one of NUMEROUS bows.
I wish this was the worst thing about the current state of incompetence for financial/ economic leaders in the U.S., but unfortunately, it’s not.
No, far worse is the fact that our central bank, the Federal Reserve, or the Fed for short, has become a political entity, as is often the case in emerging markets/ banana republics.
Let me explain.
The Fed, as per its Dual Mandate, is meant to focus on just two things: inflation and employment.
That’s the law. And for most of the last 100+ years, the Fed did focus on these issues above anything else.
No longer.
The Powell Fed is a den of corruption, incompetence, and political activism. In the last few years we’ve witnessed:
1) Scandals in which senior Fed officials were caught trading around Fed announcements. This is insider trading on a banana republic level!
2) The Fed ignoring literally HUNDREDS of signals that inflation was out of control… while still printing over $1 trillion per year and paying billions of dollars to banks.
3) The creation of the worst inflationary storm in 40+ years, all due to Fed incompetence (how did the Fed’s 400+ Economics PhDs and 150 research associates miss that inflation had arrived in 2020-2022!?!)
4) Fed Presidents pushing social justice issues openly in speeches. It’s one thing for them to discuss these things in private. It’s something else entirely for them to push for policies to address climate change, social justice, and other item as FED OFFICIALS.
5) The Fed testing the banking system for “Climate Change Risks.” Mind you, this is the same Fed that didn’t see the regional banking crisis coming, resulting in several of the largest bank failures in history.
All of the above would be downright hilarious, if the damage they inflicted on ordinary Americans wasn’t so devastating.
Let me be blunt here…
Few if any of us got rich during the pandemic. Multiple Fed officials did by trading on insider information. By the way, this continues today, with at least one Fed President caught actively trading during Fed “black out” periods when it’s illegal to do so. He wasn’t fired or forced to resign either.
Similarly, inflation has taken a heavy toll on Americans. And yet, NONE of the Fed officials who ignored the countless signals that inflation was appearing in 2020-2022 have been fired. And why would they? These are politically connected academics who haven’t worked in the private sector in years, if ever!
Again, the U.S. is an emerging market. All the signs are there: abject corruption, incompetence, politicizing everything, etc. The U.S. that existed from the 1940s until the mid-’00s is gone forever. And most of us are now on our own to navigate this new environment.
The only good thing that will come from this is that if you know how to invest in emerging market regimes, you can stand to make a fortune in the coming years.
Indeed, this kind of tectonic shift represents a “once in a lifetime” opportunity. Some investments are going to produce fortunes. Others will lose money for years… if not decades. And those investors who are positioned correctly for this will thrive while others struggle.
We recently outlined a unique “of the radar” investment that will outperform in this new economic landscape in an investment report called Billionaire’s “Green Gold.”
It details the actions of a family of billionaires who literally made their fortunes investing in emerging markets. And they just became involved in a mid-cap company that has the potential to TRIPLE in value in the coming months.
Normally this report would be sold for $249. But we are making it FREE to anyone who joins our Daily Market Commentary Gains Pains & Capital.
Last week I noted that the U.S. is becoming an emerging market.
By quick way of review:
1) Many of the most important institutions in the U.S. now exhibit a level of corruption that is normal for banana republics. We now see these institutions doing everything from interfering in elections to arresting political opponents and more. The individuals who do this are not punished, if anything they given book deals and TV slots.
2) The U.S. no longer has a clear rule of law. Those with the correct political leanings and connections can avoid jail time for serious crimes, even treason. Meanwhile, those on the other side of the political spectrum are given lengthy sentences for minor transgressions.
3) The U.S. economy is no longer a manufacturing/ industrial leader. Decades of outsourcing have gutted the middle class resulting in the kind of wealth disparities you usually see in emerging markets. American children dream of becoming influencers or social media personalities instead of business owners or innovators.
It’s enough to make you sick.
Indeed, the “U.S. is an emerging market” theme was on full display last week when our Secretary of the Treasury, Janet Yellen, arguably the most important financial figure in our country, and the person in charge of managing the U.S. dollar/ financial system, groveled in front of China’s Vice Premiere He Lifeng during her visit to China
Ms. Yellen bowed repeatedly to the Vice Premiere, groveling much as an emerging market financial official would kowtow to his or her counterpart from a more developed, superior nation upon which the former’s nation relied for aid/ support/ assistance.
See for yourself. And mind you, this is one of NUMEROUS bows.
Again, this is the thing of emerging markets. And the fact that the person who manages our finances and currency is this incompetent/ embarrassing illustrates clearly just how far the U.S. has sunk.
The only good thing that will come from this is that if you know how to invest in emerging market regimes, you can stand to make a fortune in the coming years.
Indeed, this kind of tectonic shift represents a “once in a lifetime” opportunity. Some investments are going to produce fortunes. Others will lose money for years… if not decades. And those investors who are positioned correctly for this will thrive while others struggle.
We recently outlined a unique “of the radar” investment that will outperform in this new economic landscape in an investment report called Billionaire’s “Green Gold.”
It details the actions of a family of billionaires who literally made their fortunes investing in emerging markets. And they just became involved in a mid-cap company that has the potential to TRIPLE in value in the coming months.
Normally this report would be sold for $249. But we are making it FREE to anyone who joins our Daily Market Commentary Gains Pains & Capital.
As I’ve noted in our last two articles, the $USD has begun a significant decline against most major currencies (the Euro, the Pound and the Franc). And the only reason it is showing relative strength against the Yen is because Japan’s central bank continues to ease monetary conditions.
What’s happening here? The $USD should be performing well based on interest rates as well as how far along the U.S.’s central bank is in its fight against inflation.
I believe what is happening is that the world is increasingly aware that the U.S. has become an emerging market.
Historically, the U.S. was held up as the eminent developed nation with strong and stable institutions, the Rule of Law, and a dynamic economy.
No longer.
It is now clear that many of our most significant institutions in the U.S. are corrupt. And I’m not talking about the typical corruption one can assume from any organization involving people and power. I’m talking about 3rd world, banana republic levels of corruption, e.g. interfering with elections, jailing political adversaries, censoring free speech, etc.
Similarly, the Rule of Law in the U.S. is now more of a catch phrase than a reality. There are clear double standards applied on a local, state and federal level when it comes to the law. The politically connected/ chosen can commit everything from felonies to outright treason with little if any jail time. And in many cases, those involved in undermining their political adversaries even when it was illegal/ treasonous received book deals and prime time TV slots as opposed to going to prison.
Again, this the domain of 3rd world banana republics.
The U.S. economy has similarly entered a state of secular decline. The U.S. once was the manufacturing/ industrial capital of the world. It’s now a hollowed out, socialist economy that relies on other regimes (many of them hostile to the U.S.) for its resources and economic needs.
More and more Americans are paid simply to not work. Of those that do work, many take no pride in their efforts. It has become a running joke to post videos of goofing off at the office/ pretending to work/ faking productivity. Anyone who runs a business knows how hard it is to find committed, hard working people.
Perhaps nowhere are the above issues as obvious as in the U.S.’s financial status.
The U.S. now has a Debt to GDP ratio of over 120%. The government is running the largest peacetime deficit relative to GDP in history. Is the government trying to rein this in? Not in the slightest. The new Debt Deal removes all spending cuts through 2024.
Meanwhile, basic services (roads, bridges, etc) are crumbling. Go to any major U.S. airport or drive down any major U.S. highway and you’re looking at something that was a high quality/ top of the line project back in the 1950s.
Abject corruption, a lack of the Rule of Law, massive debt, massive deficits, crumbling infrastructure. These are the hallmarks of an emerging market. So is it any surprise that the U.S. dollar is behaving like an emerging market currency?
I’m not saying that other currencies/ economies are much better (if better at all)… I’m simply noting that the U.S. is far worse than ever before. On a relative basis, all of the things that made the U.S. an exceptional place are now of questionable quality/ credibility.
So why wouldn’t the U.S. currency be the same? Why wouldn’t the $USD become weaker, lose more and more purchasing power, and ultimately no longer serve as a storehouse of value?
For those of you who are upset by all of this, it’s time to take your financial future into your own hands
Indeed, this kind of tectonic shift represents a “once in a lifetime” opportunity. Some investments are going to produce fortunes. Others will lose money for years… if not decades. And those investors who are positioned correctly for this will thrive while others struggle.
We recently outlined a unique “of the radar” investment that will outperform in this new economic landscape in an investment report called Billionaire’s “Green Gold.”
It details the actions of a family of billionaires who literally made their fortunes investing in emerging markets. And they just became involved in a mid-cap company that has the potential to TRIPLE in value in the coming months.
Normally this report would be sold for $249. But we are making it FREE to anyone who joins our Daily Market Commentary Gains Pains & Capital.
Politics are a full contact sport that brings out the ugliest aspects of human nature. And the political environment today is more toxic than at any other time in my lifetime.
Unfortunately for investors, the President and his/her agenda for the economy has a MAJOR impact on the markets. For those of us who want to make money from our investments, we have to address recent political events.
With that in mind, it is clear that Donald Trump will be the next U.S. President.
The attempted assassination of former President has horrified and disgusted every decent person in this country. And it is guaranteed two things:
1) Joe Biden will NOT be leaving the race.
2) Donald Trump is going to win the election.
Regarding #1, following a terrible debate performance, President Biden has been struggling to maintain any kind of lead in the polls. Questions abound about the true state of the President’s cognitive/ physical health, resulting in multiple Democrat leaders and mega-donors calling on the President to step down and allow another candidate on the 2024 ticket.
This was problematic before the assassination attempt on President Trump.
For one thing, it is not clear that another candidate could legally replace Biden on the ballot in all 50 states. There’s also the issue of whether another candidate could use Biden’s campaign funds or not. And finally, there’s the fact that Biden himself doesn’t want to step down.
The attempted assassination of Donald Trump has changed all of this. NO other candidate will want to run for President in 2024. The potential upside of doing so is gone.
This presents Team Biden with a MAJOR problem.
Because of the questions concerning President Biden’s cognitive health, the President and his campaign staff had doubled down on vilifying former President Trump as its primary campaign strategy. In their minds, the only way to distract from Biden’s cognitive issues or paint him in a more positive light relative to his opponent was to the depict Trump as a “dictator” or “evil.”
Following the attempted assassination of President Trump, that strategy is now politically impossible. As I noted before, every decent American is horrified by the assassination attempt. Consequently, Biden cannot portray Trump as a monster after what happened without offending potential voters,
Put simply, following what happened on Saturday, President Biden is now a candidate with no viable campaign strategy… and questionable cognitive functioning.
Which means…
Former President Trump is going win the 2024 Presidential election.
If you don’t believe me, consider what the betting markets are saying. From April until the June debate, the two candidates’ betting odds were within spitting distance of each other.
Then the debate happened, and the odds of President Biden winning the election, represented by the purple line in the chart below, cratered. And following Saturday’s assassination attempt, the odds of President Trump winning, as represented by the light blue line, have skyrocketed.
As I write this, there is now a 71% chance of Trump winning.
The stock market is forward looking, which means that starting today, the market is going to begin discounting a Trump win.
This will benefit certain sectors and stocks more than others. And those investors who are properly positioned stand to make potential fortunes.
With that in mind, we are publishing a Special Investment Report detailing precisely which stocks will explode higher based on a second Trump term on Wednesday of this week.
Normally, I’d sell this report for $499, but today I’m giving it away for FREE to anyone who takes out a 30-day trial to my stock picking newsletter, Long Term Alpha.
Long TermAlpha is designed for one thing: crushing the market with extraordinary stock picking.
Since inception, Long Term Alpha has maintained a win rate of 100%.
That is correct, we’ve made money on every single investment we’ve made.
I’m not talking about small gains either… our portfolio currently has winners of 24%, 36%, 52%, even 158%.
And that’s just in the last NINE MONTHS!
If you act now, you can try Long Term Alpha for 30 days for just $9.99.
You’ll immediately receive ALL my investment picks, a copy of my best-selling book… and on Wednesday, one of the only people on the planet to receive my Special Investment Report detailing which stocks will EXPLODE higher during a second Trump term.
Heck, the book alone is worth $9.99, so you’re getting everything else, including the Special Investment Report, FREE!
To take action and prepare your portfolio to profit in ways your neighbors’ and co-workers’ won’t….
In the coming weeks, you’re going to hear a LOT about the Sahm Rule.
The Sahm Rule is an indicator that has accurately predicted every recession since the 1960s. In its simplest form, the Sahm Rule compares 3-Month Moving Average for the unemployment rate to the lowest unemployment rate in the prior 12 months.
If the difference between the two numbers is 0.5% or greater, it indicates a recession has begun.
As I mentioned a moment ago, this indicator has predicted every recession since 1960. The below chart shows the Sahm Rule measure (blue line) as well as historic recessions (gray bars). You can see its accuracy for yourself.
I bring all of this up, because the current Sahm Rule reading is 0.37%. And it is HIGHLY likely this metric will hit 0.4%, if not 0.5% some time this summer.
When this happens nearly every guru and strategist on the planet is going to start proclaiming that a recession is here. And they are going to start telling their clients to “sell the farm” on their stock portfolios.
However, for those of us who are interested in making REAL MONEY from our portfolios, it’s important to note that there is a BIG difference between the U.S. today and the U.S. during prior periods in which the Sahm Rule triggered a recession warning.
That difference?
Claudia Sahm, the creator of the Sahm Rule, notes that the U.S. has added 3.3 million people in net immigration in 2023. To provide some context, the U.S. added just 900,000 on average every year from 2010-2019.
As Sahm noted to Business Insider, the immigration process is time consuming. As a result, many immigrants are unable to legally find work after entering the labor force.
The end result?
The number of unemployed people jumps rapidly, resulting in a higher unemployment rate, which will trigger a Sahm Rule recession warning. But this jump in unemployment rate is due to immigration not people who were working losing their jobs.
Put simply, the coming Sahm Rule signal (or at the very least warning) is likely to be a false positive, meaning that it is NOT actually signaling a recession has arrived.
This will make it the EIGHTH false positive for a recession indicator during this business cycle. You’d think after seven false positives that people would begin to catch on that things are different this time.
After all, as investors, our job is to make money, not look for any excuse to dump stocks and panic about something bad happening. And as I’ve outlined in recent articles, this means riding bull markets for as long as possible, and then side-stepping bear markets when they eventually hit.
In the very simplest of terms, you need to be invested in stocks, until an objective, verifiable tool (not your feelings or limiting beliefs) tells you it’s time to “get out.”
I’ve developed a tool that takes ALL of the guessing work out of this problem. With just one look at this tool, you can tell whether it’s a good time to buy stocks or not. I detail it, along with what it’s currently saying about the market today in a Special Investment Report How to Predict a Crash.